
|
|||||
|
 | |
| |
| |
| |
| |
| |
|
Gene: DYNC1LI1 |
Gene summary for DYNC1LI1 |
| Gene information | Species | Human | Gene symbol | DYNC1LI1 | Gene ID | 51143 |
| Gene name | dynein cytoplasmic 1 light intermediate chain 1 | |
| Gene Alias | DLC-A | |
| Cytomap | 3p22.3 | |
| Gene Type | protein-coding | GO ID | GO:0000070 | UniProtAcc | E9PHI6 |
Top |
Malignant transformation analysis |
| Identification of the aberrant gene expression in precancerous and cancerous lesions by comparing the gene expression of stem-like cells in diseased tissues with normal stem cells |
| Entrez ID | Symbol | Replicates | Species | Organ | Tissue | Adj P-value | Log2FC | Malignancy |
| 51143 | DYNC1LI1 | LZE4T | Human | Esophagus | ESCC | 5.52e-18 | 4.02e-01 | 0.0811 |
| 51143 | DYNC1LI1 | LZE7T | Human | Esophagus | ESCC | 1.08e-05 | 2.47e-01 | 0.0667 |
| 51143 | DYNC1LI1 | LZE22T | Human | Esophagus | ESCC | 4.26e-02 | 1.44e-01 | 0.068 |
| 51143 | DYNC1LI1 | LZE24T | Human | Esophagus | ESCC | 5.24e-10 | 2.00e-01 | 0.0596 |
| 51143 | DYNC1LI1 | LZE6T | Human | Esophagus | ESCC | 4.06e-03 | 1.45e-01 | 0.0845 |
| 51143 | DYNC1LI1 | P1T-E | Human | Esophagus | ESCC | 2.26e-07 | 2.46e-01 | 0.0875 |
| 51143 | DYNC1LI1 | P2T-E | Human | Esophagus | ESCC | 5.25e-22 | 2.85e-01 | 0.1177 |
| 51143 | DYNC1LI1 | P4T-E | Human | Esophagus | ESCC | 1.65e-22 | 4.89e-01 | 0.1323 |
| 51143 | DYNC1LI1 | P5T-E | Human | Esophagus | ESCC | 1.91e-11 | 2.89e-01 | 0.1327 |
| 51143 | DYNC1LI1 | P8T-E | Human | Esophagus | ESCC | 3.05e-21 | 1.85e-01 | 0.0889 |
| 51143 | DYNC1LI1 | P9T-E | Human | Esophagus | ESCC | 2.63e-13 | 3.59e-01 | 0.1131 |
| 51143 | DYNC1LI1 | P10T-E | Human | Esophagus | ESCC | 9.66e-24 | 3.31e-01 | 0.116 |
| 51143 | DYNC1LI1 | P11T-E | Human | Esophagus | ESCC | 4.19e-07 | 3.67e-01 | 0.1426 |
| 51143 | DYNC1LI1 | P12T-E | Human | Esophagus | ESCC | 8.68e-08 | 2.87e-01 | 0.1122 |
| 51143 | DYNC1LI1 | P15T-E | Human | Esophagus | ESCC | 6.20e-18 | 3.03e-01 | 0.1149 |
| 51143 | DYNC1LI1 | P16T-E | Human | Esophagus | ESCC | 2.17e-20 | 2.63e-01 | 0.1153 |
| 51143 | DYNC1LI1 | P17T-E | Human | Esophagus | ESCC | 2.97e-11 | 4.12e-01 | 0.1278 |
| 51143 | DYNC1LI1 | P19T-E | Human | Esophagus | ESCC | 1.64e-08 | 5.61e-01 | 0.1662 |
| 51143 | DYNC1LI1 | P20T-E | Human | Esophagus | ESCC | 3.76e-21 | 2.76e-01 | 0.1124 |
| 51143 | DYNC1LI1 | P21T-E | Human | Esophagus | ESCC | 3.51e-22 | 4.46e-01 | 0.1617 |
| Page: 1 2 3 4 5 6 |
| Tissue | Expression Dynamics | Abbreviation |
| Esophagus | 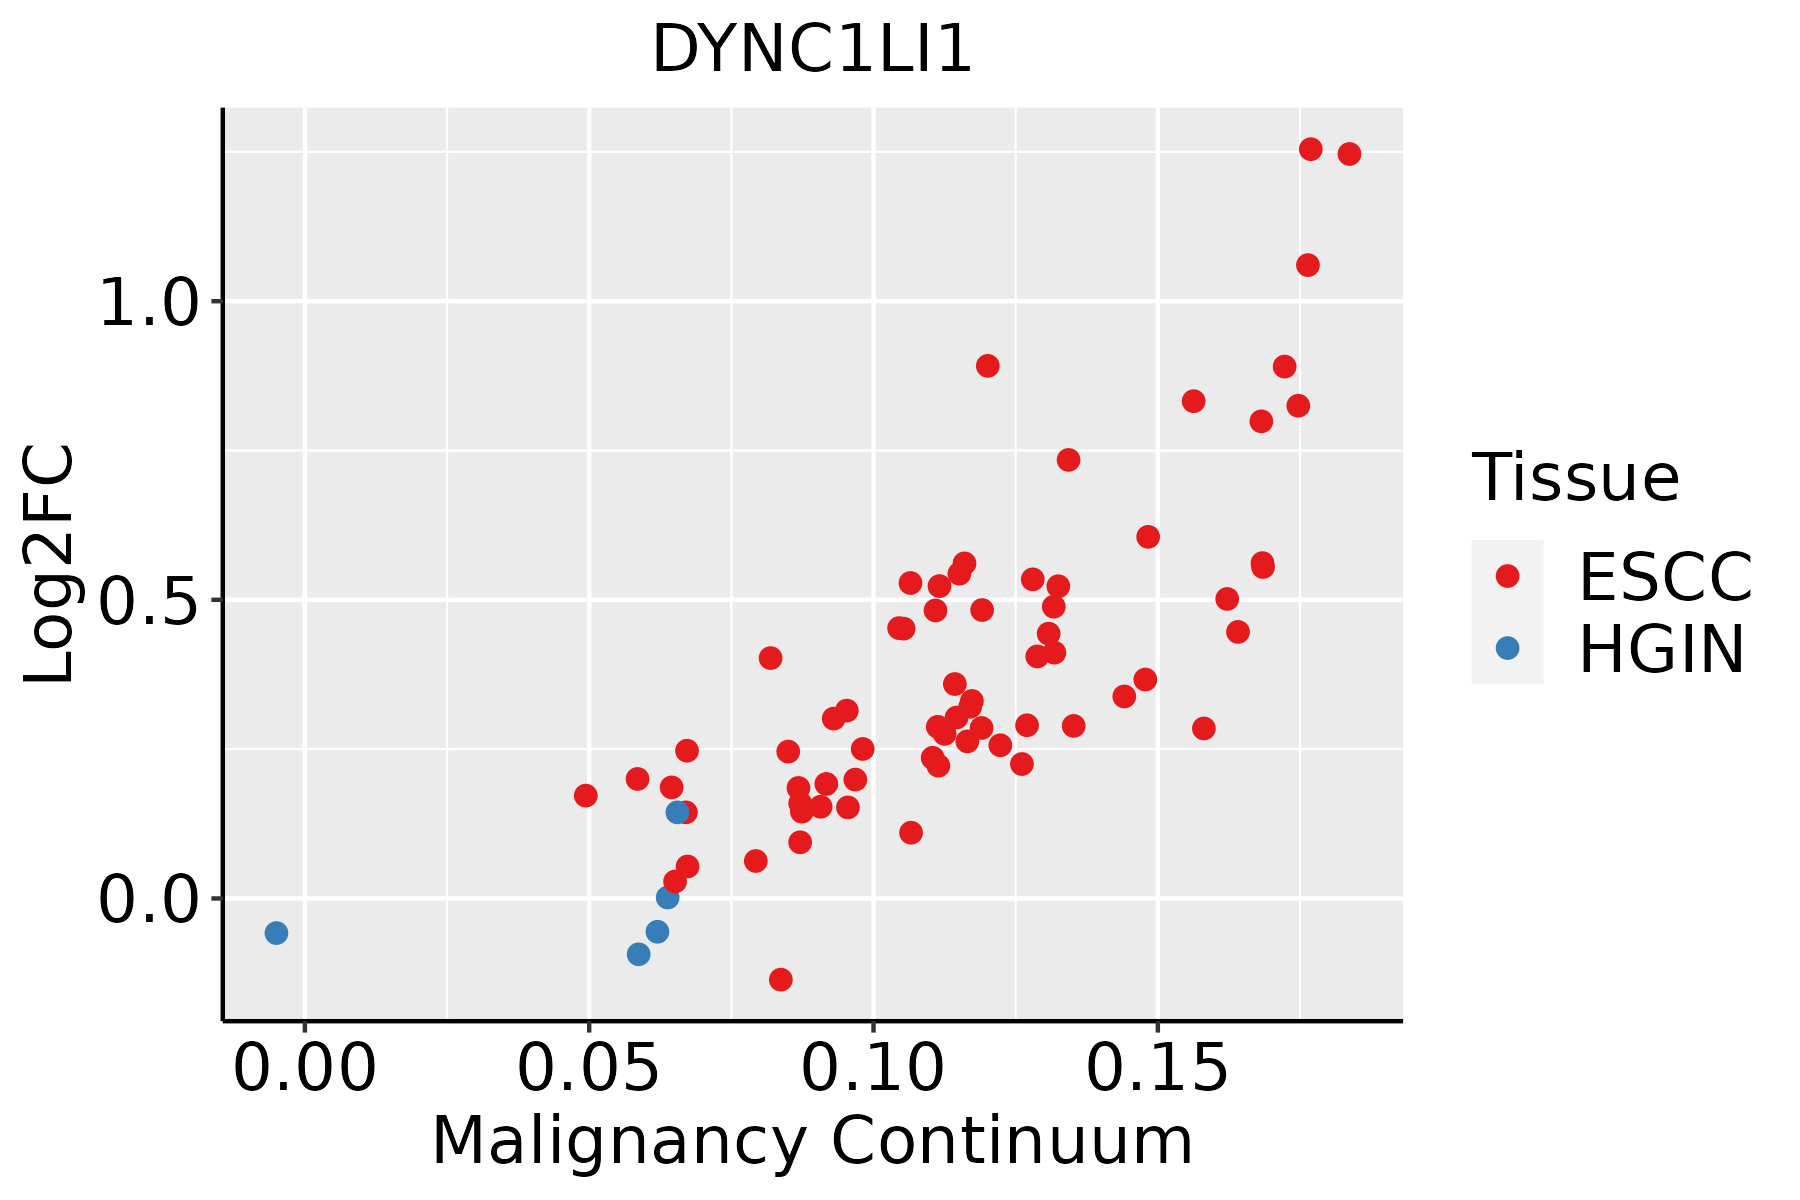 | ESCC: Esophageal squamous cell carcinoma |
| HGIN: High-grade intraepithelial neoplasias | ||
| LGIN: Low-grade intraepithelial neoplasias | ||
| Liver |  | HCC: Hepatocellular carcinoma |
| NAFLD: Non-alcoholic fatty liver disease | ||
| Oral Cavity | 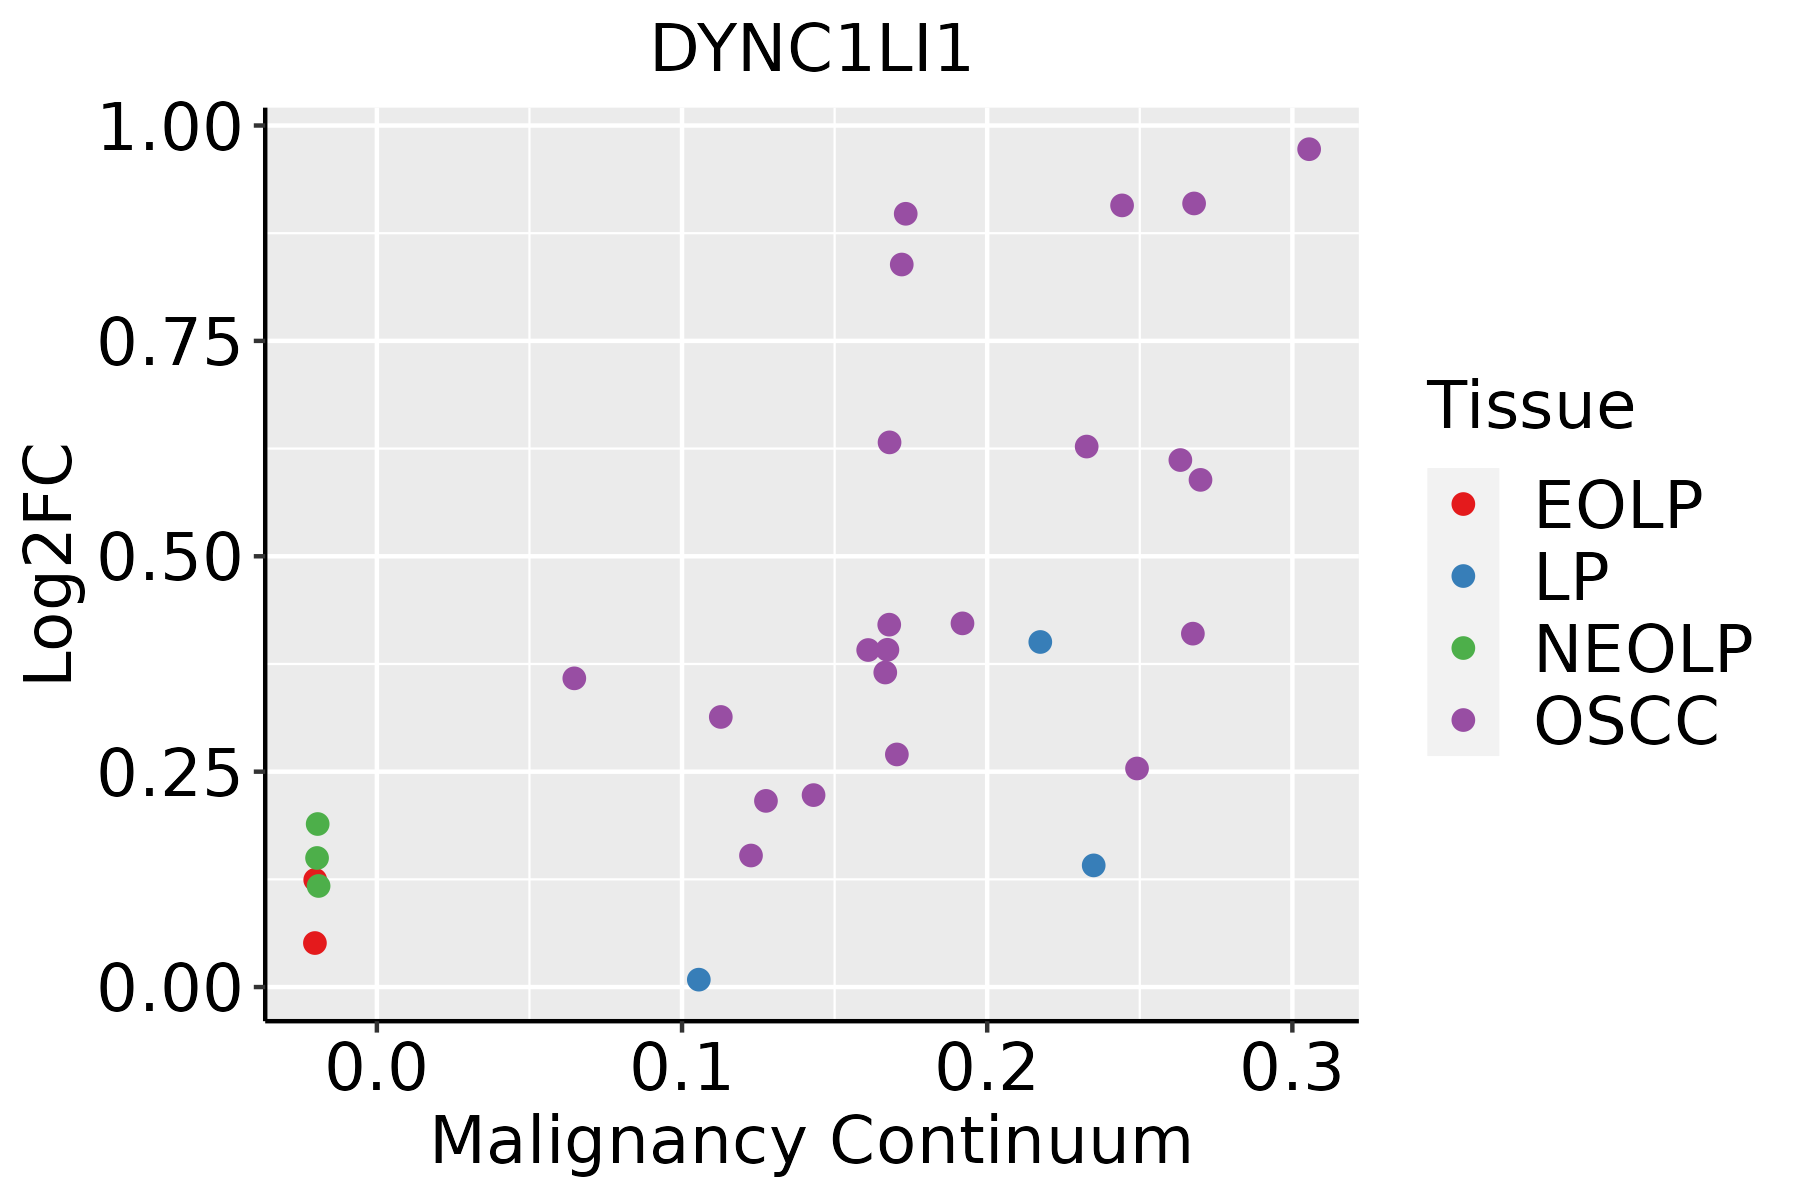 | EOLP: Erosive Oral lichen planus |
| LP: leukoplakia | ||
| NEOLP: Non-erosive oral lichen planus | ||
| OSCC: Oral squamous cell carcinoma | ||
| Skin |  | AK: Actinic keratosis |
| cSCC: Cutaneous squamous cell carcinoma | ||
| SCCIS:squamous cell carcinoma in situ | ||
| Thyroid | 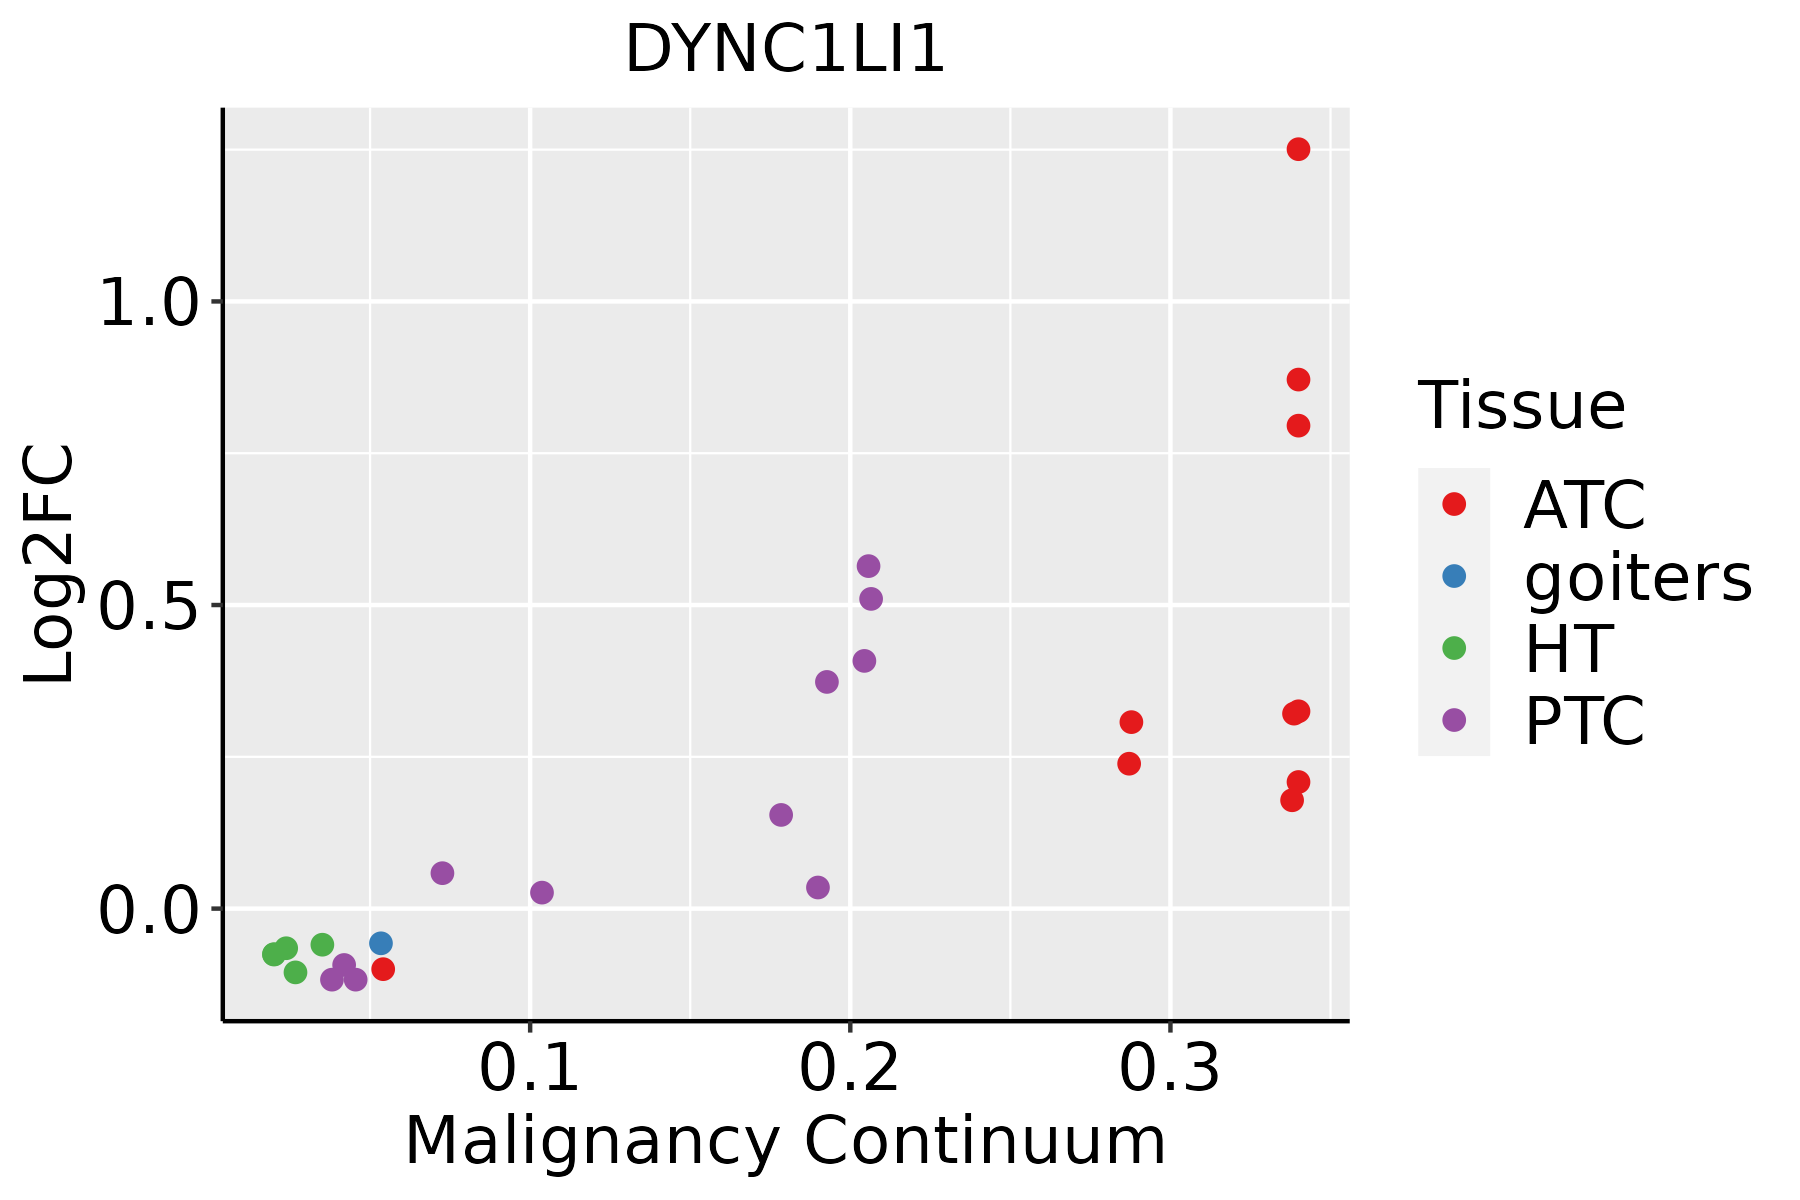 | ATC: Anaplastic thyroid cancer |
| HT: Hashimoto's thyroiditis | ||
| PTC: Papillary thyroid cancer |
| ∗log2FC in expression of this searched gene in stem-like cells from each diseased tissue sample relative to stem-like cells in normal samples in each tissue plotted against the malignancy continuum. Samples are colored based on if they are from different disease stage. |
Top |
Malignant transformation related pathway analysis |
| Find out the enriched GO biological processes and KEGG pathways involved in transition from healthy to precancer to cancer |
| Tissue | Disease Stage | Enriched GO biological Processes |
| Colorectum | AD |  |
| Colorectum | SER |  |
| Colorectum | MSS |  |
| Colorectum | MSI-H |  |
| Colorectum | FAP |  |
| ∗Top 15 enriched GO BP terms are showed in the bar plot of each disease state in each tissue. Each row represents a significant GO biological process which is colored according to the -log10(p.adjust). |
| Page: 1 2 3 4 5 6 7 8 9 |
| GO ID | Tissue | Disease Stage | Description | Gene Ratio | Bg Ratio | pvalue | p.adjust | Count |
| GO:014001414 | Esophagus | ESCC | mitotic nuclear division | 218/8552 | 287/18723 | 6.17e-26 | 1.78e-23 | 218 |
| GO:000007011 | Esophagus | ESCC | mitotic sister chromatid segregation | 138/8552 | 168/18723 | 1.37e-22 | 2.63e-20 | 138 |
| GO:00008194 | Esophagus | ESCC | sister chromatid segregation | 157/8552 | 202/18723 | 8.41e-21 | 1.33e-18 | 157 |
| GO:003304416 | Esophagus | ESCC | regulation of chromosome organization | 145/8552 | 187/18723 | 3.80e-19 | 4.31e-17 | 145 |
| GO:000705911 | Esophagus | ESCC | chromosome segregation | 238/8552 | 346/18723 | 1.72e-18 | 1.82e-16 | 238 |
| GO:004477216 | Esophagus | ESCC | mitotic cell cycle phase transition | 281/8552 | 424/18723 | 4.63e-18 | 4.45e-16 | 281 |
| GO:000734615 | Esophagus | ESCC | regulation of mitotic cell cycle | 293/8552 | 457/18723 | 8.00e-16 | 5.64e-14 | 293 |
| GO:00482853 | Esophagus | ESCC | organelle fission | 301/8552 | 488/18723 | 4.64e-13 | 2.12e-11 | 301 |
| GO:00988133 | Esophagus | ESCC | nuclear chromosome segregation | 187/8552 | 281/18723 | 1.00e-12 | 4.36e-11 | 187 |
| GO:00002802 | Esophagus | ESCC | nuclear division | 270/8552 | 439/18723 | 1.17e-11 | 4.24e-10 | 270 |
| GO:190198713 | Esophagus | ESCC | regulation of cell cycle phase transition | 242/8552 | 390/18723 | 3.86e-11 | 1.26e-09 | 242 |
| GO:190199013 | Esophagus | ESCC | regulation of mitotic cell cycle phase transition | 191/8552 | 299/18723 | 1.35e-10 | 3.94e-09 | 191 |
| GO:00457865 | Esophagus | ESCC | negative regulation of cell cycle | 236/8552 | 385/18723 | 3.62e-10 | 9.93e-09 | 236 |
| GO:00000754 | Esophagus | ESCC | cell cycle checkpoint | 117/8552 | 169/18723 | 4.47e-10 | 1.17e-08 | 117 |
| GO:0010639110 | Esophagus | ESCC | negative regulation of organelle organization | 215/8552 | 348/18723 | 8.20e-10 | 2.01e-08 | 215 |
| GO:004578710 | Esophagus | ESCC | positive regulation of cell cycle | 196/8552 | 313/18723 | 9.27e-10 | 2.24e-08 | 196 |
| GO:00070934 | Esophagus | ESCC | mitotic cell cycle checkpoint | 90/8552 | 129/18723 | 2.49e-08 | 4.69e-07 | 90 |
| GO:00519833 | Esophagus | ESCC | regulation of chromosome segregation | 67/8552 | 91/18723 | 5.42e-08 | 9.66e-07 | 67 |
| GO:00070883 | Esophagus | ESCC | regulation of mitotic nuclear division | 78/8552 | 110/18723 | 6.96e-08 | 1.21e-06 | 78 |
| GO:00070912 | Esophagus | ESCC | metaphase/anaphase transition of mitotic cell cycle | 49/8552 | 62/18723 | 7.65e-08 | 1.33e-06 | 49 |
| Page: 1 2 3 4 5 6 7 8 9 10 11 12 13 14 15 16 17 |
| Pathway ID | Tissue | Disease Stage | Description | Gene Ratio | Bg Ratio | pvalue | p.adjust | qvalue | Count |
| hsa05132211 | Esophagus | ESCC | Salmonella infection | 191/4205 | 249/8465 | 6.51e-19 | 5.45e-17 | 2.79e-17 | 191 |
| hsa0414530 | Esophagus | ESCC | Phagosome | 100/4205 | 152/8465 | 3.81e-05 | 1.72e-04 | 8.82e-05 | 100 |
| hsa0496223 | Esophagus | ESCC | Vasopressin-regulated water reabsorption | 33/4205 | 44/8465 | 5.27e-04 | 1.78e-03 | 9.13e-04 | 33 |
| hsa05132310 | Esophagus | ESCC | Salmonella infection | 191/4205 | 249/8465 | 6.51e-19 | 5.45e-17 | 2.79e-17 | 191 |
| hsa04145114 | Esophagus | ESCC | Phagosome | 100/4205 | 152/8465 | 3.81e-05 | 1.72e-04 | 8.82e-05 | 100 |
| hsa0496233 | Esophagus | ESCC | Vasopressin-regulated water reabsorption | 33/4205 | 44/8465 | 5.27e-04 | 1.78e-03 | 9.13e-04 | 33 |
| hsa0513242 | Liver | HCC | Salmonella infection | 178/4020 | 249/8465 | 5.90e-15 | 1.98e-13 | 1.10e-13 | 178 |
| hsa0414521 | Liver | HCC | Phagosome | 93/4020 | 152/8465 | 4.27e-04 | 1.88e-03 | 1.05e-03 | 93 |
| hsa049624 | Liver | HCC | Vasopressin-regulated water reabsorption | 30/4020 | 44/8465 | 4.41e-03 | 1.32e-02 | 7.34e-03 | 30 |
| hsa0513252 | Liver | HCC | Salmonella infection | 178/4020 | 249/8465 | 5.90e-15 | 1.98e-13 | 1.10e-13 | 178 |
| hsa0414531 | Liver | HCC | Phagosome | 93/4020 | 152/8465 | 4.27e-04 | 1.88e-03 | 1.05e-03 | 93 |
| hsa0496211 | Liver | HCC | Vasopressin-regulated water reabsorption | 30/4020 | 44/8465 | 4.41e-03 | 1.32e-02 | 7.34e-03 | 30 |
| hsa0513230 | Oral cavity | OSCC | Salmonella infection | 174/3704 | 249/8465 | 2.67e-17 | 1.49e-15 | 7.58e-16 | 174 |
| hsa0414528 | Oral cavity | OSCC | Phagosome | 88/3704 | 152/8465 | 2.83e-04 | 9.13e-04 | 4.65e-04 | 88 |
| hsa049626 | Oral cavity | OSCC | Vasopressin-regulated water reabsorption | 29/3704 | 44/8465 | 2.47e-03 | 6.52e-03 | 3.32e-03 | 29 |
| hsa05132114 | Oral cavity | OSCC | Salmonella infection | 174/3704 | 249/8465 | 2.67e-17 | 1.49e-15 | 7.58e-16 | 174 |
| hsa04145113 | Oral cavity | OSCC | Phagosome | 88/3704 | 152/8465 | 2.83e-04 | 9.13e-04 | 4.65e-04 | 88 |
| hsa0496213 | Oral cavity | OSCC | Vasopressin-regulated water reabsorption | 29/3704 | 44/8465 | 2.47e-03 | 6.52e-03 | 3.32e-03 | 29 |
| hsa0513245 | Oral cavity | EOLP | Salmonella infection | 78/1218 | 249/8465 | 3.66e-12 | 2.37e-10 | 1.40e-10 | 78 |
| hsa0414543 | Oral cavity | EOLP | Phagosome | 38/1218 | 152/8465 | 3.42e-04 | 1.42e-03 | 8.35e-04 | 38 |
| Page: 1 2 |
Top |
Cell-cell communication analysis |
| Identification of potential cell-cell interactions between two cell types and their ligand-receptor pairs for different disease states |
| Ligand | Receptor | LRpair | Pathway | Tissue | Disease Stage |
| Page: 1 |
Top |
Single-cell gene regulatory network inference analysis |
| Find out the significant the regulons (TFs) and the target genes of each regulon across cell types for different disease states |
| TF | Cell Type | Tissue | Disease Stage | Target Gene | RSS | Regulon Activity |
| ∗The dot plots of a searched regulon are shown for all cell subpopulations in each disease state of each tissue based on the regulon specific score inferred using pySCENIC and by calculating the average expression. |
| Page: 1 |
Top |
Somatic mutation of malignant transformation related genes |
| Annotation of somatic variants for genes involved in malignant transformation |
| Hugo Symbol | Variant Class | Variant Classification | dbSNP RS | HGVSc | HGVSp | HGVSp Short | SWISSPROT | BIOTYPE | SIFT | PolyPhen | Tumor Sample Barcode | Tissue | Histology | Sex | Age | Stage | Therapy Types | Drugs | Outcome |
| DYNC1LI1 | SNV | Missense_Mutation | c.30C>A | p.Phe10Leu | p.F10L | Q9Y6G9 | protein_coding | tolerated_low_confidence(0.13) | possibly_damaging(0.827) | TCGA-5L-AAT1-01 | Breast | breast invasive carcinoma | Female | <65 | III/IV | Hormone Therapy | letrozol | SD | |
| DYNC1LI1 | SNV | Missense_Mutation | c.1365N>C | p.Lys455Asn | p.K455N | Q9Y6G9 | protein_coding | deleterious(0.02) | probably_damaging(0.998) | TCGA-AC-A23H-01 | Breast | breast invasive carcinoma | Female | >=65 | I/II | Unknown | Unknown | PD | |
| DYNC1LI1 | SNV | Missense_Mutation | c.857N>T | p.Ser286Leu | p.S286L | Q9Y6G9 | protein_coding | deleterious(0) | probably_damaging(0.995) | TCGA-AC-A23H-01 | Breast | breast invasive carcinoma | Female | >=65 | I/II | Unknown | Unknown | PD | |
| DYNC1LI1 | SNV | Missense_Mutation | c.784N>A | p.Glu262Lys | p.E262K | Q9Y6G9 | protein_coding | deleterious(0) | probably_damaging(0.928) | TCGA-AC-A23H-01 | Breast | breast invasive carcinoma | Female | >=65 | I/II | Unknown | Unknown | PD | |
| DYNC1LI1 | deletion | Frame_Shift_Del | rs748891796 | c.1288delN | p.Ile430LeufsTer5 | p.I430Lfs*5 | Q9Y6G9 | protein_coding | TCGA-AO-A128-01 | Breast | breast invasive carcinoma | Female | <65 | I/II | Chemotherapy | doxorubicin | SD | ||
| DYNC1LI1 | SNV | Missense_Mutation | c.325G>A | p.Glu109Lys | p.E109K | Q9Y6G9 | protein_coding | deleterious(0) | benign(0.217) | TCGA-C5-A1BE-01 | Cervix | cervical & endocervical cancer | Female | <65 | I/II | Chemotherapy | cisplatin | PD | |
| DYNC1LI1 | SNV | Missense_Mutation | c.95N>T | p.Ser32Leu | p.S32L | Q9Y6G9 | protein_coding | tolerated(0.22) | benign(0.045) | TCGA-EK-A3GK-01 | Cervix | cervical & endocervical cancer | Female | <65 | I/II | Unknown | Unknown | SD | |
| DYNC1LI1 | insertion | Frame_Shift_Ins | novel | c.1288_1289insA | p.Ile430AsnfsTer2 | p.I430Nfs*2 | Q9Y6G9 | protein_coding | TCGA-EA-A410-01 | Cervix | cervical & endocervical cancer | Female | <65 | I/II | Unknown | Unknown | SD | ||
| DYNC1LI1 | SNV | Missense_Mutation | c.1118N>G | p.Gln373Arg | p.Q373R | Q9Y6G9 | protein_coding | deleterious(0) | probably_damaging(1) | TCGA-AZ-6599-01 | Colorectum | colon adenocarcinoma | Male | >=65 | I/II | Unknown | Unknown | SD | |
| DYNC1LI1 | SNV | Missense_Mutation | c.549N>T | p.Met183Ile | p.M183I | Q9Y6G9 | protein_coding | tolerated(0.1) | benign(0.03) | TCGA-CA-6717-01 | Colorectum | colon adenocarcinoma | Male | <65 | I/II | Chemotherapy | oxaliplatin | CR |
| Page: 1 2 3 4 5 |
Top |
Related drugs of malignant transformation related genes |
| Identification of chemicals and drugs interact with genes involved in malignant transfromation |
| (DGIdb 4.0) |
| Entrez ID | Symbol | Category | Interaction Types | Drug Claim Name | Drug Name | PMIDs |
| Page: 1 |

Copyright 2023-Present -The University of Texas Health Science Center at Houston |