
|
|||||
|
 | |
| |
| |
| |
| |
| |
|
Gene: DYNC1I2 |
Gene summary for DYNC1I2 |
| Gene information | Species | Human | Gene symbol | DYNC1I2 | Gene ID | 1781 |
| Gene name | dynein cytoplasmic 1 intermediate chain 2 | |
| Gene Alias | DIC74 | |
| Cytomap | 2q31.1 | |
| Gene Type | protein-coding | GO ID | GO:0006810 | UniProtAcc | A0A140VKE9 |
Top |
Malignant transformation analysis |
| Identification of the aberrant gene expression in precancerous and cancerous lesions by comparing the gene expression of stem-like cells in diseased tissues with normal stem cells |
| Entrez ID | Symbol | Replicates | Species | Organ | Tissue | Adj P-value | Log2FC | Malignancy |
| 1781 | DYNC1I2 | LZE4T | Human | Esophagus | ESCC | 1.95e-09 | 3.18e-01 | 0.0811 |
| 1781 | DYNC1I2 | LZE7T | Human | Esophagus | ESCC | 3.06e-07 | 9.57e-02 | 0.0667 |
| 1781 | DYNC1I2 | LZE8T | Human | Esophagus | ESCC | 1.17e-09 | -1.03e-01 | 0.067 |
| 1781 | DYNC1I2 | LZE20T | Human | Esophagus | ESCC | 9.34e-04 | -2.99e-03 | 0.0662 |
| 1781 | DYNC1I2 | LZE22D1 | Human | Esophagus | HGIN | 1.04e-04 | -2.02e-01 | 0.0595 |
| 1781 | DYNC1I2 | LZE24T | Human | Esophagus | ESCC | 9.70e-11 | 6.15e-02 | 0.0596 |
| 1781 | DYNC1I2 | LZE6T | Human | Esophagus | ESCC | 3.99e-03 | -1.14e-01 | 0.0845 |
| 1781 | DYNC1I2 | P1T-E | Human | Esophagus | ESCC | 5.63e-10 | 1.31e-01 | 0.0875 |
| 1781 | DYNC1I2 | P2T-E | Human | Esophagus | ESCC | 1.64e-17 | 1.31e-01 | 0.1177 |
| 1781 | DYNC1I2 | P4T-E | Human | Esophagus | ESCC | 2.24e-19 | 3.63e-01 | 0.1323 |
| 1781 | DYNC1I2 | P5T-E | Human | Esophagus | ESCC | 2.95e-15 | 1.42e-01 | 0.1327 |
| 1781 | DYNC1I2 | P8T-E | Human | Esophagus | ESCC | 3.90e-22 | 1.84e-01 | 0.0889 |
| 1781 | DYNC1I2 | P9T-E | Human | Esophagus | ESCC | 5.69e-37 | 1.05e+00 | 0.1131 |
| 1781 | DYNC1I2 | P10T-E | Human | Esophagus | ESCC | 2.22e-17 | 3.39e-01 | 0.116 |
| 1781 | DYNC1I2 | P11T-E | Human | Esophagus | ESCC | 9.60e-12 | 6.60e-01 | 0.1426 |
| 1781 | DYNC1I2 | P12T-E | Human | Esophagus | ESCC | 3.72e-20 | 5.29e-01 | 0.1122 |
| 1781 | DYNC1I2 | P15T-E | Human | Esophagus | ESCC | 7.95e-27 | 5.01e-01 | 0.1149 |
| 1781 | DYNC1I2 | P16T-E | Human | Esophagus | ESCC | 1.55e-16 | 1.03e-01 | 0.1153 |
| 1781 | DYNC1I2 | P17T-E | Human | Esophagus | ESCC | 6.00e-07 | 3.62e-01 | 0.1278 |
| 1781 | DYNC1I2 | P19T-E | Human | Esophagus | ESCC | 5.84e-04 | 3.73e-01 | 0.1662 |
| Page: 1 2 3 4 5 6 7 |
| Tissue | Expression Dynamics | Abbreviation |
| Esophagus |  | ESCC: Esophageal squamous cell carcinoma |
| HGIN: High-grade intraepithelial neoplasias | ||
| LGIN: Low-grade intraepithelial neoplasias | ||
| Liver |  | HCC: Hepatocellular carcinoma |
| NAFLD: Non-alcoholic fatty liver disease | ||
| Oral Cavity | 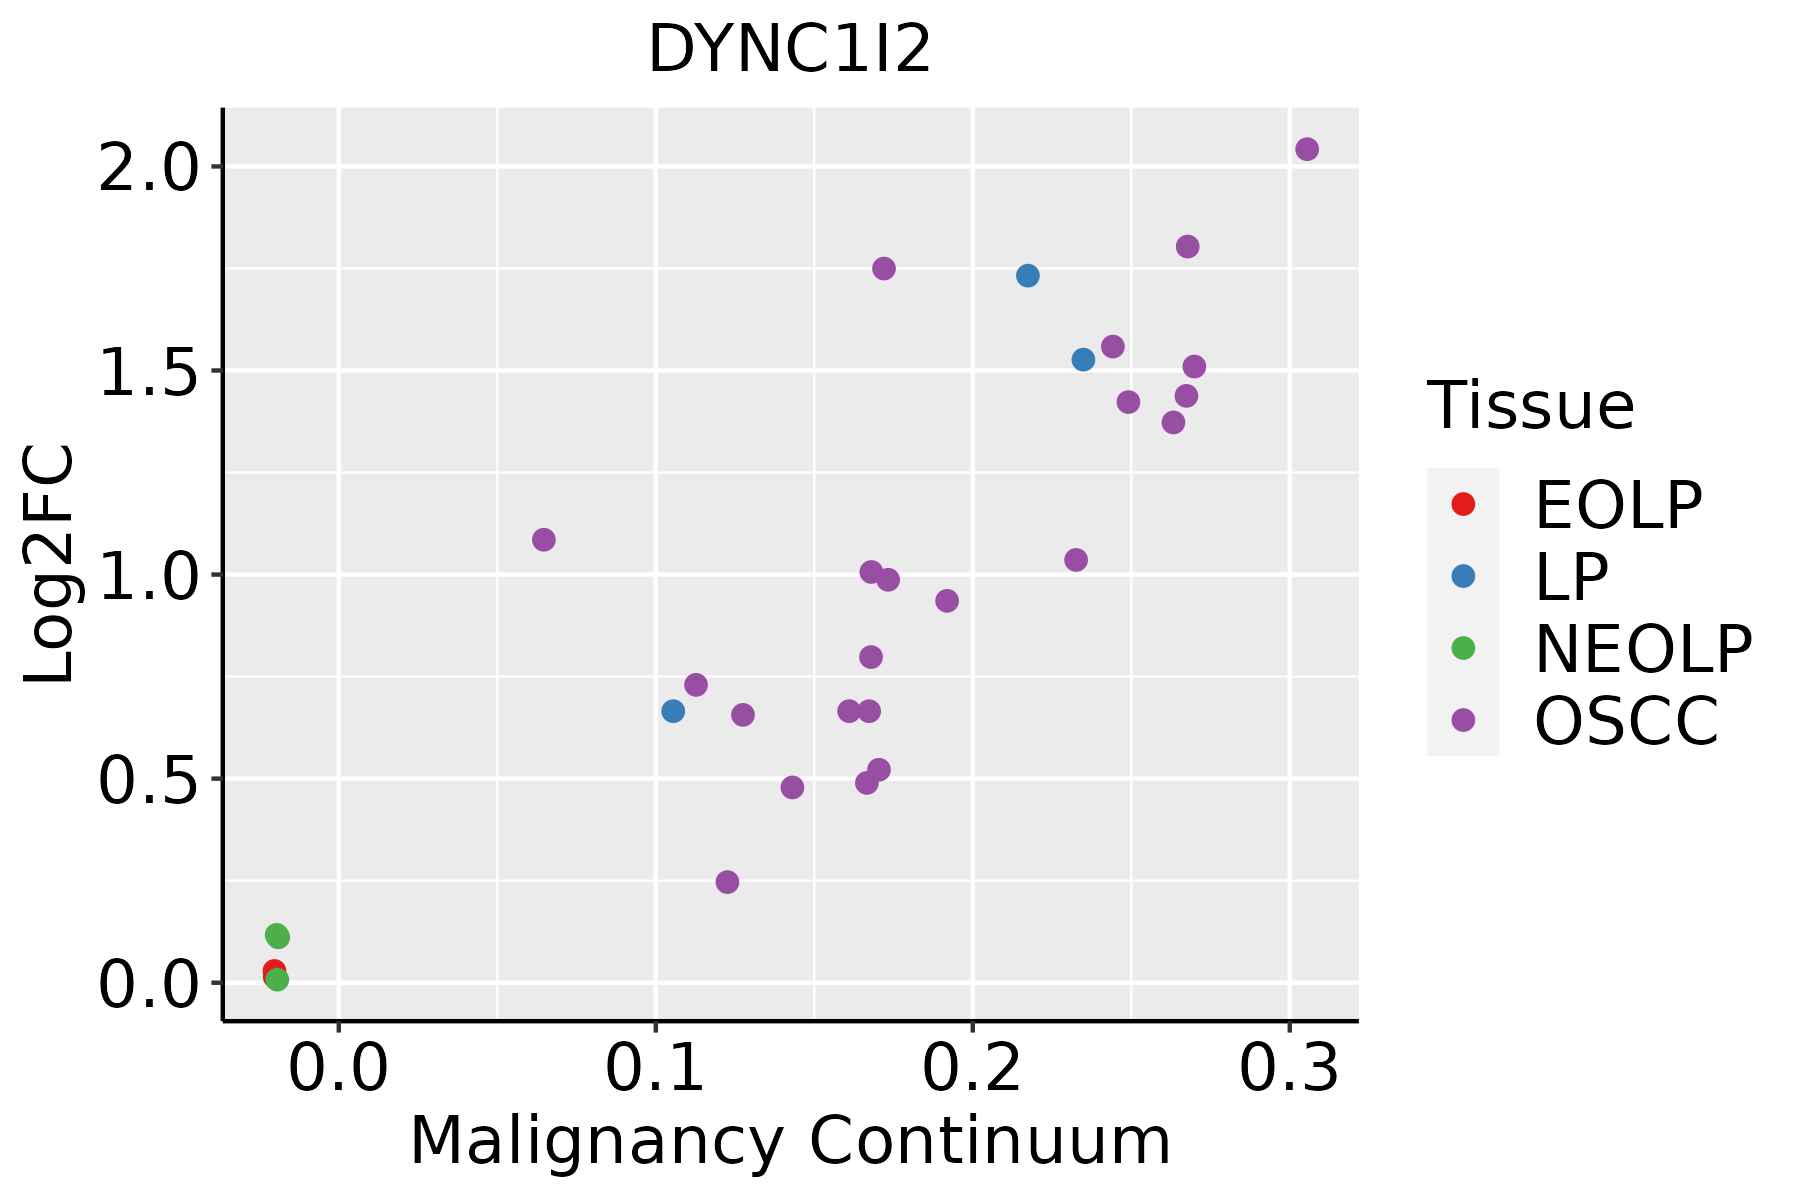 | EOLP: Erosive Oral lichen planus |
| LP: leukoplakia | ||
| NEOLP: Non-erosive oral lichen planus | ||
| OSCC: Oral squamous cell carcinoma | ||
| Prostate | 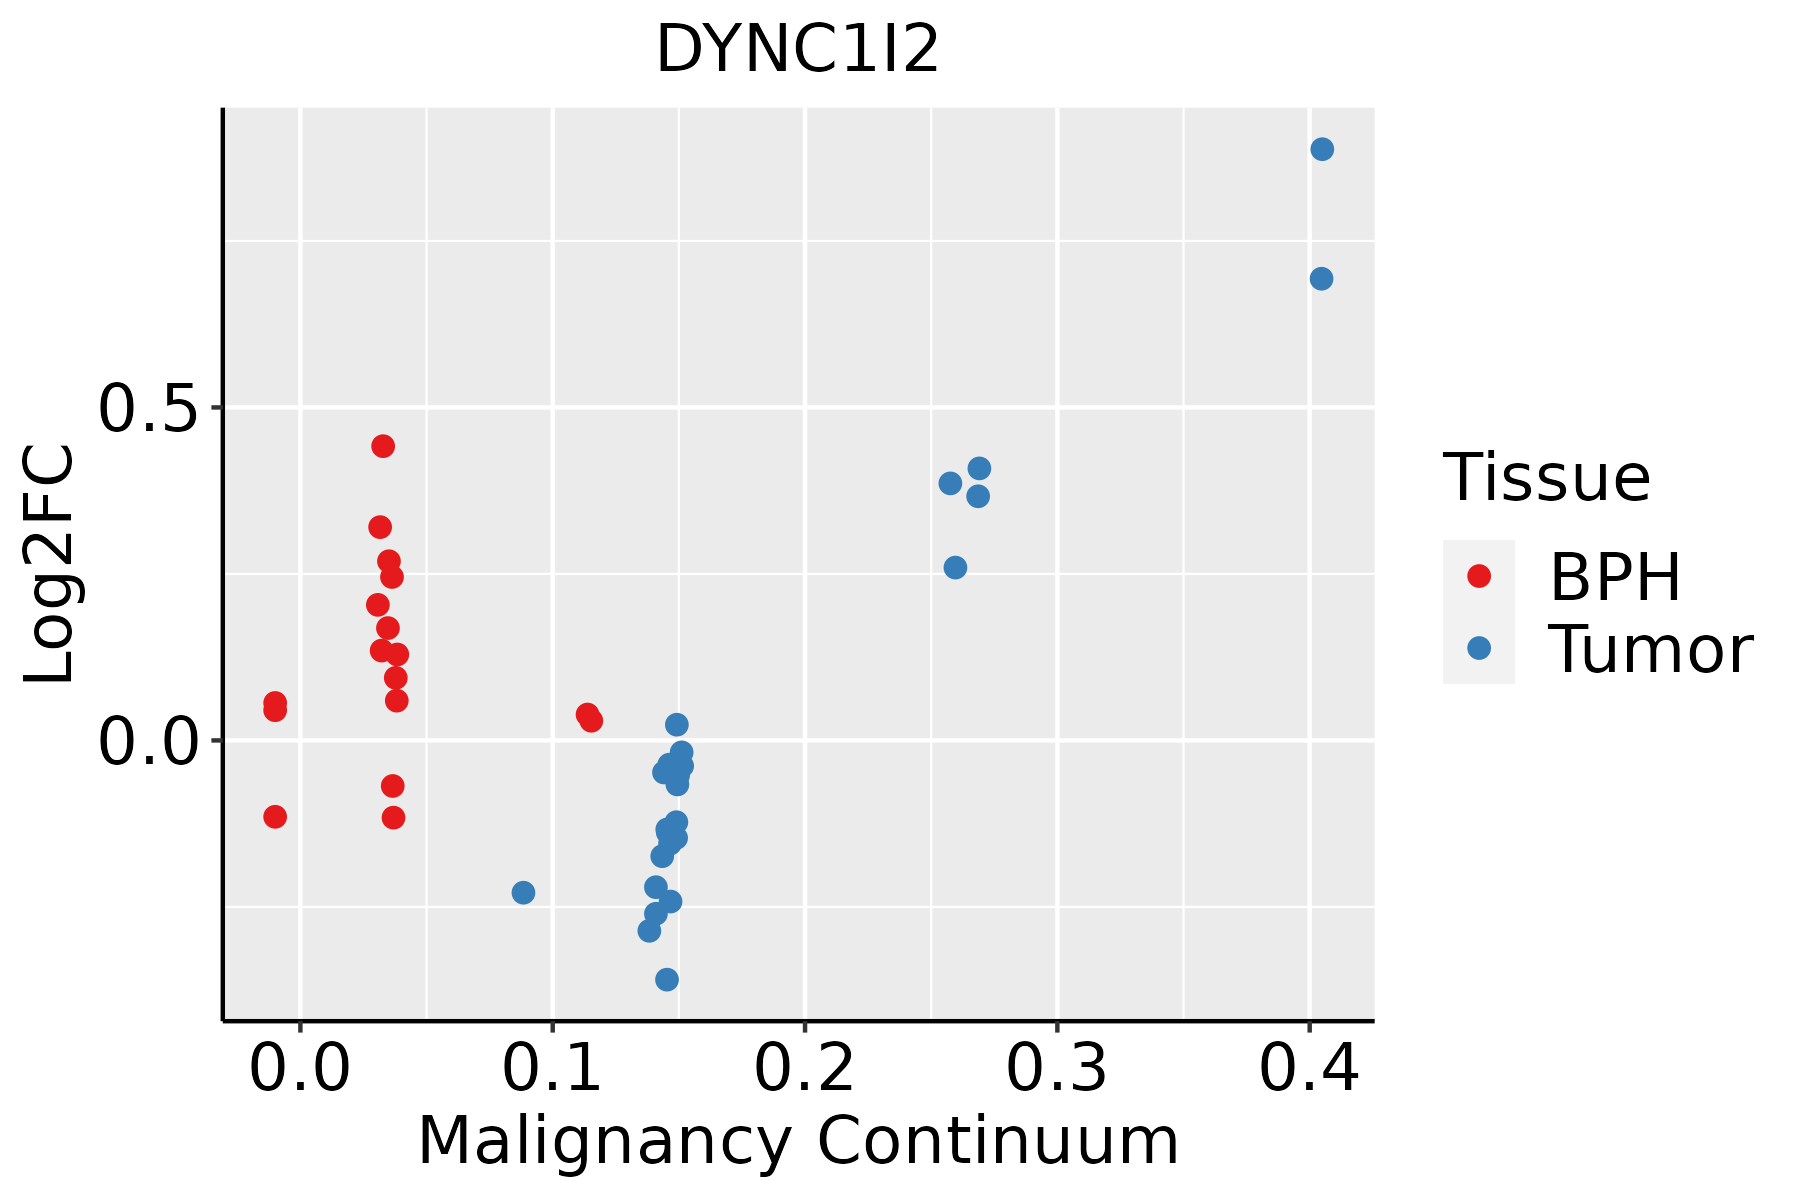 | BPH: Benign Prostatic Hyperplasia |
| Skin | 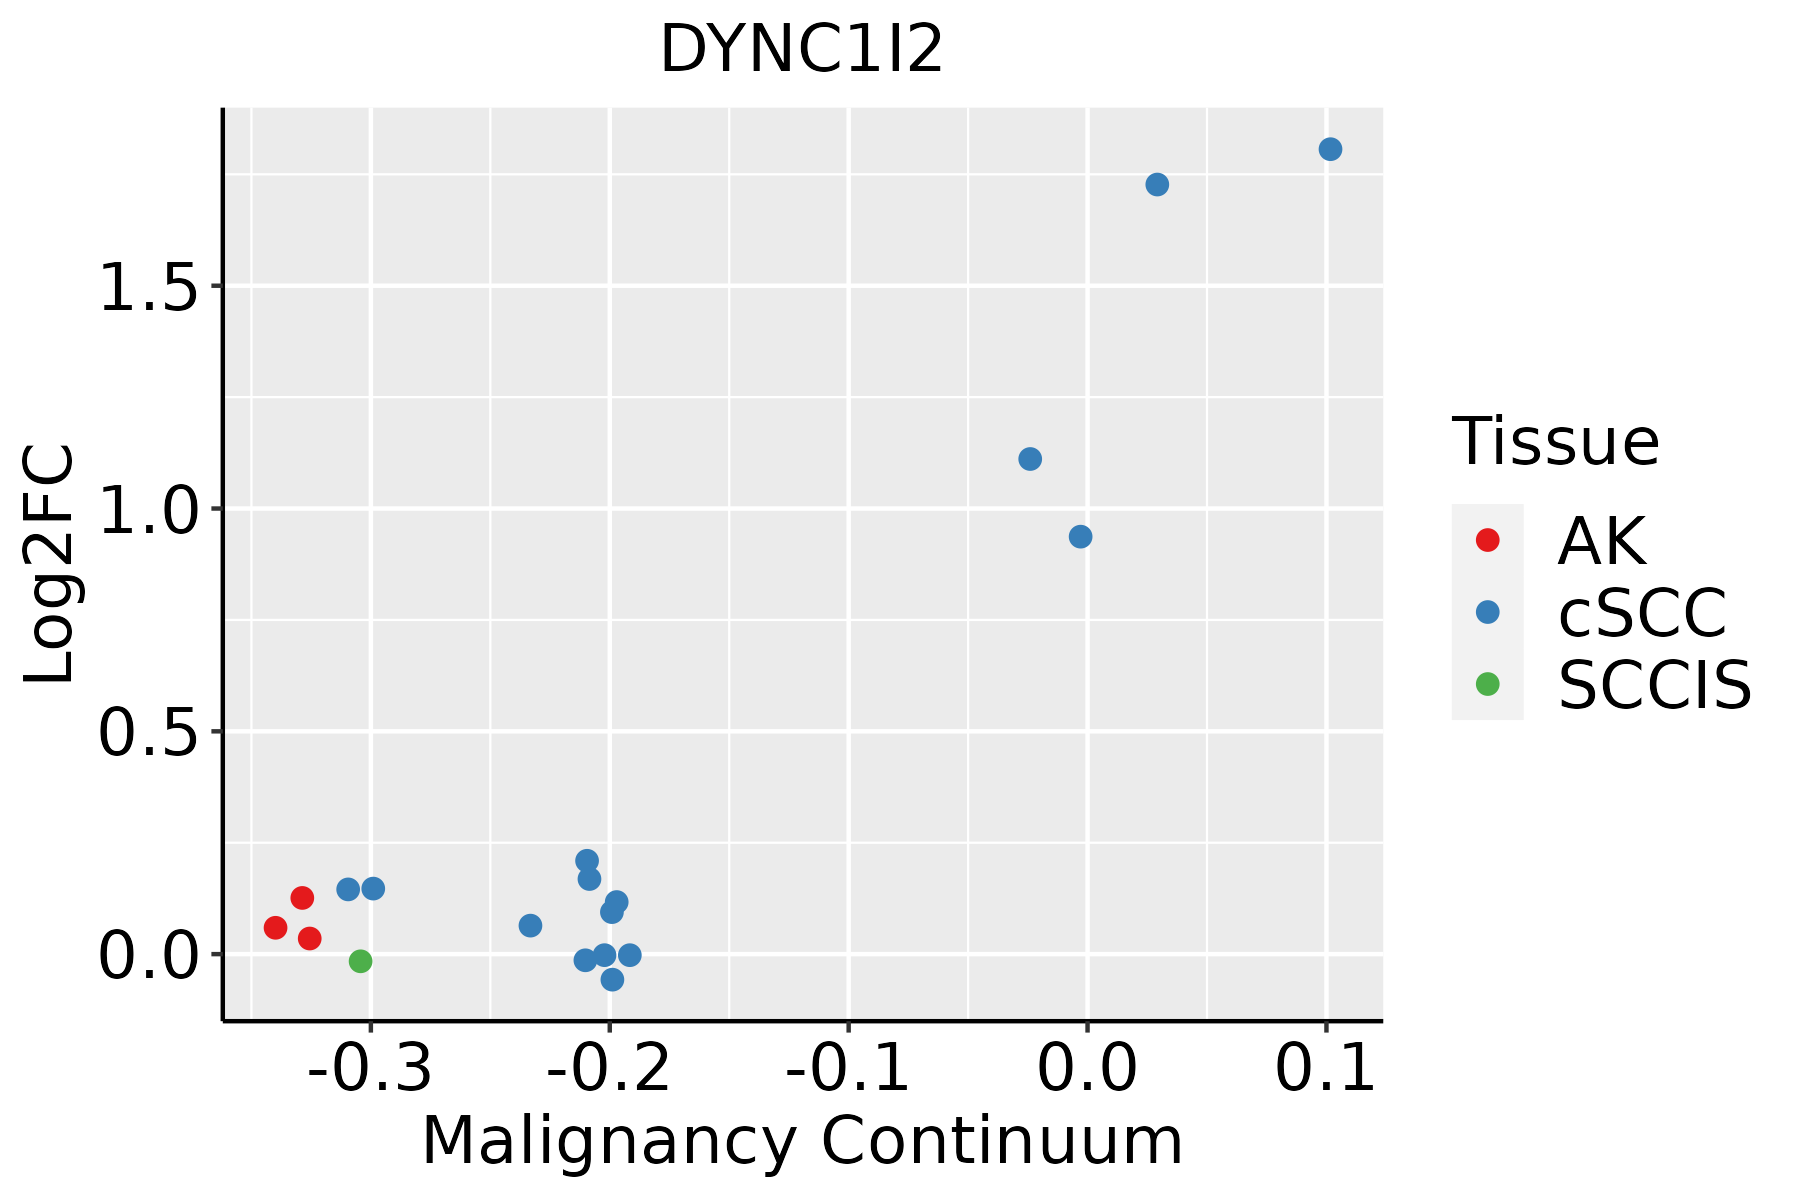 | AK: Actinic keratosis |
| cSCC: Cutaneous squamous cell carcinoma | ||
| SCCIS:squamous cell carcinoma in situ | ||
| Thyroid | 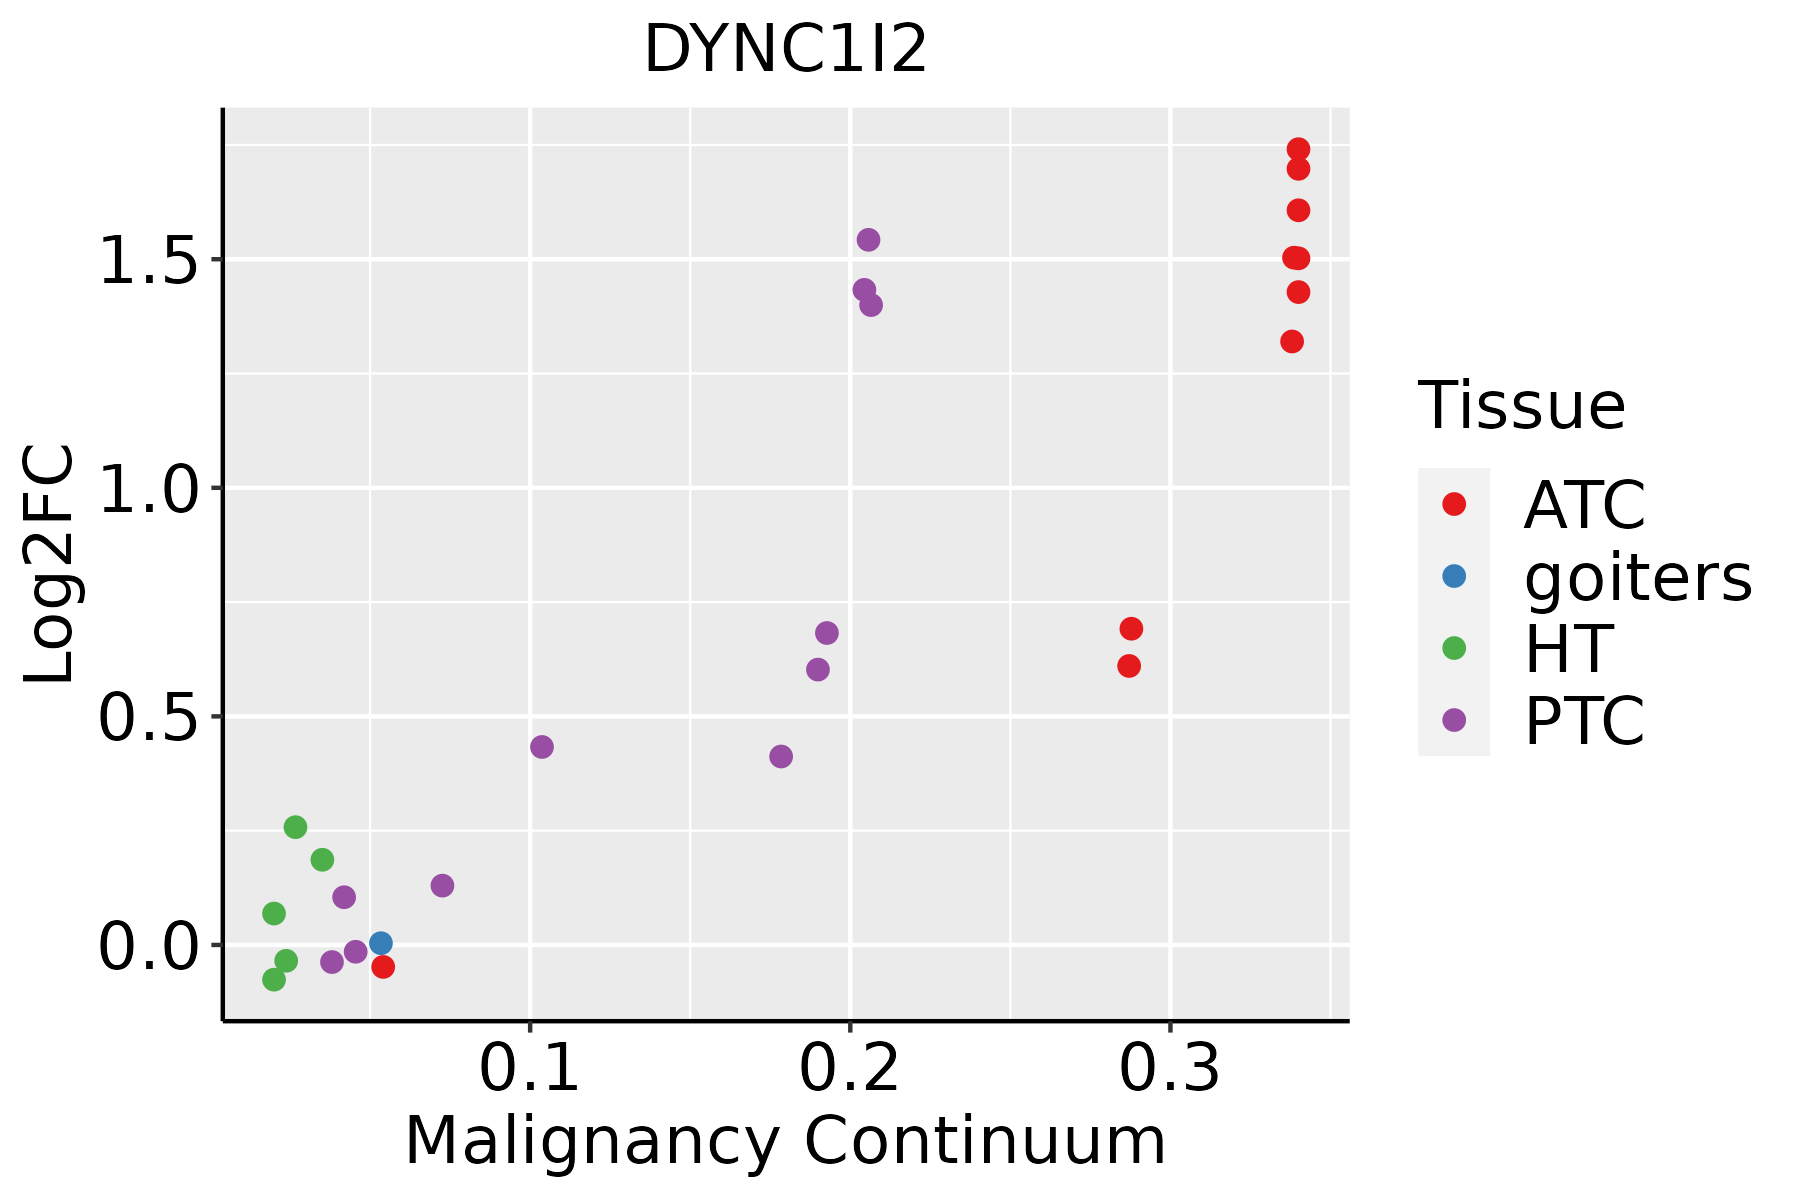 | ATC: Anaplastic thyroid cancer |
| HT: Hashimoto's thyroiditis | ||
| PTC: Papillary thyroid cancer |
| ∗log2FC in expression of this searched gene in stem-like cells from each diseased tissue sample relative to stem-like cells in normal samples in each tissue plotted against the malignancy continuum. Samples are colored based on if they are from different disease stage. |
Top |
Malignant transformation related pathway analysis |
| Find out the enriched GO biological processes and KEGG pathways involved in transition from healthy to precancer to cancer |
| Tissue | Disease Stage | Enriched GO biological Processes |
| Colorectum | AD |  |
| Colorectum | SER |  |
| Colorectum | MSS |  |
| Colorectum | MSI-H |  |
| Colorectum | FAP |  |
| ∗Top 15 enriched GO BP terms are showed in the bar plot of each disease state in each tissue. Each row represents a significant GO biological process which is colored according to the -log10(p.adjust). |
| Page: 1 2 3 4 5 6 7 8 9 |
| GO ID | Tissue | Disease Stage | Description | Gene Ratio | Bg Ratio | pvalue | p.adjust | Count |
| GO:003070517 | Esophagus | HGIN | cytoskeleton-dependent intracellular transport | 45/2587 | 195/18723 | 3.07e-04 | 5.15e-03 | 45 |
| GO:00109707 | Esophagus | HGIN | transport along microtubule | 35/2587 | 155/18723 | 2.01e-03 | 2.12e-02 | 35 |
| GO:003070518 | Esophagus | ESCC | cytoskeleton-dependent intracellular transport | 133/8552 | 195/18723 | 1.48e-10 | 4.27e-09 | 133 |
| GO:001097013 | Esophagus | ESCC | transport along microtubule | 107/8552 | 155/18723 | 3.17e-09 | 6.80e-08 | 107 |
| GO:00991114 | Esophagus | ESCC | microtubule-based transport | 115/8552 | 190/18723 | 2.54e-05 | 2.15e-04 | 115 |
| GO:003070511 | Liver | Cirrhotic | cytoskeleton-dependent intracellular transport | 68/4634 | 195/18723 | 9.54e-04 | 6.77e-03 | 68 |
| GO:00109701 | Liver | Cirrhotic | transport along microtubule | 52/4634 | 155/18723 | 8.42e-03 | 3.91e-02 | 52 |
| GO:003070521 | Liver | HCC | cytoskeleton-dependent intracellular transport | 111/7958 | 195/18723 | 3.25e-05 | 3.28e-04 | 111 |
| GO:00109702 | Liver | HCC | transport along microtubule | 90/7958 | 155/18723 | 6.49e-05 | 5.92e-04 | 90 |
| GO:003070510 | Oral cavity | OSCC | cytoskeleton-dependent intracellular transport | 113/7305 | 195/18723 | 6.03e-08 | 1.09e-06 | 113 |
| GO:00109706 | Oral cavity | OSCC | transport along microtubule | 88/7305 | 155/18723 | 5.35e-06 | 6.02e-05 | 88 |
| GO:00991113 | Oral cavity | OSCC | microtubule-based transport | 96/7305 | 190/18723 | 7.92e-04 | 4.27e-03 | 96 |
| GO:003070516 | Oral cavity | LP | cytoskeleton-dependent intracellular transport | 68/4623 | 195/18723 | 8.92e-04 | 7.64e-03 | 68 |
| GO:001097012 | Oral cavity | LP | transport along microtubule | 56/4623 | 155/18723 | 9.49e-04 | 8.04e-03 | 56 |
| GO:003070523 | Oral cavity | EOLP | cytoskeleton-dependent intracellular transport | 42/2218 | 195/18723 | 8.11e-05 | 9.69e-04 | 42 |
| GO:001097021 | Oral cavity | EOLP | transport along microtubule | 32/2218 | 155/18723 | 1.15e-03 | 8.37e-03 | 32 |
| GO:003070531 | Oral cavity | NEOLP | cytoskeleton-dependent intracellular transport | 46/2005 | 195/18723 | 1.81e-07 | 6.18e-06 | 46 |
| GO:001097031 | Oral cavity | NEOLP | transport along microtubule | 33/2005 | 155/18723 | 8.53e-05 | 1.06e-03 | 33 |
| GO:009911111 | Oral cavity | NEOLP | microtubule-based transport | 34/2005 | 190/18723 | 1.87e-03 | 1.28e-02 | 34 |
| GO:00307059 | Prostate | BPH | cytoskeleton-dependent intracellular transport | 68/3107 | 195/18723 | 3.78e-10 | 1.98e-08 | 68 |
| Page: 1 2 |
| Pathway ID | Tissue | Disease Stage | Description | Gene Ratio | Bg Ratio | pvalue | p.adjust | qvalue | Count |
| hsa0513239 | Esophagus | HGIN | Salmonella infection | 69/1383 | 249/8465 | 3.02e-06 | 4.47e-05 | 3.55e-05 | 69 |
| hsa049627 | Esophagus | HGIN | Vasopressin-regulated water reabsorption | 14/1383 | 44/8465 | 8.21e-03 | 4.71e-02 | 3.74e-02 | 14 |
| hsa05132115 | Esophagus | HGIN | Salmonella infection | 69/1383 | 249/8465 | 3.02e-06 | 4.47e-05 | 3.55e-05 | 69 |
| hsa0496214 | Esophagus | HGIN | Vasopressin-regulated water reabsorption | 14/1383 | 44/8465 | 8.21e-03 | 4.71e-02 | 3.74e-02 | 14 |
| hsa05132211 | Esophagus | ESCC | Salmonella infection | 191/4205 | 249/8465 | 6.51e-19 | 5.45e-17 | 2.79e-17 | 191 |
| hsa0414530 | Esophagus | ESCC | Phagosome | 100/4205 | 152/8465 | 3.81e-05 | 1.72e-04 | 8.82e-05 | 100 |
| hsa0496223 | Esophagus | ESCC | Vasopressin-regulated water reabsorption | 33/4205 | 44/8465 | 5.27e-04 | 1.78e-03 | 9.13e-04 | 33 |
| hsa05132310 | Esophagus | ESCC | Salmonella infection | 191/4205 | 249/8465 | 6.51e-19 | 5.45e-17 | 2.79e-17 | 191 |
| hsa04145114 | Esophagus | ESCC | Phagosome | 100/4205 | 152/8465 | 3.81e-05 | 1.72e-04 | 8.82e-05 | 100 |
| hsa0496233 | Esophagus | ESCC | Vasopressin-regulated water reabsorption | 33/4205 | 44/8465 | 5.27e-04 | 1.78e-03 | 9.13e-04 | 33 |
| hsa0513222 | Liver | Cirrhotic | Salmonella infection | 121/2530 | 249/8465 | 2.47e-10 | 5.13e-09 | 3.16e-09 | 121 |
| hsa0414514 | Liver | Cirrhotic | Phagosome | 73/2530 | 152/8465 | 1.61e-06 | 1.78e-05 | 1.10e-05 | 73 |
| hsa0513232 | Liver | Cirrhotic | Salmonella infection | 121/2530 | 249/8465 | 2.47e-10 | 5.13e-09 | 3.16e-09 | 121 |
| hsa0414515 | Liver | Cirrhotic | Phagosome | 73/2530 | 152/8465 | 1.61e-06 | 1.78e-05 | 1.10e-05 | 73 |
| hsa0513242 | Liver | HCC | Salmonella infection | 178/4020 | 249/8465 | 5.90e-15 | 1.98e-13 | 1.10e-13 | 178 |
| hsa0414521 | Liver | HCC | Phagosome | 93/4020 | 152/8465 | 4.27e-04 | 1.88e-03 | 1.05e-03 | 93 |
| hsa049624 | Liver | HCC | Vasopressin-regulated water reabsorption | 30/4020 | 44/8465 | 4.41e-03 | 1.32e-02 | 7.34e-03 | 30 |
| hsa0513252 | Liver | HCC | Salmonella infection | 178/4020 | 249/8465 | 5.90e-15 | 1.98e-13 | 1.10e-13 | 178 |
| hsa0414531 | Liver | HCC | Phagosome | 93/4020 | 152/8465 | 4.27e-04 | 1.88e-03 | 1.05e-03 | 93 |
| hsa0496211 | Liver | HCC | Vasopressin-regulated water reabsorption | 30/4020 | 44/8465 | 4.41e-03 | 1.32e-02 | 7.34e-03 | 30 |
| Page: 1 2 3 |
Top |
Cell-cell communication analysis |
| Identification of potential cell-cell interactions between two cell types and their ligand-receptor pairs for different disease states |
| Ligand | Receptor | LRpair | Pathway | Tissue | Disease Stage |
| Page: 1 |
Top |
Single-cell gene regulatory network inference analysis |
| Find out the significant the regulons (TFs) and the target genes of each regulon across cell types for different disease states |
| TF | Cell Type | Tissue | Disease Stage | Target Gene | RSS | Regulon Activity |
| ∗The dot plots of a searched regulon are shown for all cell subpopulations in each disease state of each tissue based on the regulon specific score inferred using pySCENIC and by calculating the average expression. |
| Page: 1 |
Top |
Somatic mutation of malignant transformation related genes |
| Annotation of somatic variants for genes involved in malignant transformation |
| Hugo Symbol | Variant Class | Variant Classification | dbSNP RS | HGVSc | HGVSp | HGVSp Short | SWISSPROT | BIOTYPE | SIFT | PolyPhen | Tumor Sample Barcode | Tissue | Histology | Sex | Age | Stage | Therapy Types | Drugs | Outcome |
| DYNC1I2 | SNV | Missense_Mutation | c.235G>A | p.Glu79Lys | p.E79K | Q13409 | protein_coding | tolerated(0.82) | benign(0.005) | TCGA-AR-A0TZ-01 | Breast | breast invasive carcinoma | Female | <65 | III/IV | Unspecific | Doxorubicin | PD | |
| DYNC1I2 | SNV | Missense_Mutation | c.820G>A | p.Glu274Lys | p.E274K | Q13409 | protein_coding | deleterious(0) | possibly_damaging(0.788) | TCGA-E9-A22D-01 | Breast | breast invasive carcinoma | Female | <65 | I/II | Chemotherapy | 5-fluorouracil | SD | |
| DYNC1I2 | SNV | Missense_Mutation | novel | c.1426N>G | p.Gln476Glu | p.Q476E | Q13409 | protein_coding | tolerated(0.1) | benign(0.411) | TCGA-C5-A2LZ-01 | Cervix | cervical & endocervical cancer | Female | >=65 | III/IV | Unknown | Unknown | PD |
| DYNC1I2 | SNV | Missense_Mutation | novel | c.65G>C | p.Arg22Thr | p.R22T | Q13409 | protein_coding | deleterious(0) | benign(0.083) | TCGA-C5-A3HE-01 | Cervix | cervical & endocervical cancer | Female | <65 | I/II | Unknown | Unknown | PD |
| DYNC1I2 | SNV | Missense_Mutation | rs201120526 | c.1874N>A | p.Arg625Gln | p.R625Q | Q13409 | protein_coding | tolerated(1) | probably_damaging(0.945) | TCGA-DS-A7WH-01 | Cervix | cervical & endocervical cancer | Female | <65 | I/II | Chemotherapy | cisplatin | CR |
| DYNC1I2 | SNV | Missense_Mutation | c.1327N>A | p.Asp443Asn | p.D443N | Q13409 | protein_coding | tolerated(0.08) | probably_damaging(0.999) | TCGA-IR-A3LK-01 | Cervix | cervical & endocervical cancer | Female | >=65 | I/II | Chemotherapy | cisplatin | PD | |
| DYNC1I2 | SNV | Missense_Mutation | c.1087C>T | p.Arg363Cys | p.R363C | Q13409 | protein_coding | deleterious(0) | probably_damaging(0.999) | TCGA-AA-3710-01 | Colorectum | colon adenocarcinoma | Female | >=65 | I/II | Unknown | Unknown | SD | |
| DYNC1I2 | SNV | Missense_Mutation | c.1871A>G | p.Asn624Ser | p.N624S | Q13409 | protein_coding | deleterious(0.02) | benign(0.001) | TCGA-AA-3815-01 | Colorectum | colon adenocarcinoma | Female | >=65 | I/II | Unknown | Unknown | SD | |
| DYNC1I2 | SNV | Missense_Mutation | novel | c.734T>G | p.Phe245Cys | p.F245C | Q13409 | protein_coding | tolerated(0.07) | probably_damaging(0.928) | TCGA-AA-3949-01 | Colorectum | colon adenocarcinoma | Female | >=65 | III/IV | Unknown | Unknown | SD |
| DYNC1I2 | SNV | Missense_Mutation | novel | c.1351N>G | p.Ser451Gly | p.S451G | Q13409 | protein_coding | deleterious(0.04) | probably_damaging(0.995) | TCGA-AD-6889-01 | Colorectum | colon adenocarcinoma | Male | >=65 | I/II | Chemotherapy | xeloda | PD |
| Page: 1 2 3 4 5 6 |
Top |
Related drugs of malignant transformation related genes |
| Identification of chemicals and drugs interact with genes involved in malignant transfromation |
| (DGIdb 4.0) |
| Entrez ID | Symbol | Category | Interaction Types | Drug Claim Name | Drug Name | PMIDs |
| Page: 1 |

Copyright 2023-Present -The University of Texas Health Science Center at Houston |