
|
|||||
|
 | |
| |
| |
| |
| |
| |
|
Gene: DYM |
Gene summary for DYM |
| Gene information | Species | Human | Gene symbol | DYM | Gene ID | 54808 |
| Gene name | dymeclin | |
| Gene Alias | DMC | |
| Cytomap | 18q21.1 | |
| Gene Type | protein-coding | GO ID | GO:0001501 | UniProtAcc | Q7RTS9 |
Top |
Malignant transformation analysis |
| Identification of the aberrant gene expression in precancerous and cancerous lesions by comparing the gene expression of stem-like cells in diseased tissues with normal stem cells |
| Entrez ID | Symbol | Replicates | Species | Organ | Tissue | Adj P-value | Log2FC | Malignancy |
| 54808 | DYM | CCI_1 | Human | Cervix | CC | 1.03e-06 | 7.41e-01 | 0.528 |
| 54808 | DYM | CCI_2 | Human | Cervix | CC | 1.04e-03 | 4.98e-01 | 0.5249 |
| 54808 | DYM | CCI_3 | Human | Cervix | CC | 1.23e-08 | 7.15e-01 | 0.516 |
| 54808 | DYM | HTA11_3410_2000001011 | Human | Colorectum | AD | 1.69e-17 | -6.36e-01 | 0.0155 |
| 54808 | DYM | HTA11_2487_2000001011 | Human | Colorectum | SER | 2.56e-05 | -3.84e-01 | -0.1808 |
| 54808 | DYM | HTA11_2951_2000001011 | Human | Colorectum | AD | 2.49e-02 | -6.02e-01 | 0.0216 |
| 54808 | DYM | HTA11_3361_2000001011 | Human | Colorectum | AD | 1.09e-02 | -5.10e-01 | -0.1207 |
| 54808 | DYM | HTA11_5212_2000001011 | Human | Colorectum | AD | 1.06e-03 | -4.60e-01 | -0.2061 |
| 54808 | DYM | HTA11_546_2000001011 | Human | Colorectum | AD | 1.03e-02 | -4.20e-01 | -0.0842 |
| 54808 | DYM | HTA11_866_3004761011 | Human | Colorectum | AD | 4.75e-09 | -5.23e-01 | 0.096 |
| 54808 | DYM | HTA11_4255_2000001011 | Human | Colorectum | SER | 8.47e-03 | -4.24e-01 | 0.0446 |
| 54808 | DYM | HTA11_6801_2000001011 | Human | Colorectum | SER | 4.24e-03 | -4.69e-01 | 0.0171 |
| 54808 | DYM | HTA11_10711_2000001011 | Human | Colorectum | AD | 1.65e-02 | -4.31e-01 | 0.0338 |
| 54808 | DYM | HTA11_7696_3000711011 | Human | Colorectum | AD | 9.37e-06 | -4.12e-01 | 0.0674 |
| 54808 | DYM | HTA11_6818_2000001011 | Human | Colorectum | AD | 6.65e-04 | -4.04e-01 | 0.0112 |
| 54808 | DYM | HTA11_6818_2000001021 | Human | Colorectum | AD | 6.36e-04 | -4.49e-01 | 0.0588 |
| 54808 | DYM | HTA11_99999970781_79442 | Human | Colorectum | MSS | 4.17e-07 | -3.61e-01 | 0.294 |
| 54808 | DYM | HTA11_99999971662_82457 | Human | Colorectum | MSS | 1.27e-06 | -4.27e-01 | 0.3859 |
| 54808 | DYM | HTA11_99999973899_84307 | Human | Colorectum | MSS | 8.92e-06 | -6.43e-01 | 0.2585 |
| 54808 | DYM | HTA11_99999974143_84620 | Human | Colorectum | MSS | 2.32e-16 | -5.63e-01 | 0.3005 |
| Page: 1 2 3 4 5 6 7 8 9 |
| Tissue | Expression Dynamics | Abbreviation |
| Cervix | 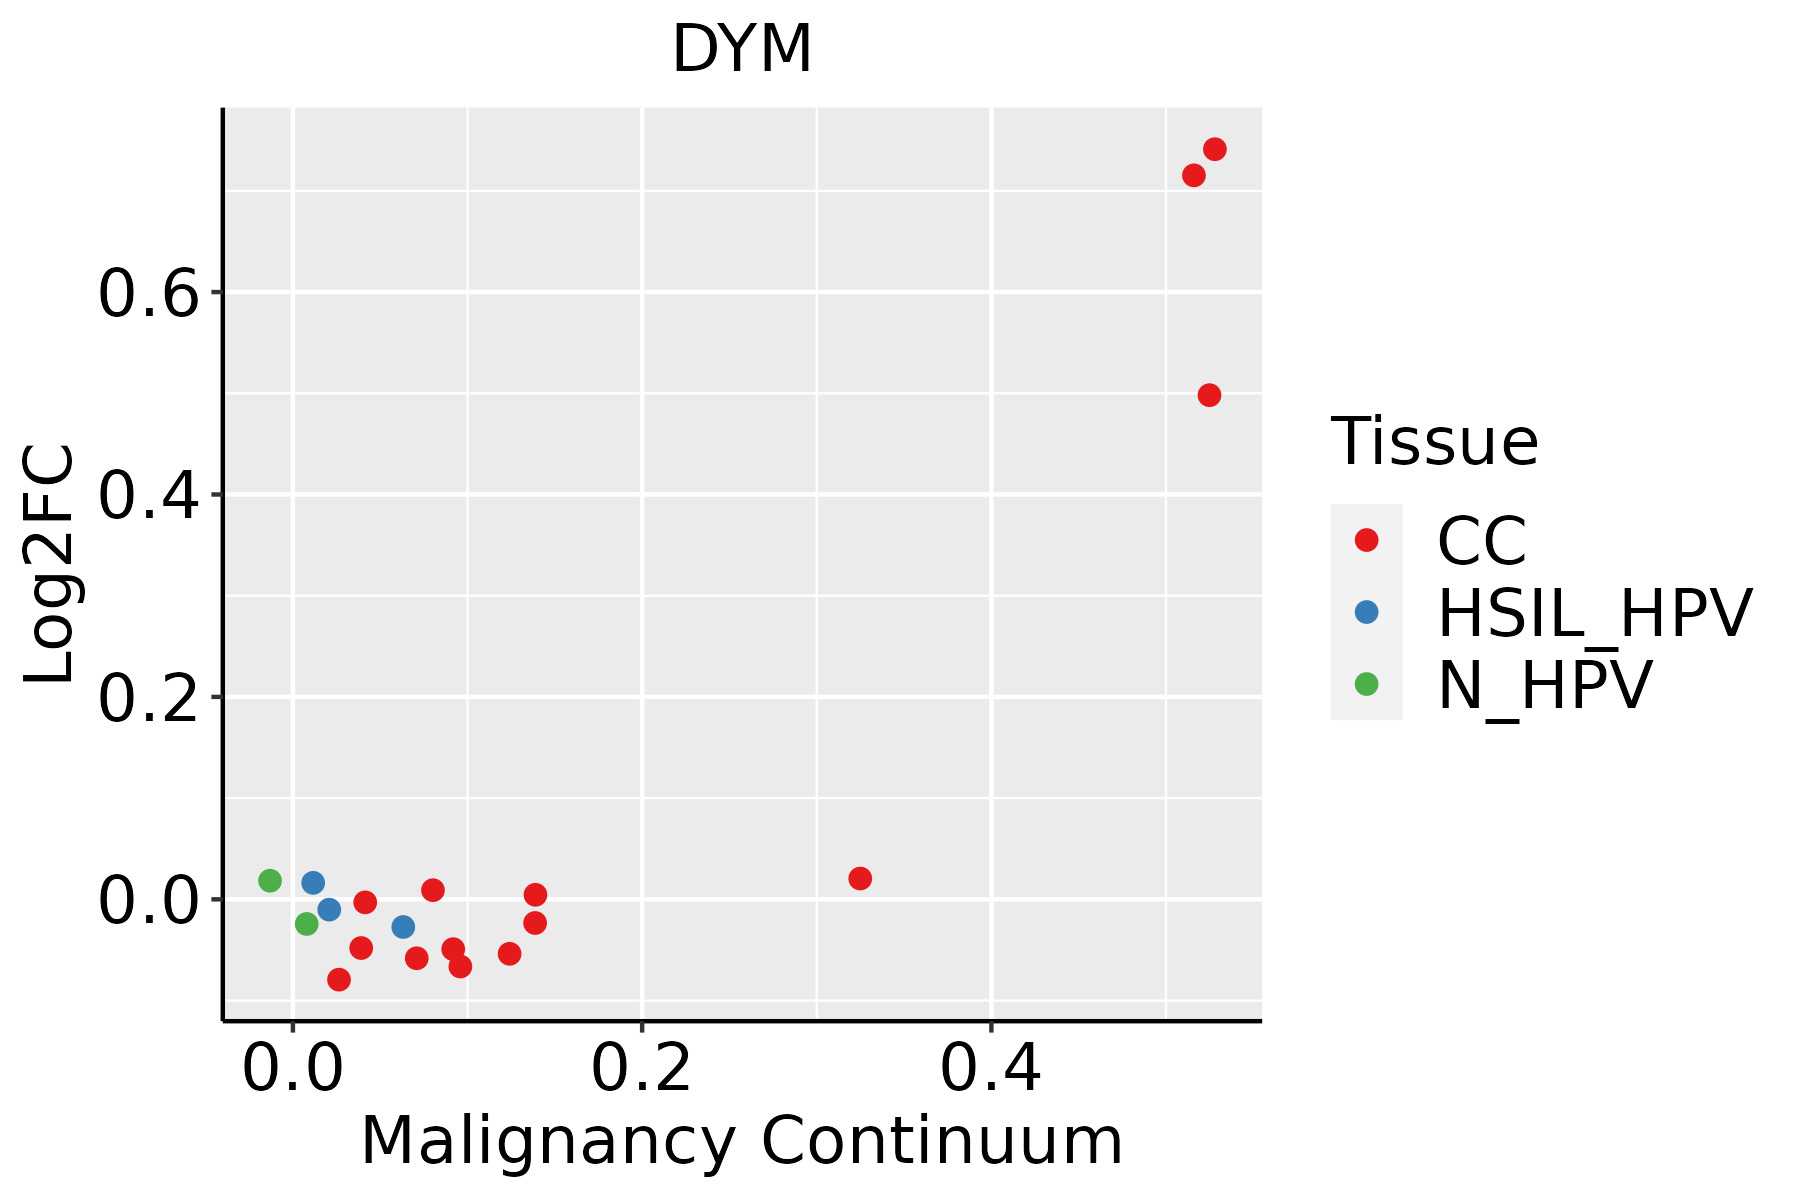 | CC: Cervix cancer |
| HSIL_HPV: HPV-infected high-grade squamous intraepithelial lesions | ||
| N_HPV: HPV-infected normal cervix | ||
| Colorectum (GSE201348) |  | FAP: Familial adenomatous polyposis |
| CRC: Colorectal cancer | ||
| Colorectum (HTA11) | 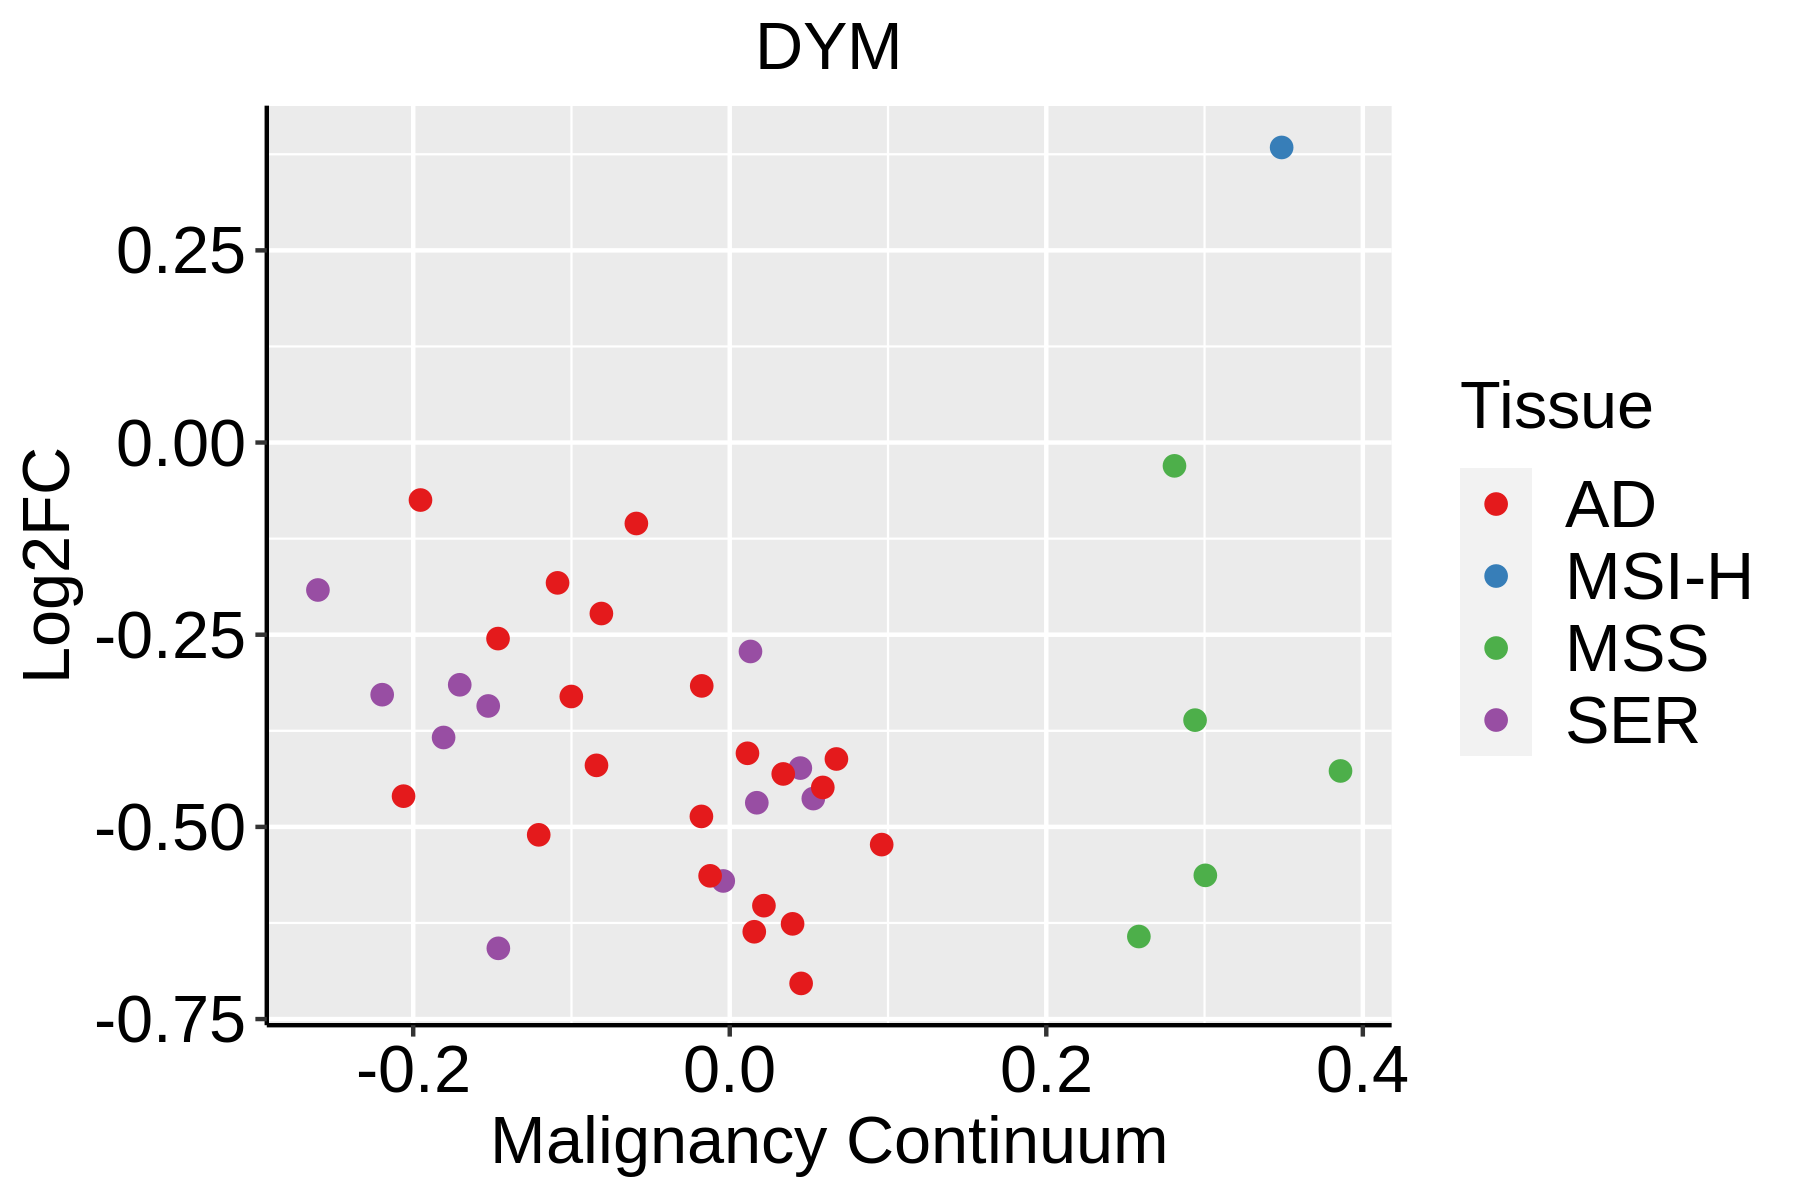 | AD: Adenomas |
| SER: Sessile serrated lesions | ||
| MSI-H: Microsatellite-high colorectal cancer | ||
| MSS: Microsatellite stable colorectal cancer | ||
| Endometrium | 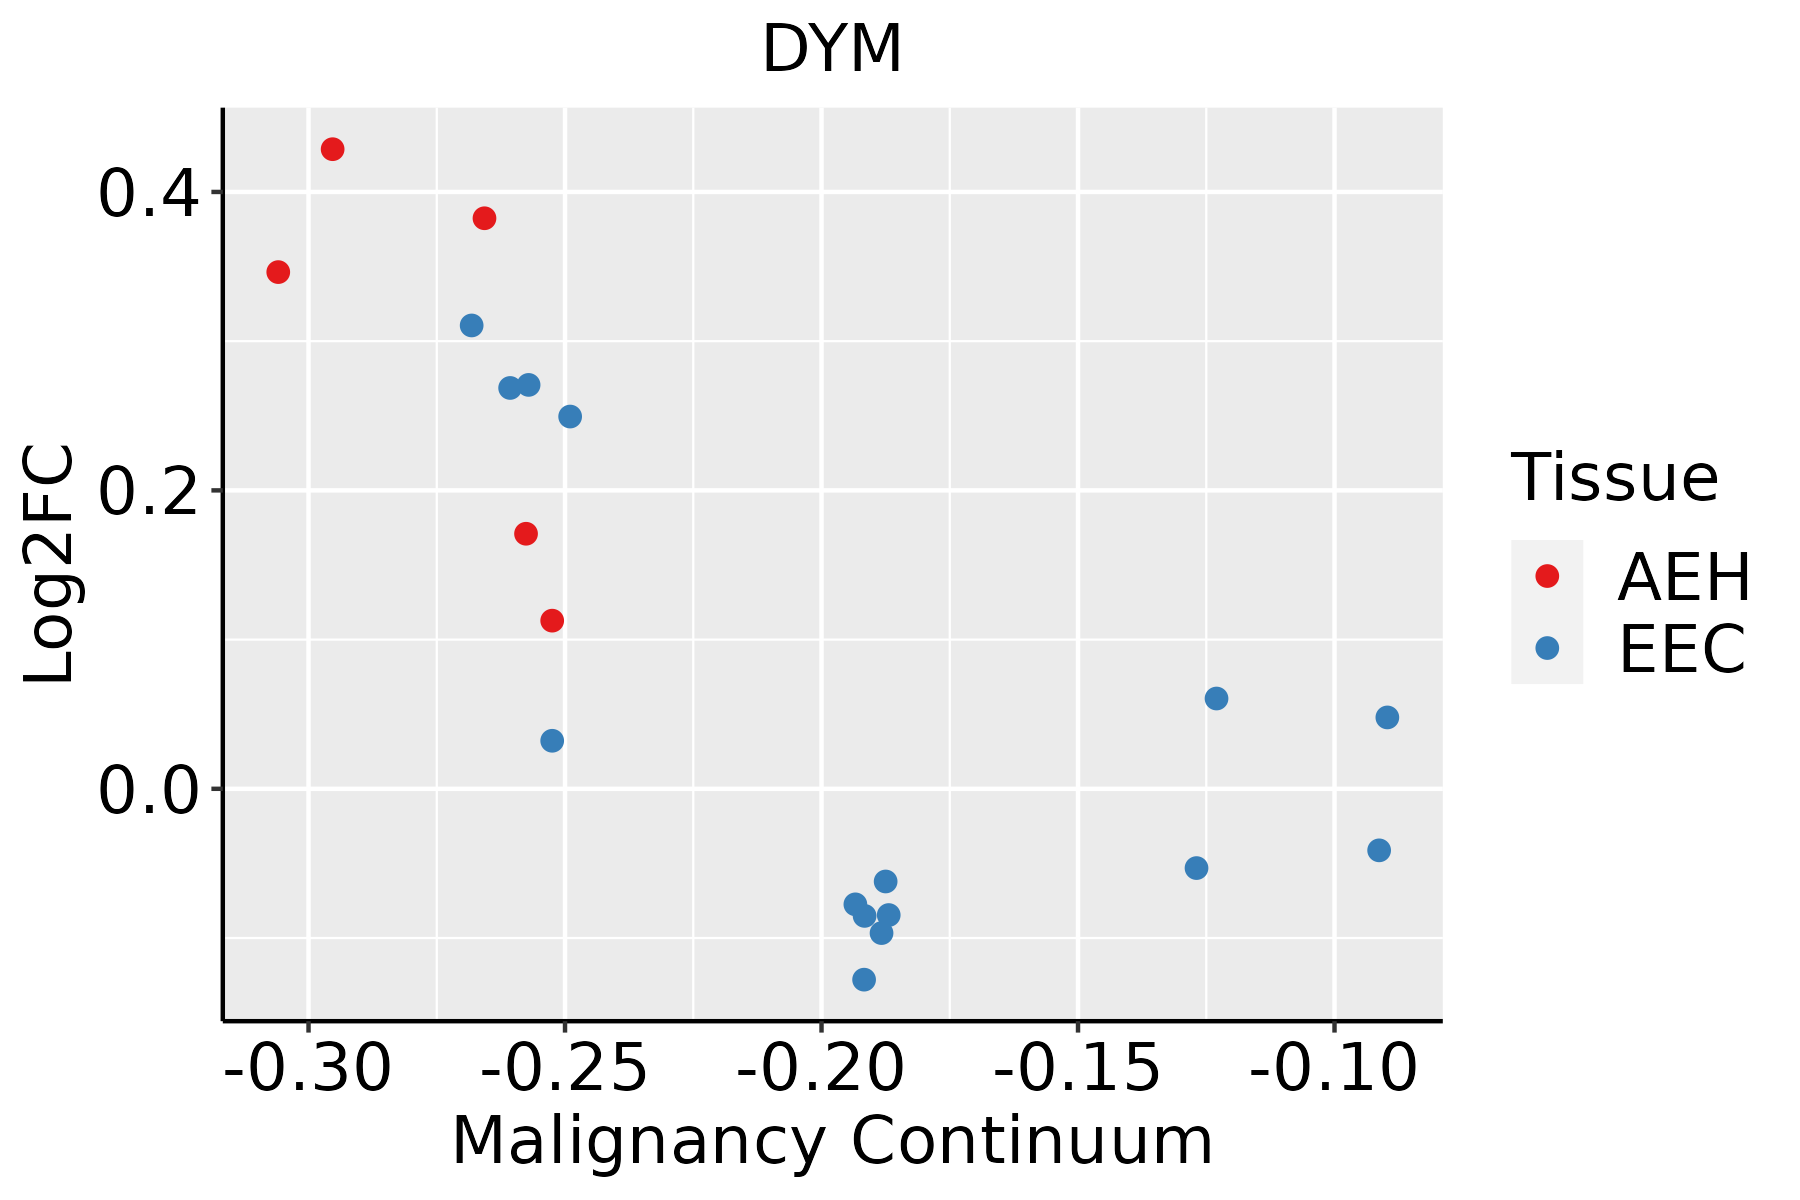 | AEH: Atypical endometrial hyperplasia |
| EEC: Endometrioid Cancer | ||
| Esophagus | 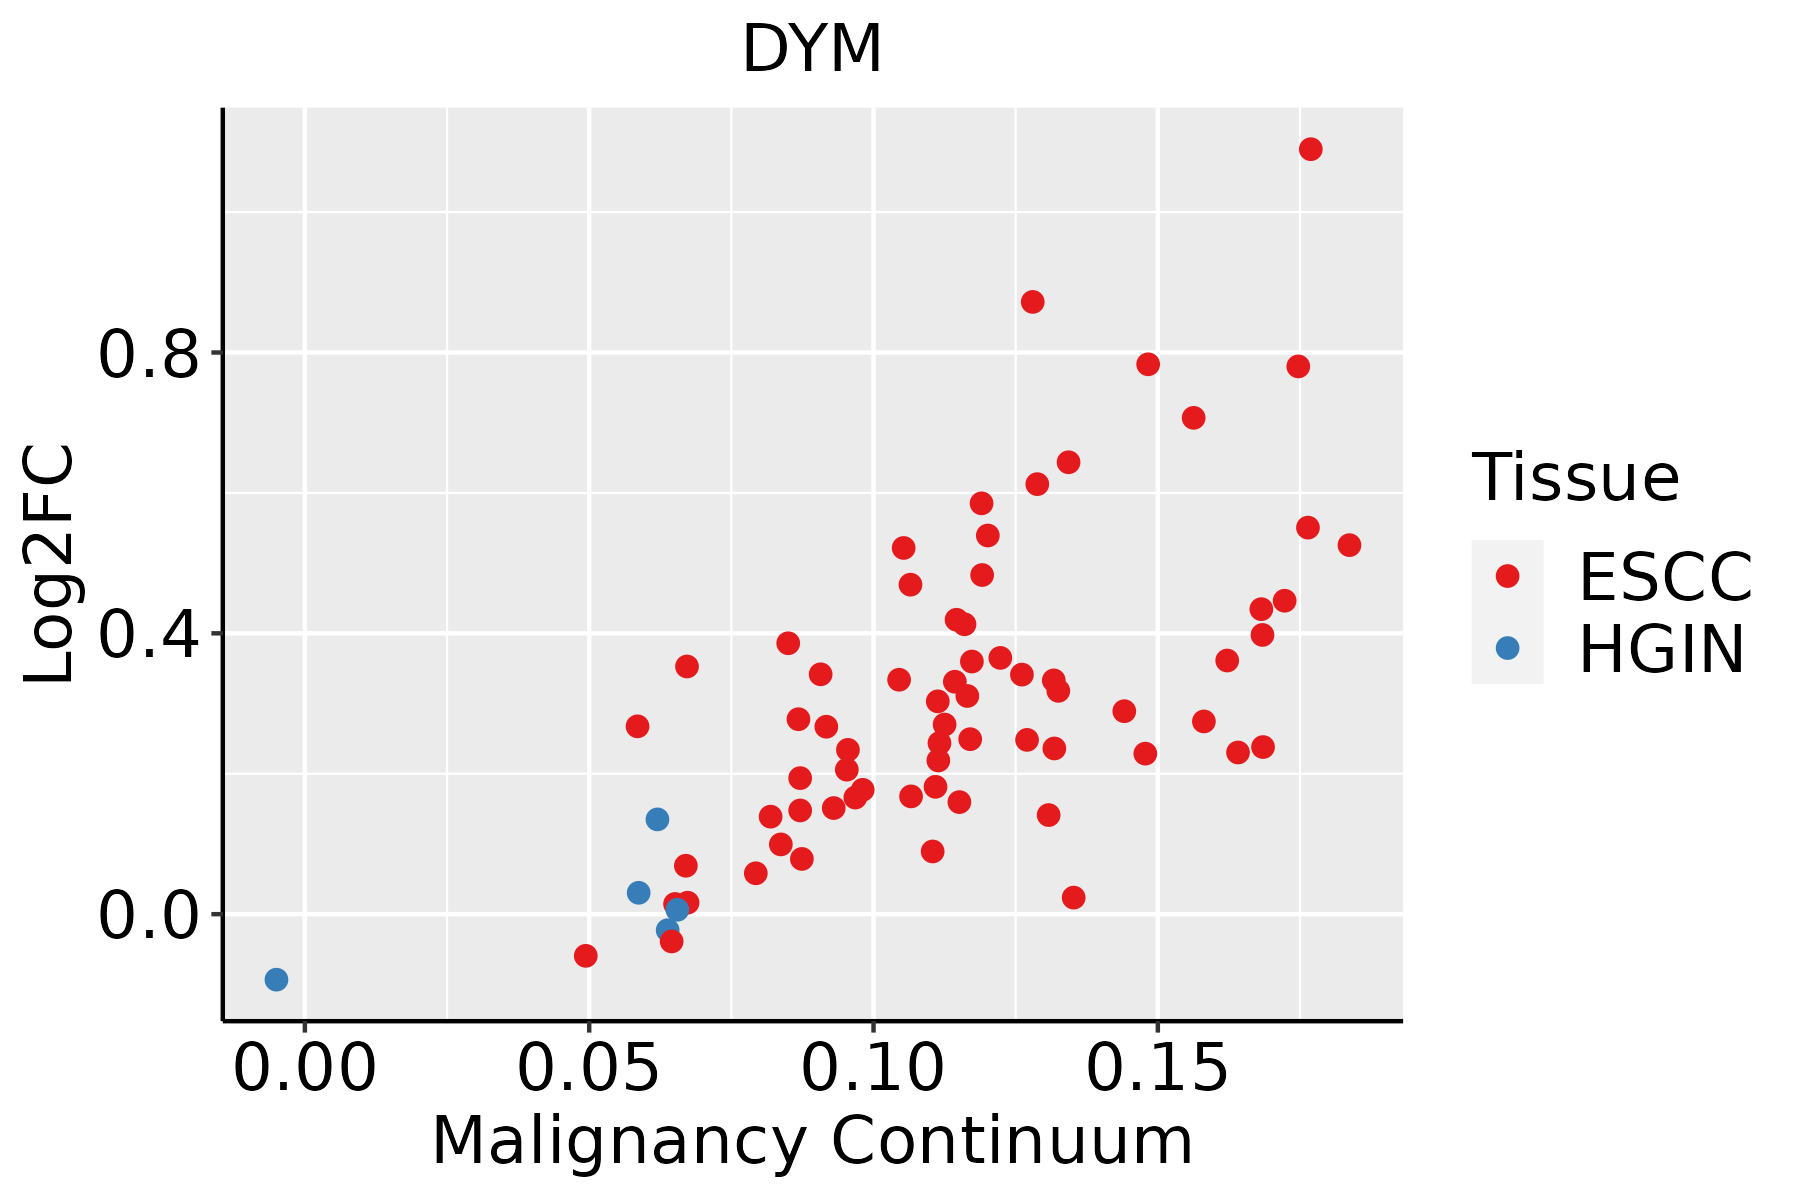 | ESCC: Esophageal squamous cell carcinoma |
| HGIN: High-grade intraepithelial neoplasias | ||
| LGIN: Low-grade intraepithelial neoplasias | ||
| Liver | 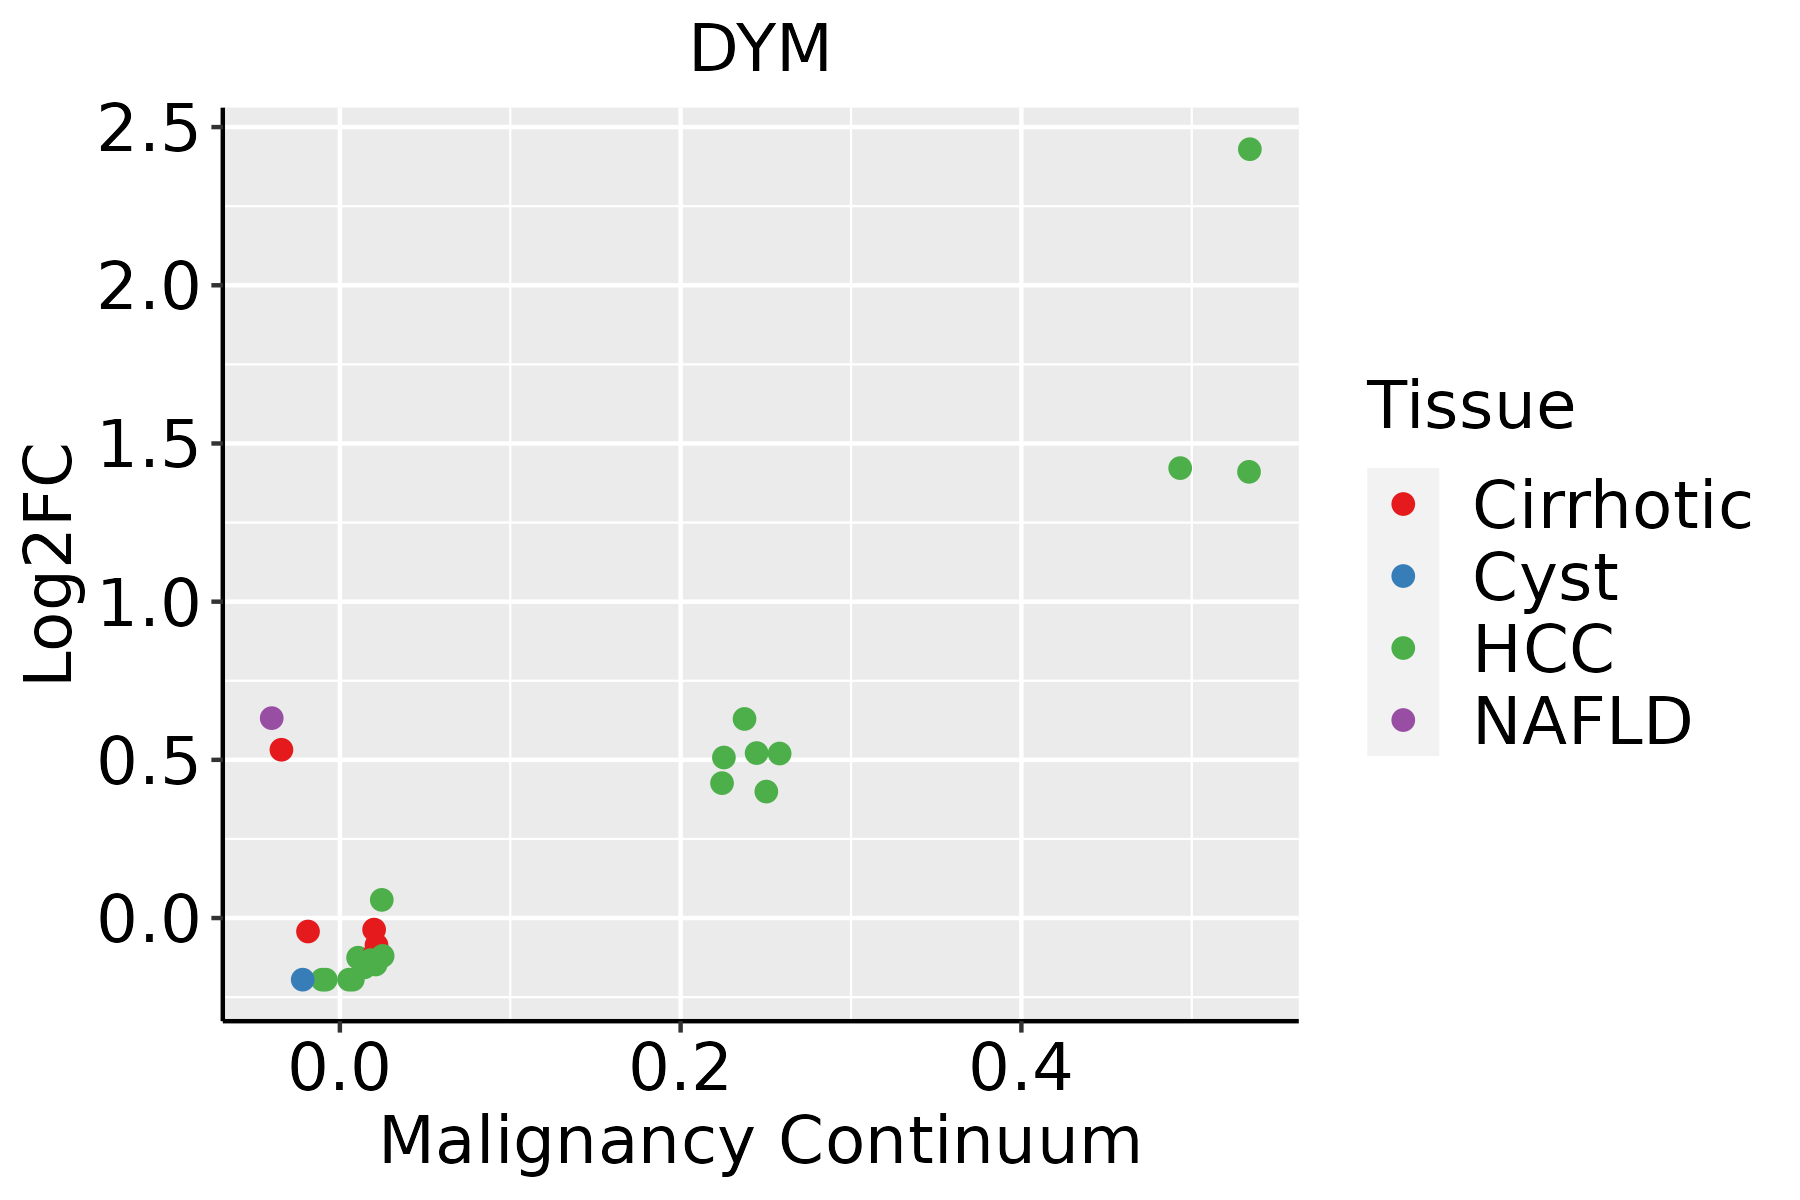 | HCC: Hepatocellular carcinoma |
| NAFLD: Non-alcoholic fatty liver disease | ||
| Lung |  | AAH: Atypical adenomatous hyperplasia |
| AIS: Adenocarcinoma in situ | ||
| IAC: Invasive lung adenocarcinoma | ||
| MIA: Minimally invasive adenocarcinoma | ||
| Oral Cavity |  | EOLP: Erosive Oral lichen planus |
| LP: leukoplakia | ||
| NEOLP: Non-erosive oral lichen planus | ||
| OSCC: Oral squamous cell carcinoma | ||
| Prostate |  | BPH: Benign Prostatic Hyperplasia |
| ∗log2FC in expression of this searched gene in stem-like cells from each diseased tissue sample relative to stem-like cells in normal samples in each tissue plotted against the malignancy continuum. Samples are colored based on if they are from different disease stage. |
Top |
Malignant transformation related pathway analysis |
| Find out the enriched GO biological processes and KEGG pathways involved in transition from healthy to precancer to cancer |
| Tissue | Disease Stage | Enriched GO biological Processes |
| Colorectum | AD |  |
| Colorectum | SER |  |
| Colorectum | MSS |  |
| Colorectum | MSI-H |  |
| Colorectum | FAP |  |
| ∗Top 15 enriched GO BP terms are showed in the bar plot of each disease state in each tissue. Each row represents a significant GO biological process which is colored according to the -log10(p.adjust). |
| Page: 1 2 3 4 5 6 7 8 9 |
| GO ID | Tissue | Disease Stage | Description | Gene Ratio | Bg Ratio | pvalue | p.adjust | Count |
| GO:00070304 | Cervix | CC | Golgi organization | 32/2311 | 157/18723 | 2.78e-03 | 1.87e-02 | 32 |
| GO:0060348 | Colorectum | CRC | bone development | 37/2078 | 205/18723 | 1.96e-03 | 1.96e-02 | 37 |
| GO:00070305 | Endometrium | AEH | Golgi organization | 32/2100 | 157/18723 | 5.73e-04 | 5.69e-03 | 32 |
| GO:000703012 | Endometrium | EEC | Golgi organization | 32/2168 | 157/18723 | 9.87e-04 | 8.76e-03 | 32 |
| GO:00070308 | Esophagus | ESCC | Golgi organization | 101/8552 | 157/18723 | 1.78e-06 | 2.10e-05 | 101 |
| GO:00603485 | Esophagus | ESCC | bone development | 115/8552 | 205/18723 | 1.67e-03 | 7.72e-03 | 115 |
| GO:0007030 | Liver | NAFLD | Golgi organization | 36/1882 | 157/18723 | 1.76e-06 | 7.68e-05 | 36 |
| GO:00603481 | Liver | NAFLD | bone development | 33/1882 | 205/18723 | 4.45e-03 | 3.60e-02 | 33 |
| GO:00070301 | Liver | Cirrhotic | Golgi organization | 68/4634 | 157/18723 | 2.57e-07 | 6.41e-06 | 68 |
| GO:00070302 | Liver | HCC | Golgi organization | 99/7958 | 157/18723 | 1.54e-07 | 2.85e-06 | 99 |
| GO:00070303 | Lung | IAC | Golgi organization | 32/2061 | 157/18723 | 4.13e-04 | 6.22e-03 | 32 |
| GO:000703011 | Lung | AIS | Golgi organization | 30/1849 | 157/18723 | 3.09e-04 | 5.63e-03 | 30 |
| GO:000703021 | Lung | MIAC | Golgi organization | 18/967 | 157/18723 | 1.27e-03 | 2.37e-02 | 18 |
| GO:00070307 | Oral cavity | OSCC | Golgi organization | 92/7305 | 157/18723 | 4.96e-07 | 7.27e-06 | 92 |
| GO:00603484 | Oral cavity | OSCC | bone development | 99/7305 | 205/18723 | 4.13e-03 | 1.68e-02 | 99 |
| GO:000703014 | Oral cavity | EOLP | Golgi organization | 37/2218 | 157/18723 | 2.83e-05 | 4.12e-04 | 37 |
| GO:006034812 | Oral cavity | EOLP | bone development | 37/2218 | 205/18723 | 5.84e-03 | 2.95e-02 | 37 |
| GO:006034821 | Oral cavity | NEOLP | bone development | 38/2005 | 205/18723 | 5.28e-04 | 4.64e-03 | 38 |
| GO:000703022 | Oral cavity | NEOLP | Golgi organization | 29/2005 | 157/18723 | 2.40e-03 | 1.53e-02 | 29 |
| GO:00603483 | Prostate | BPH | bone development | 50/3107 | 205/18723 | 2.60e-03 | 1.39e-02 | 50 |
| Page: 1 2 |
| Pathway ID | Tissue | Disease Stage | Description | Gene Ratio | Bg Ratio | pvalue | p.adjust | qvalue | Count |
| Page: 1 |
Top |
Cell-cell communication analysis |
| Identification of potential cell-cell interactions between two cell types and their ligand-receptor pairs for different disease states |
| Ligand | Receptor | LRpair | Pathway | Tissue | Disease Stage |
| Page: 1 |
Top |
Single-cell gene regulatory network inference analysis |
| Find out the significant the regulons (TFs) and the target genes of each regulon across cell types for different disease states |
| TF | Cell Type | Tissue | Disease Stage | Target Gene | RSS | Regulon Activity |
| ∗The dot plots of a searched regulon are shown for all cell subpopulations in each disease state of each tissue based on the regulon specific score inferred using pySCENIC and by calculating the average expression. |
| Page: 1 |
Top |
Somatic mutation of malignant transformation related genes |
| Annotation of somatic variants for genes involved in malignant transformation |
| Hugo Symbol | Variant Class | Variant Classification | dbSNP RS | HGVSc | HGVSp | HGVSp Short | SWISSPROT | BIOTYPE | SIFT | PolyPhen | Tumor Sample Barcode | Tissue | Histology | Sex | Age | Stage | Therapy Types | Drugs | Outcome |
| DYM | SNV | Missense_Mutation | novel | c.853N>A | p.Leu285Ile | p.L285I | Q7RTS9 | protein_coding | deleterious(0.05) | possibly_damaging(0.883) | TCGA-AN-A046-01 | Breast | breast invasive carcinoma | Female | >=65 | I/II | Unknown | Unknown | SD |
| DYM | SNV | Missense_Mutation | novel | c.1209N>G | p.Ile403Met | p.I403M | Q7RTS9 | protein_coding | tolerated(0.05) | probably_damaging(1) | TCGA-C8-A8HP-01 | Breast | breast invasive carcinoma | Female | <65 | III/IV | Chemotherapy | 5-fluorouracil | CR |
| DYM | insertion | Frame_Shift_Ins | novel | c.1483_1484insGCATGCACTGTGTGATACCCTGCATCATCTTGGGATGCCACAG | p.Lys495SerfsTer34 | p.K495Sfs*34 | Q7RTS9 | protein_coding | TCGA-A2-A0D1-01 | Breast | breast invasive carcinoma | Female | >=65 | I/II | Chemotherapy | taxotere | SD | ||
| DYM | insertion | Nonsense_Mutation | novel | c.1662_1663insGGGGCAGATGGTTACAGGGTATGCATATTTGTCAAAACTGGTTGAAC | p.Tyr555GlyfsTer15 | p.Y555Gfs*15 | Q7RTS9 | protein_coding | TCGA-A7-A0CG-01 | Breast | breast invasive carcinoma | Female | >=65 | I/II | Unknown | Unknown | SD | ||
| DYM | insertion | Nonsense_Mutation | novel | c.1597_1598insAGCGAGAACTTAAACCCAGAGTTTGATGATAAGGCCTTTGTTT | p.Arg533GlnfsTer9 | p.R533Qfs*9 | Q7RTS9 | protein_coding | TCGA-BH-A0BD-01 | Breast | breast invasive carcinoma | Female | <65 | I/II | Chemotherapy | doxorubicin | SD | ||
| DYM | SNV | Missense_Mutation | c.496N>C | p.Asp166His | p.D166H | Q7RTS9 | protein_coding | deleterious(0.01) | possibly_damaging(0.905) | TCGA-BI-A0VR-01 | Cervix | cervical & endocervical cancer | Female | <65 | III/IV | Unknown | Unknown | SD | |
| DYM | SNV | Missense_Mutation | c.1894G>C | p.Glu632Gln | p.E632Q | Q7RTS9 | protein_coding | deleterious(0) | probably_damaging(0.995) | TCGA-C5-A1MJ-01 | Cervix | cervical & endocervical cancer | Female | <65 | I/II | Unknown | Unknown | SD | |
| DYM | SNV | Missense_Mutation | c.1390T>G | p.Leu464Val | p.L464V | Q7RTS9 | protein_coding | deleterious(0) | probably_damaging(0.998) | TCGA-C5-A7CL-01 | Cervix | cervical & endocervical cancer | Female | <65 | III/IV | Chemotherapy | cisplatin | PD | |
| DYM | SNV | Missense_Mutation | c.1034N>T | p.Ser345Phe | p.S345F | Q7RTS9 | protein_coding | tolerated(0.41) | possibly_damaging(0.897) | TCGA-C5-A7UH-01 | Cervix | cervical & endocervical cancer | Female | <65 | III/IV | Chemotherapy | cisplatin | SD | |
| DYM | SNV | Missense_Mutation | c.1159N>A | p.Glu387Lys | p.E387K | Q7RTS9 | protein_coding | tolerated(0.1) | possibly_damaging(0.802) | TCGA-DG-A2KM-01 | Cervix | cervical & endocervical cancer | Female | <65 | I/II | Chemotherapy | cisplatin | SD |
| Page: 1 2 3 4 5 6 7 |
Top |
Related drugs of malignant transformation related genes |
| Identification of chemicals and drugs interact with genes involved in malignant transfromation |
| (DGIdb 4.0) |
| Entrez ID | Symbol | Category | Interaction Types | Drug Claim Name | Drug Name | PMIDs |
| Page: 1 |

Copyright 2023-Present -The University of Texas Health Science Center at Houston |