
|
|||||
|
 | |
| |
| |
| |
| |
| |
|
Gene: DXO |
Gene summary for DXO |
| Gene information | Species | Human | Gene symbol | DXO | Gene ID | 1797 |
| Gene name | decapping exoribonuclease | |
| Gene Alias | DOM3L | |
| Cytomap | 6p21.33 | |
| Gene Type | protein-coding | GO ID | GO:0000956 | UniProtAcc | A0A024RCW8 |
Top |
Malignant transformation analysis |
| Identification of the aberrant gene expression in precancerous and cancerous lesions by comparing the gene expression of stem-like cells in diseased tissues with normal stem cells |
| Entrez ID | Symbol | Replicates | Species | Organ | Tissue | Adj P-value | Log2FC | Malignancy |
| 1797 | DXO | LZE4T | Human | Esophagus | ESCC | 2.43e-05 | 1.19e-01 | 0.0811 |
| 1797 | DXO | LZE20T | Human | Esophagus | ESCC | 1.17e-03 | 1.54e-01 | 0.0662 |
| 1797 | DXO | LZE24T | Human | Esophagus | ESCC | 7.43e-05 | 2.42e-01 | 0.0596 |
| 1797 | DXO | P2T-E | Human | Esophagus | ESCC | 3.66e-22 | 4.97e-01 | 0.1177 |
| 1797 | DXO | P4T-E | Human | Esophagus | ESCC | 7.97e-15 | 3.26e-01 | 0.1323 |
| 1797 | DXO | P5T-E | Human | Esophagus | ESCC | 1.23e-08 | 2.00e-01 | 0.1327 |
| 1797 | DXO | P8T-E | Human | Esophagus | ESCC | 2.25e-11 | 1.87e-01 | 0.0889 |
| 1797 | DXO | P9T-E | Human | Esophagus | ESCC | 6.89e-11 | 2.29e-01 | 0.1131 |
| 1797 | DXO | P10T-E | Human | Esophagus | ESCC | 2.25e-18 | 3.67e-01 | 0.116 |
| 1797 | DXO | P11T-E | Human | Esophagus | ESCC | 4.45e-08 | 2.92e-01 | 0.1426 |
| 1797 | DXO | P12T-E | Human | Esophagus | ESCC | 1.87e-16 | 2.71e-01 | 0.1122 |
| 1797 | DXO | P15T-E | Human | Esophagus | ESCC | 2.38e-02 | 1.09e-01 | 0.1149 |
| 1797 | DXO | P16T-E | Human | Esophagus | ESCC | 2.92e-18 | 4.13e-01 | 0.1153 |
| 1797 | DXO | P17T-E | Human | Esophagus | ESCC | 3.58e-07 | 3.15e-01 | 0.1278 |
| 1797 | DXO | P20T-E | Human | Esophagus | ESCC | 1.17e-10 | 2.93e-01 | 0.1124 |
| 1797 | DXO | P21T-E | Human | Esophagus | ESCC | 1.70e-20 | 2.47e-01 | 0.1617 |
| 1797 | DXO | P22T-E | Human | Esophagus | ESCC | 6.16e-18 | 3.29e-01 | 0.1236 |
| 1797 | DXO | P23T-E | Human | Esophagus | ESCC | 1.37e-14 | 3.19e-01 | 0.108 |
| 1797 | DXO | P24T-E | Human | Esophagus | ESCC | 4.23e-12 | 1.80e-01 | 0.1287 |
| 1797 | DXO | P26T-E | Human | Esophagus | ESCC | 1.37e-14 | 1.94e-01 | 0.1276 |
| Page: 1 2 3 4 |
| Tissue | Expression Dynamics | Abbreviation |
| Esophagus | 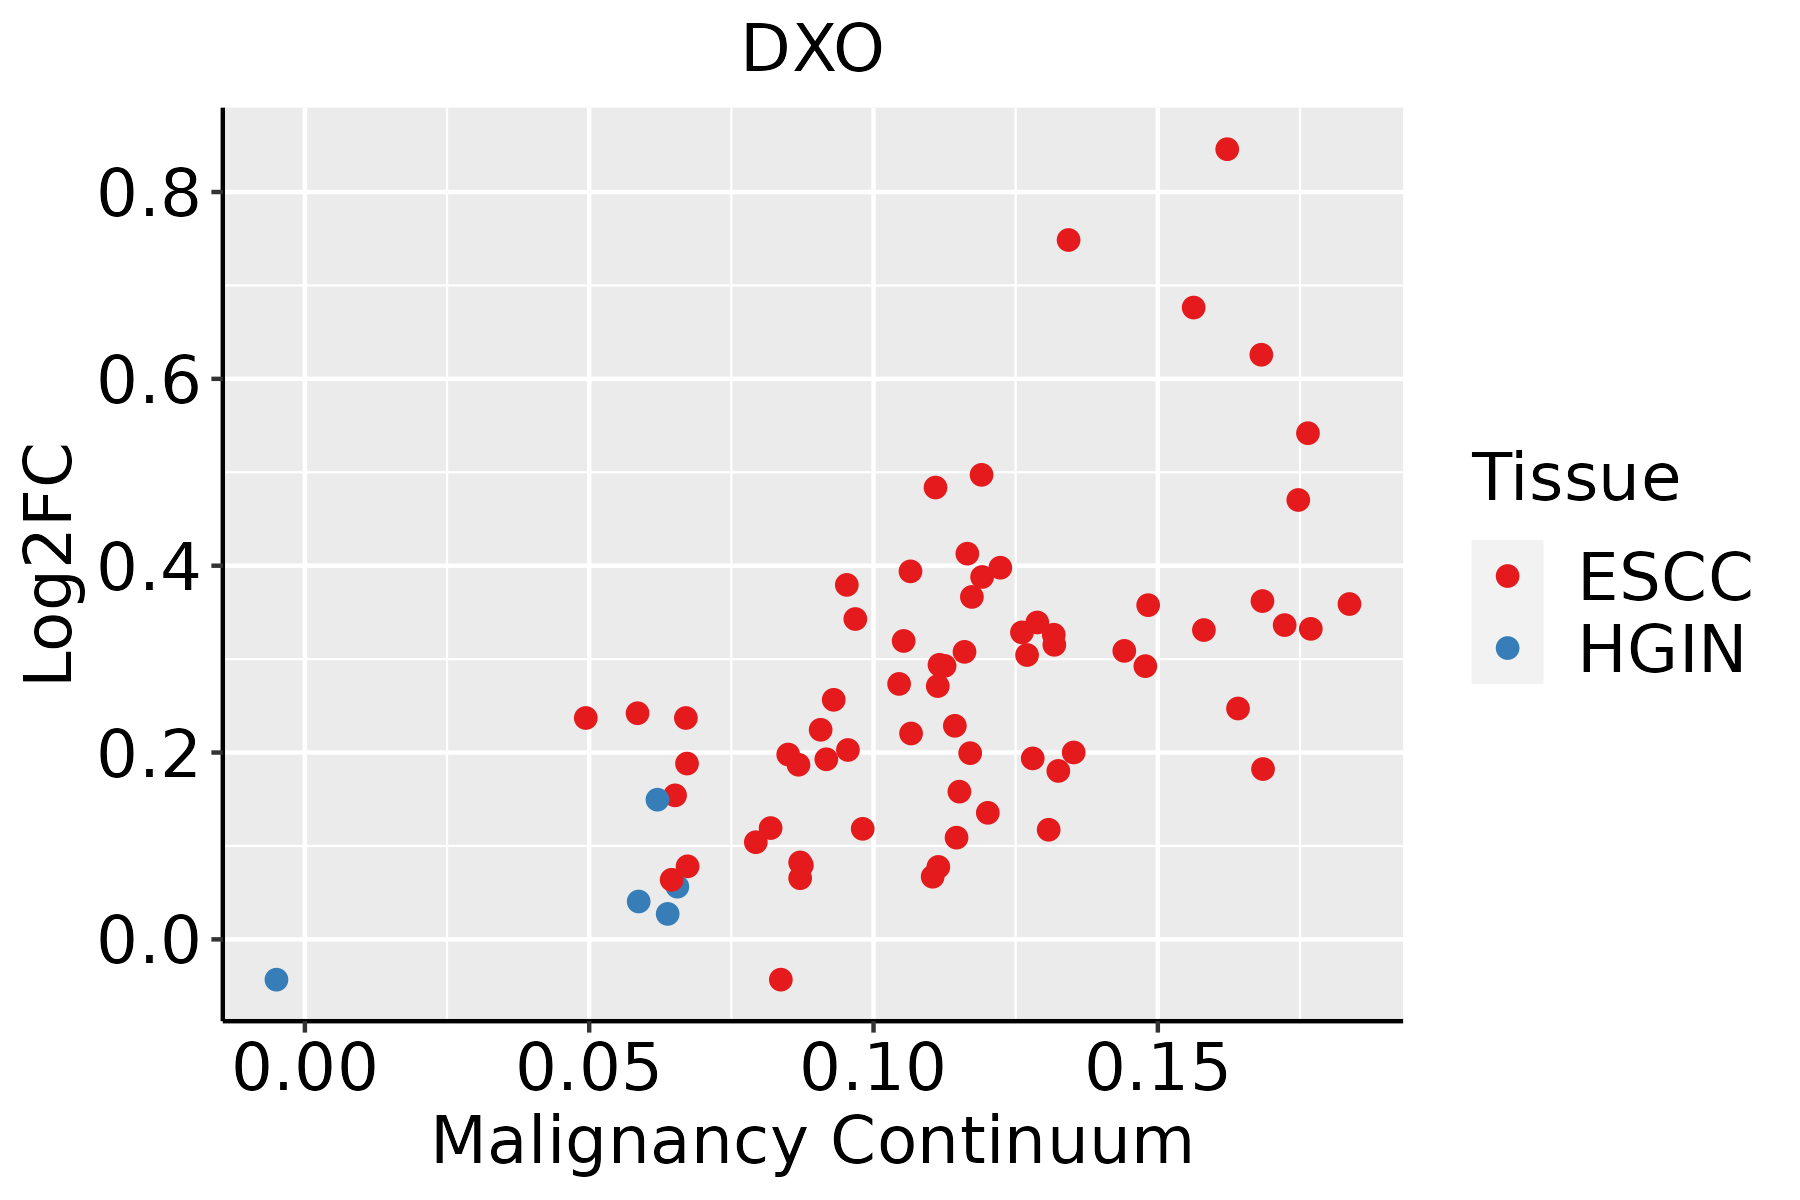 | ESCC: Esophageal squamous cell carcinoma |
| HGIN: High-grade intraepithelial neoplasias | ||
| LGIN: Low-grade intraepithelial neoplasias | ||
| Liver | 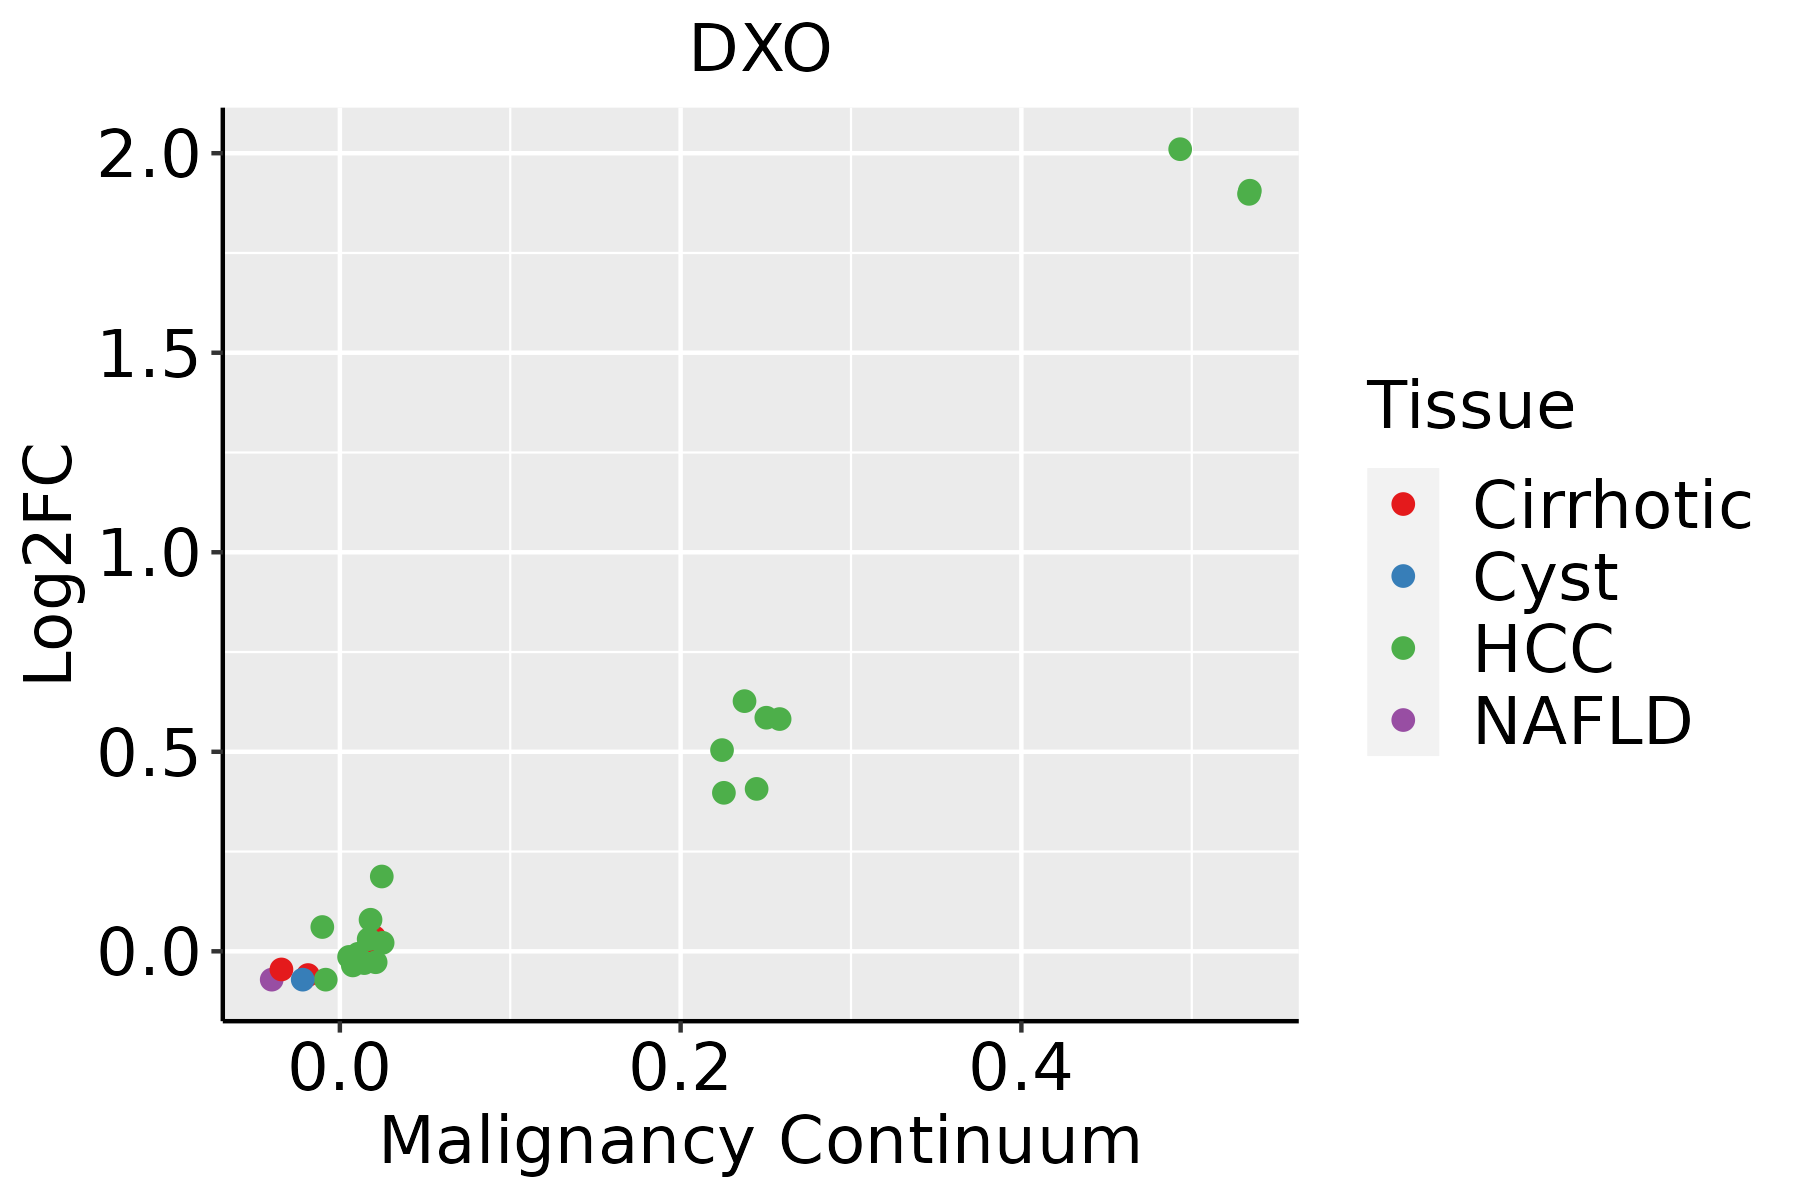 | HCC: Hepatocellular carcinoma |
| NAFLD: Non-alcoholic fatty liver disease | ||
| Oral Cavity | 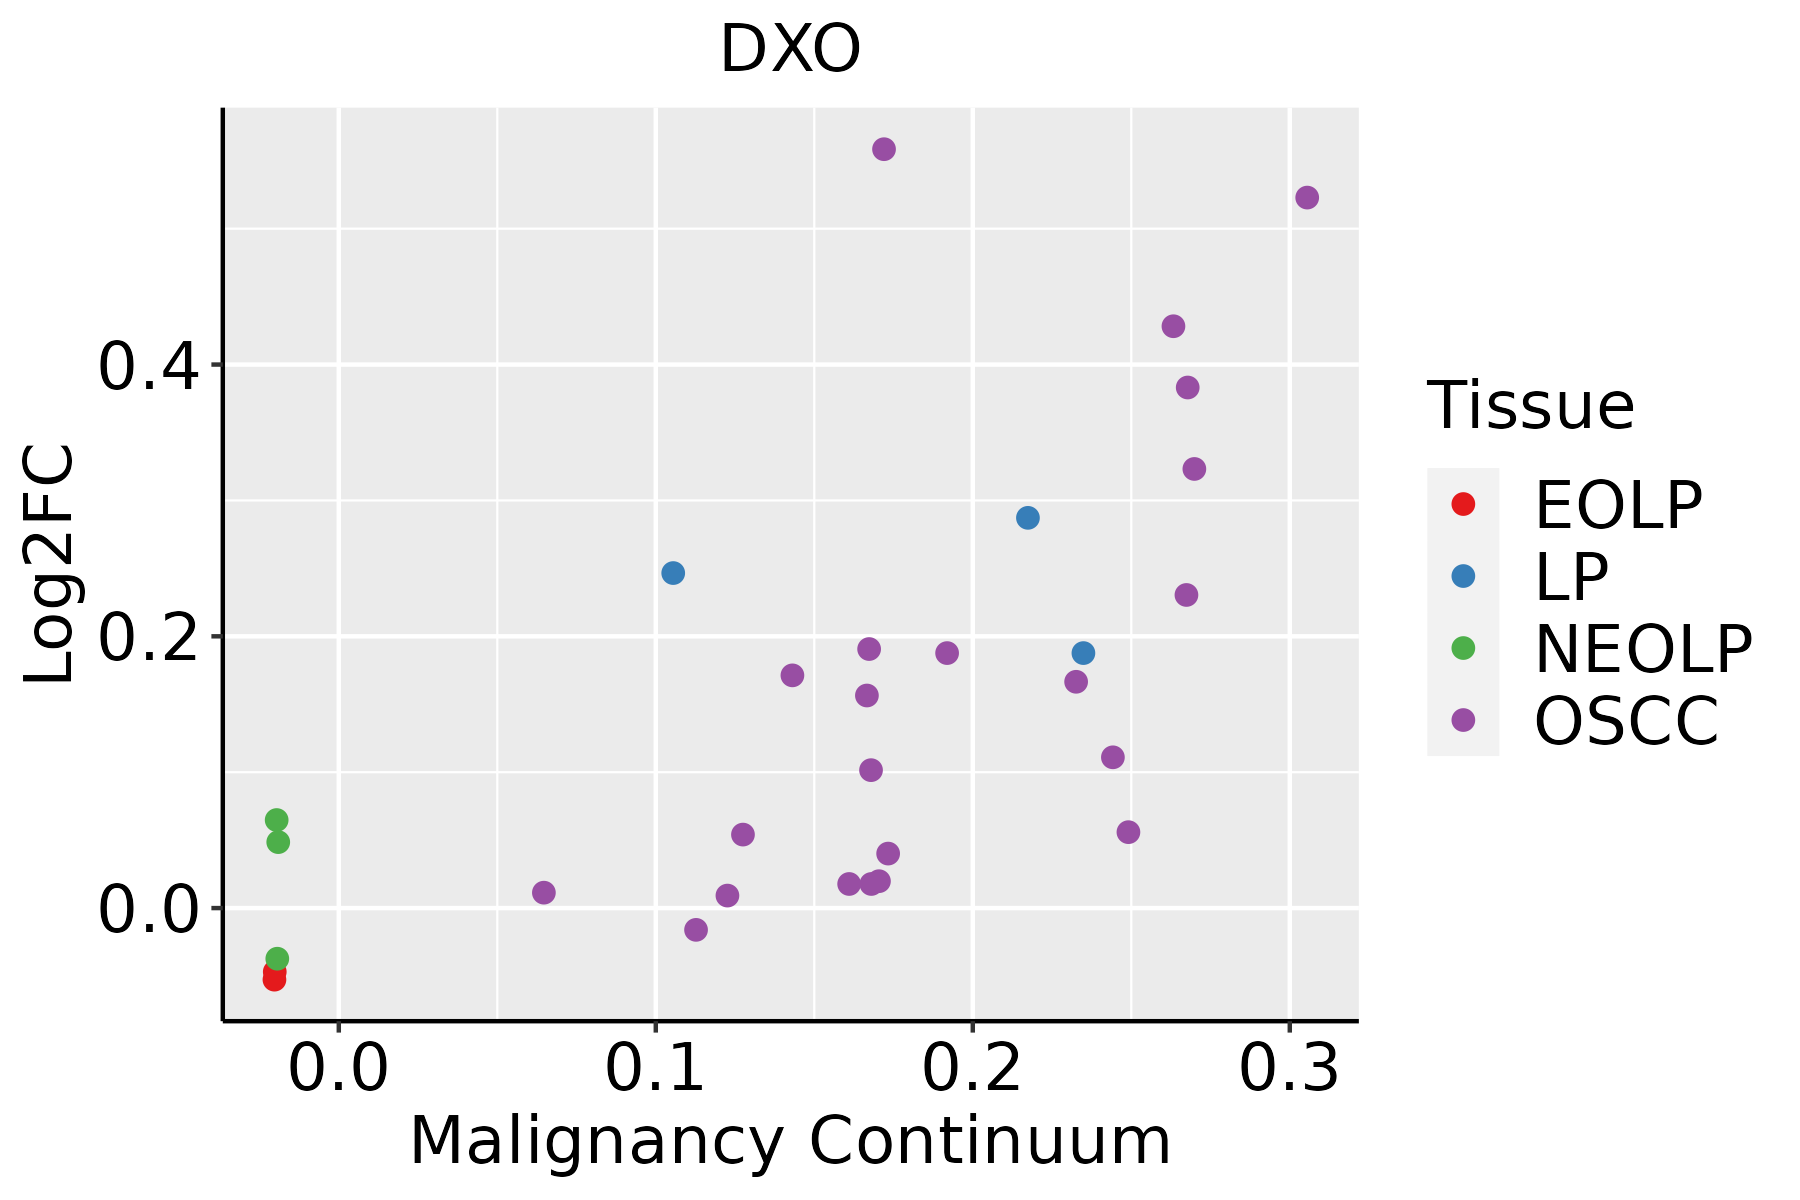 | EOLP: Erosive Oral lichen planus |
| LP: leukoplakia | ||
| NEOLP: Non-erosive oral lichen planus | ||
| OSCC: Oral squamous cell carcinoma |
| ∗log2FC in expression of this searched gene in stem-like cells from each diseased tissue sample relative to stem-like cells in normal samples in each tissue plotted against the malignancy continuum. Samples are colored based on if they are from different disease stage. |
Top |
Malignant transformation related pathway analysis |
| Find out the enriched GO biological processes and KEGG pathways involved in transition from healthy to precancer to cancer |
| Tissue | Disease Stage | Enriched GO biological Processes |
| Colorectum | AD |  |
| Colorectum | SER |  |
| Colorectum | MSS |  |
| Colorectum | MSI-H |  |
| Colorectum | FAP |  |
| ∗Top 15 enriched GO BP terms are showed in the bar plot of each disease state in each tissue. Each row represents a significant GO biological process which is colored according to the -log10(p.adjust). |
| Page: 1 2 3 4 5 6 7 8 9 |
| GO ID | Tissue | Disease Stage | Description | Gene Ratio | Bg Ratio | pvalue | p.adjust | Count |
| GO:0009896111 | Esophagus | ESCC | positive regulation of catabolic process | 332/8552 | 492/18723 | 4.36e-23 | 9.22e-21 | 332 |
| GO:0031331111 | Esophagus | ESCC | positive regulation of cellular catabolic process | 292/8552 | 427/18723 | 8.67e-22 | 1.53e-19 | 292 |
| GO:0006401110 | Esophagus | ESCC | RNA catabolic process | 204/8552 | 278/18723 | 3.39e-21 | 5.66e-19 | 204 |
| GO:0034655110 | Esophagus | ESCC | nucleobase-containing compound catabolic process | 272/8552 | 407/18723 | 2.92e-18 | 2.90e-16 | 272 |
| GO:0006402110 | Esophagus | ESCC | mRNA catabolic process | 170/8552 | 232/18723 | 8.70e-18 | 8.00e-16 | 170 |
| GO:004670018 | Esophagus | ESCC | heterocycle catabolic process | 286/8552 | 445/18723 | 1.12e-15 | 7.47e-14 | 286 |
| GO:004427019 | Esophagus | ESCC | cellular nitrogen compound catabolic process | 288/8552 | 451/18723 | 3.03e-15 | 1.79e-13 | 288 |
| GO:001943918 | Esophagus | ESCC | aromatic compound catabolic process | 295/8552 | 467/18723 | 1.09e-14 | 5.98e-13 | 295 |
| GO:190136118 | Esophagus | ESCC | organic cyclic compound catabolic process | 307/8552 | 495/18723 | 9.99e-14 | 4.80e-12 | 307 |
| GO:000095618 | Esophagus | ESCC | nuclear-transcribed mRNA catabolic process | 88/8552 | 112/18723 | 9.41e-13 | 4.14e-11 | 88 |
| GO:004348719 | Esophagus | ESCC | regulation of RNA stability | 117/8552 | 170/18723 | 7.91e-10 | 1.94e-08 | 117 |
| GO:00903053 | Esophagus | ESCC | nucleic acid phosphodiester bond hydrolysis | 163/8552 | 261/18723 | 3.07e-08 | 5.73e-07 | 163 |
| GO:005077916 | Esophagus | ESCC | RNA destabilization | 63/8552 | 88/18723 | 7.23e-07 | 9.40e-06 | 63 |
| GO:00710252 | Esophagus | ESCC | RNA surveillance | 14/8552 | 15/18723 | 1.47e-04 | 9.85e-04 | 14 |
| GO:00710273 | Esophagus | ESCC | nuclear RNA surveillance | 12/8552 | 13/18723 | 6.18e-04 | 3.32e-03 | 12 |
| GO:00710283 | Esophagus | ESCC | nuclear mRNA surveillance | 12/8552 | 13/18723 | 6.18e-04 | 3.32e-03 | 12 |
| GO:0110154 | Esophagus | ESCC | RNA decapping | 14/8552 | 18/18723 | 5.77e-03 | 2.14e-02 | 14 |
| GO:000989622 | Liver | HCC | positive regulation of catabolic process | 335/7958 | 492/18723 | 3.83e-31 | 1.87e-28 | 335 |
| GO:003133122 | Liver | HCC | positive regulation of cellular catabolic process | 295/7958 | 427/18723 | 3.20e-29 | 1.45e-26 | 295 |
| GO:004427021 | Liver | HCC | cellular nitrogen compound catabolic process | 303/7958 | 451/18723 | 9.76e-27 | 3.64e-24 | 303 |
| Page: 1 2 3 |
| Pathway ID | Tissue | Disease Stage | Description | Gene Ratio | Bg Ratio | pvalue | p.adjust | qvalue | Count |
| Page: 1 |
Top |
Cell-cell communication analysis |
| Identification of potential cell-cell interactions between two cell types and their ligand-receptor pairs for different disease states |
| Ligand | Receptor | LRpair | Pathway | Tissue | Disease Stage |
| Page: 1 |
Top |
Single-cell gene regulatory network inference analysis |
| Find out the significant the regulons (TFs) and the target genes of each regulon across cell types for different disease states |
| TF | Cell Type | Tissue | Disease Stage | Target Gene | RSS | Regulon Activity |
| ∗The dot plots of a searched regulon are shown for all cell subpopulations in each disease state of each tissue based on the regulon specific score inferred using pySCENIC and by calculating the average expression. |
| Page: 1 |
Top |
Somatic mutation of malignant transformation related genes |
| Annotation of somatic variants for genes involved in malignant transformation |
| Hugo Symbol | Variant Class | Variant Classification | dbSNP RS | HGVSc | HGVSp | HGVSp Short | SWISSPROT | BIOTYPE | SIFT | PolyPhen | Tumor Sample Barcode | Tissue | Histology | Sex | Age | Stage | Therapy Types | Drugs | Outcome |
| DXO | SNV | Missense_Mutation | c.70C>A | p.Arg24Ser | p.R24S | O77932 | protein_coding | tolerated(1) | benign(0) | TCGA-AC-A23H-01 | Breast | breast invasive carcinoma | Female | >=65 | I/II | Unknown | Unknown | PD | |
| DXO | SNV | Missense_Mutation | rs780217920 | c.1048N>A | p.Val350Ile | p.V350I | O77932 | protein_coding | deleterious(0.04) | benign(0.003) | TCGA-AR-A256-01 | Breast | breast invasive carcinoma | Female | <65 | I/II | Chemotherapy | doxorubicin | PD |
| DXO | insertion | In_Frame_Ins | novel | c.228_229insAGG | p.Asn76_Gly77insArg | p.N76_G77insR | O77932 | protein_coding | TCGA-A8-A08H-01 | Breast | breast invasive carcinoma | Female | >=65 | I/II | Unknown | Unknown | SD | ||
| DXO | insertion | Frame_Shift_Ins | novel | c.227_228insTGCTTGTGTCAGACCTTCAGCCTGTAACTCCTGCCTCT | p.Gly77AlafsTer65 | p.G77Afs*65 | O77932 | protein_coding | TCGA-A8-A08H-01 | Breast | breast invasive carcinoma | Female | >=65 | I/II | Unknown | Unknown | SD | ||
| DXO | SNV | Missense_Mutation | novel | c.158N>G | p.Ser53Cys | p.S53C | O77932 | protein_coding | deleterious(0) | probably_damaging(0.942) | TCGA-VS-A952-01 | Cervix | cervical & endocervical cancer | Female | >=65 | I/II | Unknown | Unknown | SD |
| DXO | SNV | Missense_Mutation | novel | c.275N>G | p.Tyr92Cys | p.Y92C | O77932 | protein_coding | deleterious(0) | benign(0.382) | TCGA-AA-3663-01 | Colorectum | colon adenocarcinoma | Male | <65 | I/II | Unknown | Unknown | SD |
| DXO | SNV | Missense_Mutation | novel | c.673N>A | p.Gly225Arg | p.G225R | O77932 | protein_coding | tolerated(0.06) | possibly_damaging(0.78) | TCGA-AA-3966-01 | Colorectum | colon adenocarcinoma | Female | >=65 | I/II | Unknown | Unknown | SD |
| DXO | SNV | Missense_Mutation | rs754532504 | c.389C>T | p.Thr130Met | p.T130M | O77932 | protein_coding | tolerated(0.08) | possibly_damaging(0.544) | TCGA-G4-6628-01 | Colorectum | colon adenocarcinoma | Male | >=65 | I/II | Unknown | Unknown | SD |
| DXO | SNV | Missense_Mutation | rs567817660 | c.668N>A | p.Arg223His | p.R223H | O77932 | protein_coding | deleterious(0) | possibly_damaging(0.767) | TCGA-QG-A5YV-01 | Colorectum | colon adenocarcinoma | Female | <65 | III/IV | Chemotherapy | xeloda | CR |
| DXO | SNV | Missense_Mutation | rs780217920 | c.1048N>A | p.Val350Ile | p.V350I | O77932 | protein_coding | deleterious(0.04) | benign(0.003) | TCGA-EI-6882-01 | Colorectum | rectum adenocarcinoma | Male | <65 | I/II | Unknown | Unknown | SD |
| Page: 1 2 3 |
Top |
Related drugs of malignant transformation related genes |
| Identification of chemicals and drugs interact with genes involved in malignant transfromation |
| (DGIdb 4.0) |
| Entrez ID | Symbol | Category | Interaction Types | Drug Claim Name | Drug Name | PMIDs |
| Page: 1 |

Copyright 2023-Present -The University of Texas Health Science Center at Houston |