
|
|||||
|
 | |
| |
| |
| |
| |
| |
|
Gene: DUSP6 |
Gene summary for DUSP6 |
| Gene information | Species | Human | Gene symbol | DUSP6 | Gene ID | 1848 |
| Gene name | dual specificity phosphatase 6 | |
| Gene Alias | HH19 | |
| Cytomap | 12q21.33 | |
| Gene Type | protein-coding | GO ID | GO:0000165 | UniProtAcc | A0A024RBC1 |
Top |
Malignant transformation analysis |
| Identification of the aberrant gene expression in precancerous and cancerous lesions by comparing the gene expression of stem-like cells in diseased tissues with normal stem cells |
| Entrez ID | Symbol | Replicates | Species | Organ | Tissue | Adj P-value | Log2FC | Malignancy |
| 1848 | DUSP6 | CA_HPV_1 | Human | Cervix | CC | 1.26e-05 | -1.84e-01 | 0.0264 |
| 1848 | DUSP6 | CA_HPV_3 | Human | Cervix | CC | 3.22e-04 | -3.08e-01 | 0.0414 |
| 1848 | DUSP6 | CCI_1 | Human | Cervix | CC | 1.94e-05 | -5.26e-01 | 0.528 |
| 1848 | DUSP6 | CCI_2 | Human | Cervix | CC | 7.14e-05 | -5.26e-01 | 0.5249 |
| 1848 | DUSP6 | CCI_3 | Human | Cervix | CC | 2.22e-05 | -5.10e-01 | 0.516 |
| 1848 | DUSP6 | CCII_1 | Human | Cervix | CC | 9.71e-07 | -4.92e-01 | 0.3249 |
| 1848 | DUSP6 | Tumor | Human | Cervix | CC | 7.83e-11 | -3.76e-01 | 0.1241 |
| 1848 | DUSP6 | sample3 | Human | Cervix | CC | 7.10e-08 | -3.26e-01 | 0.1387 |
| 1848 | DUSP6 | L1 | Human | Cervix | CC | 2.33e-10 | -4.96e-01 | 0.0802 |
| 1848 | DUSP6 | T3 | Human | Cervix | CC | 4.84e-06 | -3.16e-01 | 0.1389 |
| 1848 | DUSP6 | HTA11_347_2000001011 | Human | Colorectum | AD | 1.30e-03 | 1.83e-01 | -0.1954 |
| 1848 | DUSP6 | HTA11_99999970781_79442 | Human | Colorectum | MSS | 1.80e-21 | 5.94e-01 | 0.294 |
| 1848 | DUSP6 | HTA11_99999965062_69753 | Human | Colorectum | MSI-H | 2.86e-04 | 9.57e-01 | 0.3487 |
| 1848 | DUSP6 | HTA11_99999971662_82457 | Human | Colorectum | MSS | 2.93e-05 | 2.86e-01 | 0.3859 |
| 1848 | DUSP6 | LZE8T | Human | Esophagus | ESCC | 3.40e-02 | -4.32e-01 | 0.067 |
| 1848 | DUSP6 | LZE20T | Human | Esophagus | ESCC | 2.29e-08 | -5.52e-01 | 0.0662 |
| 1848 | DUSP6 | LZE22D1 | Human | Esophagus | HGIN | 2.64e-05 | -6.15e-01 | 0.0595 |
| 1848 | DUSP6 | LZE24T | Human | Esophagus | ESCC | 3.71e-13 | -5.96e-01 | 0.0596 |
| 1848 | DUSP6 | P2T-E | Human | Esophagus | ESCC | 1.55e-50 | 1.95e+00 | 0.1177 |
| 1848 | DUSP6 | P8T-E | Human | Esophagus | ESCC | 3.25e-03 | 2.87e-01 | 0.0889 |
| Page: 1 2 3 4 5 6 |
| Tissue | Expression Dynamics | Abbreviation |
| Cervix | 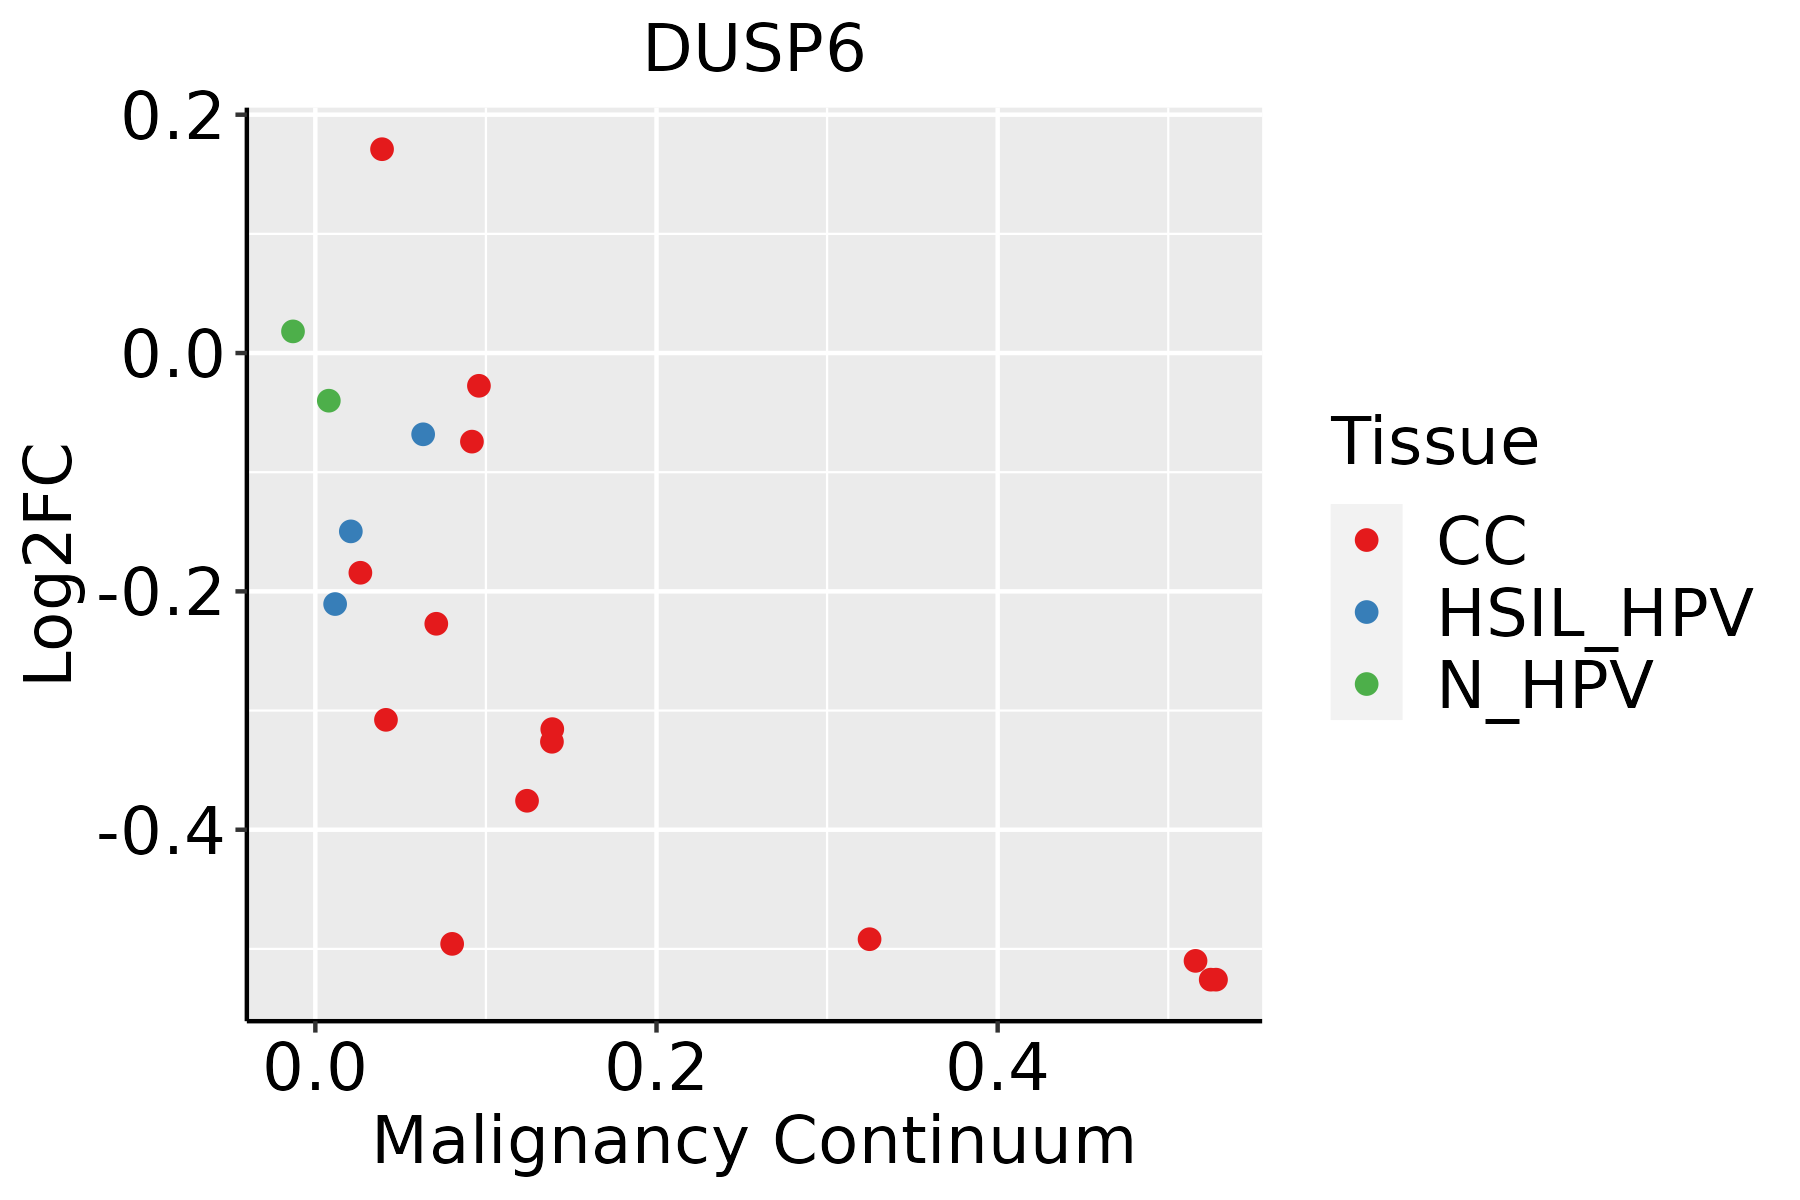 | CC: Cervix cancer |
| HSIL_HPV: HPV-infected high-grade squamous intraepithelial lesions | ||
| N_HPV: HPV-infected normal cervix | ||
| Colorectum (GSE201348) |  | FAP: Familial adenomatous polyposis |
| CRC: Colorectal cancer | ||
| Colorectum (HTA11) |  | AD: Adenomas |
| SER: Sessile serrated lesions | ||
| MSI-H: Microsatellite-high colorectal cancer | ||
| MSS: Microsatellite stable colorectal cancer | ||
| Esophagus |  | ESCC: Esophageal squamous cell carcinoma |
| HGIN: High-grade intraepithelial neoplasias | ||
| LGIN: Low-grade intraepithelial neoplasias | ||
| Liver | 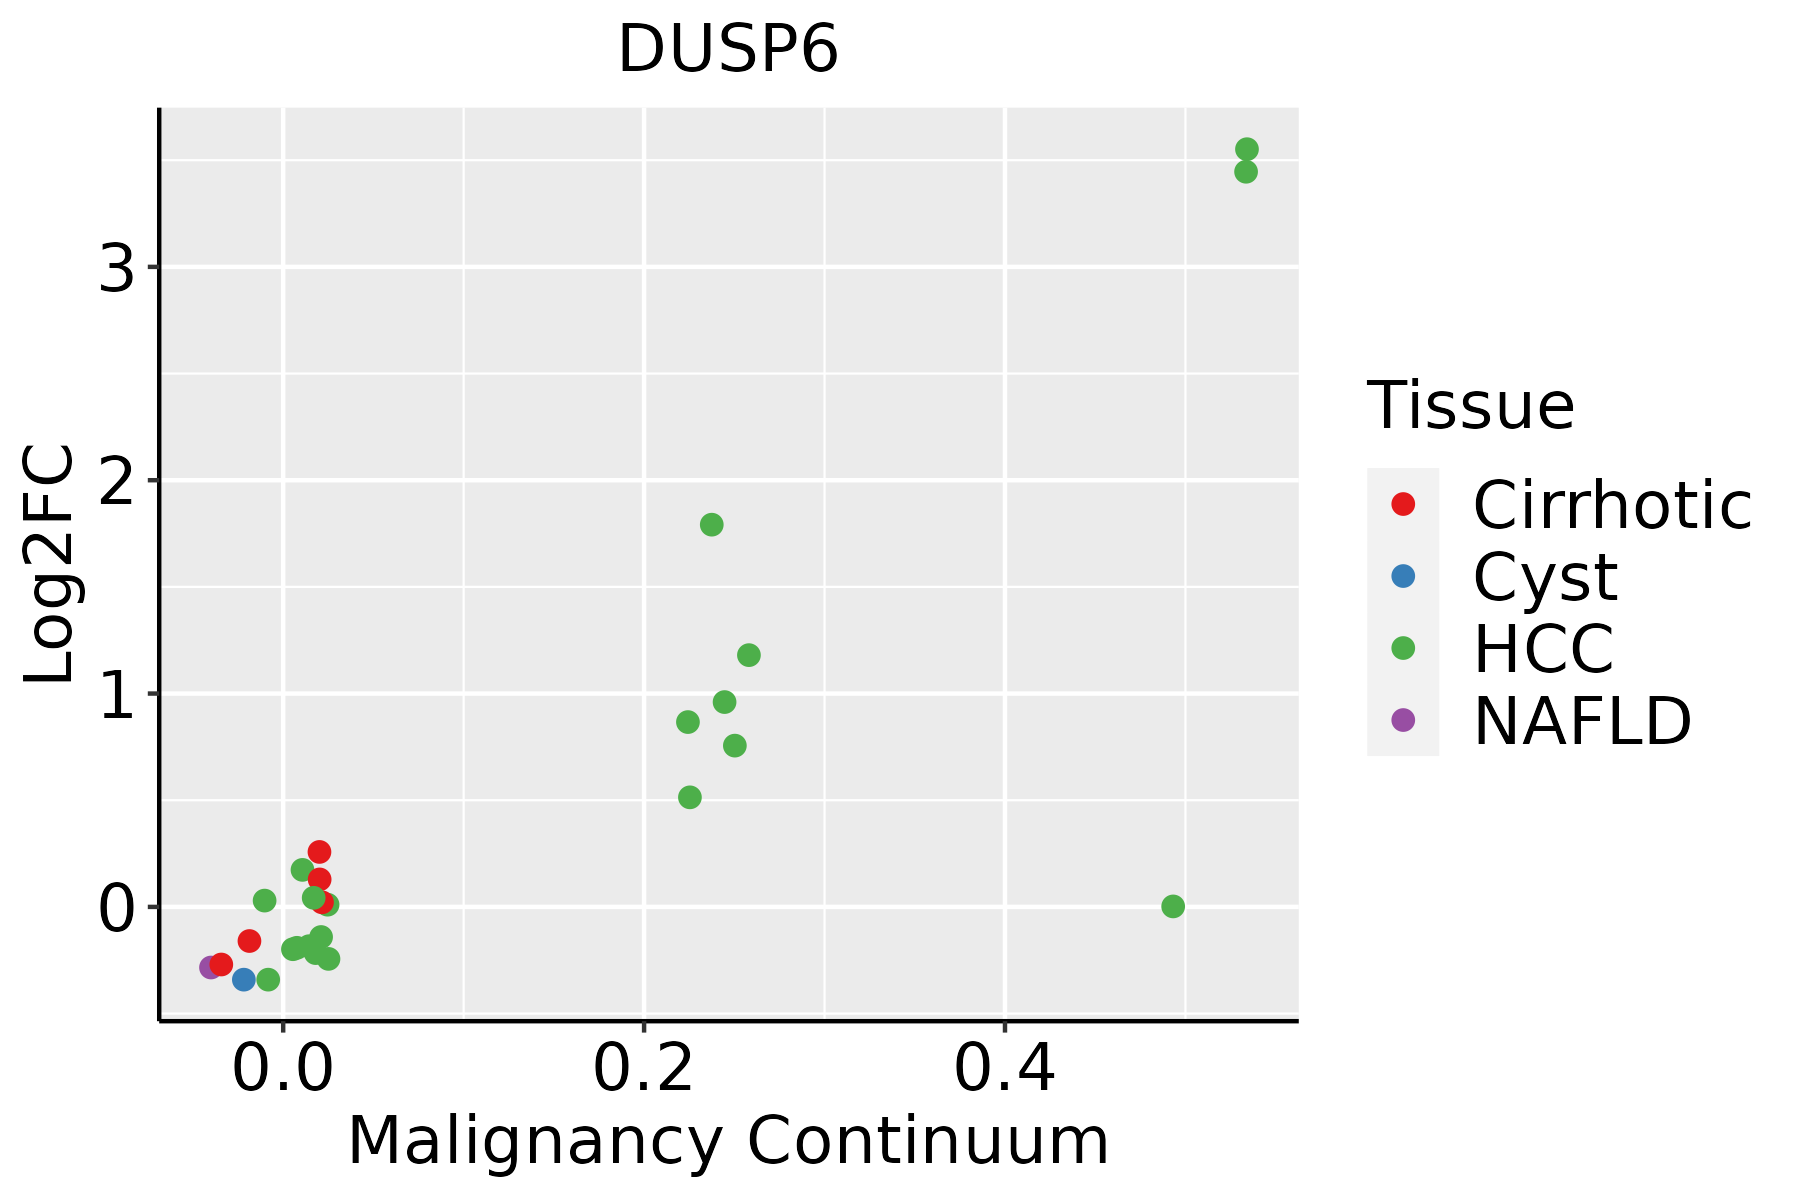 | HCC: Hepatocellular carcinoma |
| NAFLD: Non-alcoholic fatty liver disease | ||
| Lung | 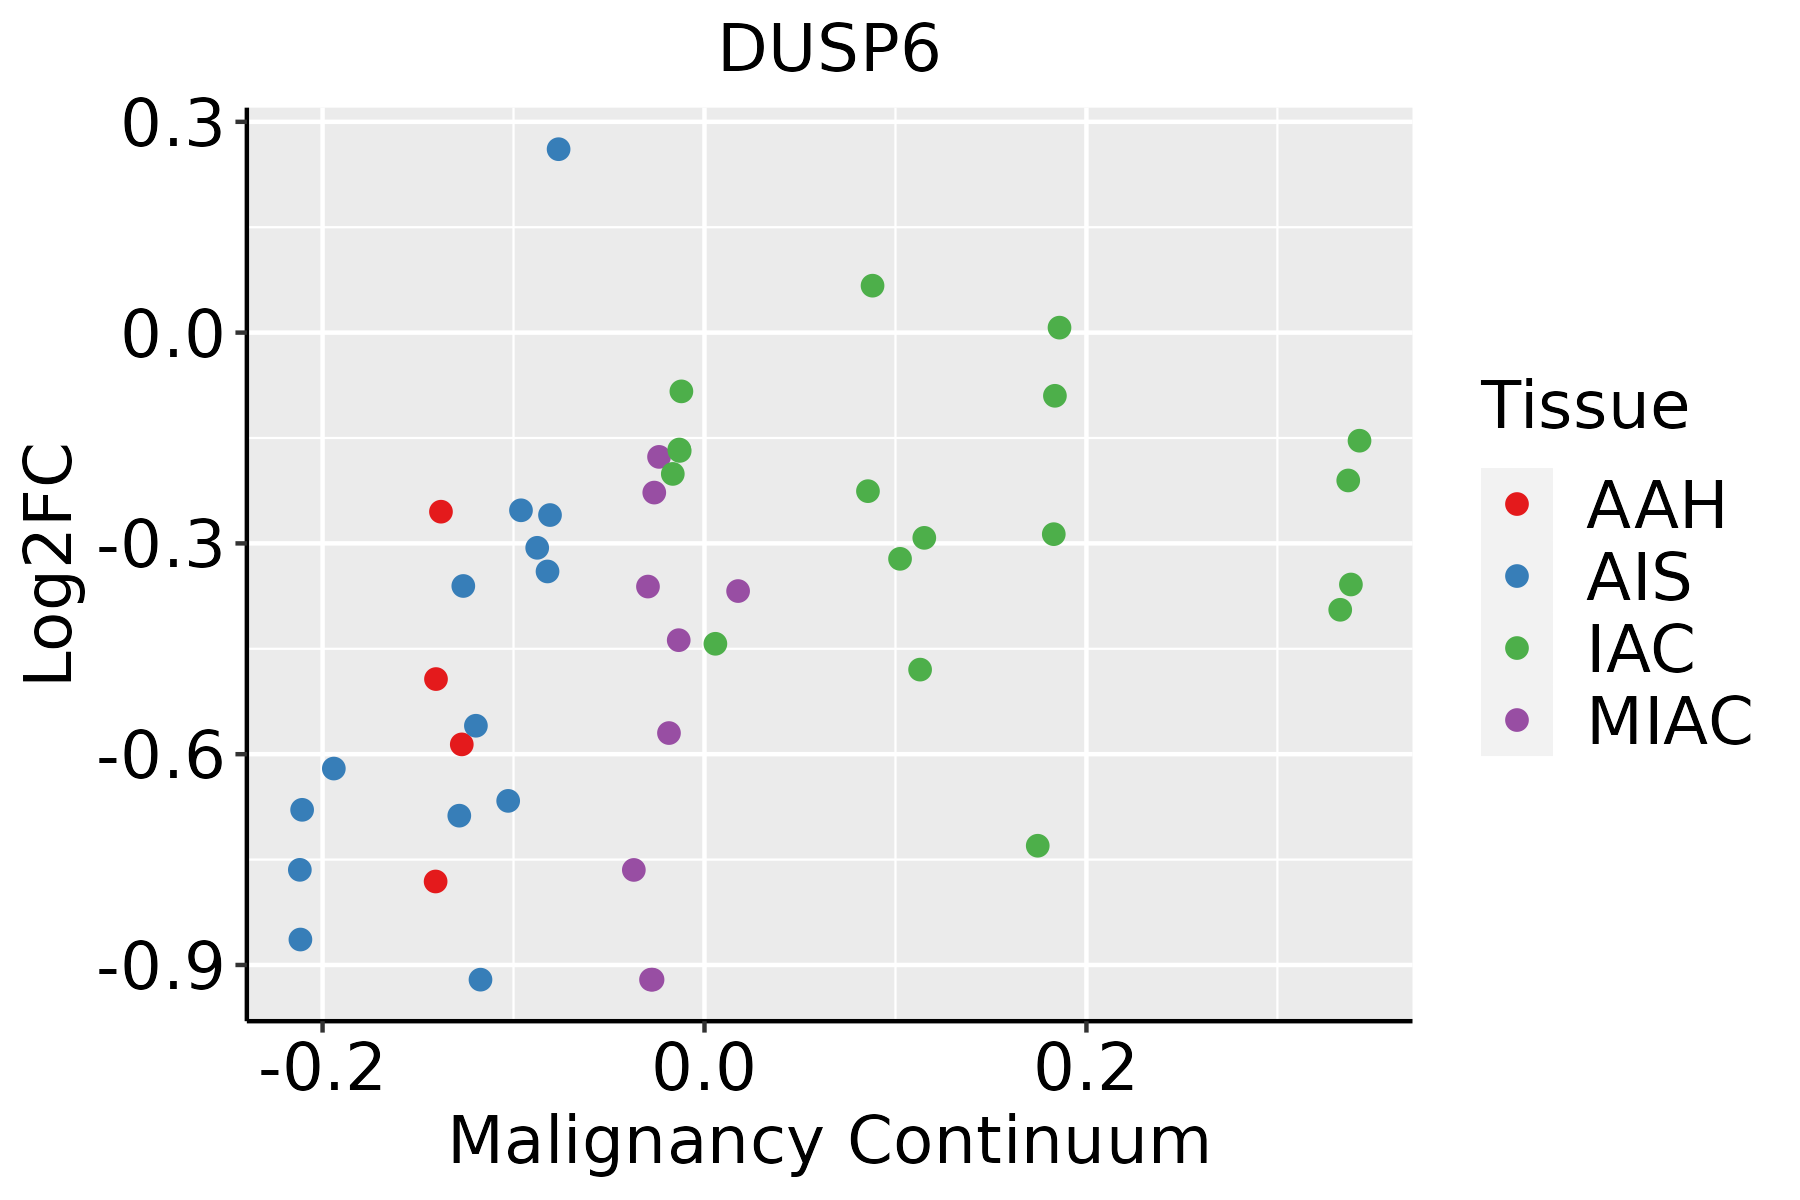 | AAH: Atypical adenomatous hyperplasia |
| AIS: Adenocarcinoma in situ | ||
| IAC: Invasive lung adenocarcinoma | ||
| MIA: Minimally invasive adenocarcinoma | ||
| Oral Cavity |  | EOLP: Erosive Oral lichen planus |
| LP: leukoplakia | ||
| NEOLP: Non-erosive oral lichen planus | ||
| OSCC: Oral squamous cell carcinoma | ||
| Skin | 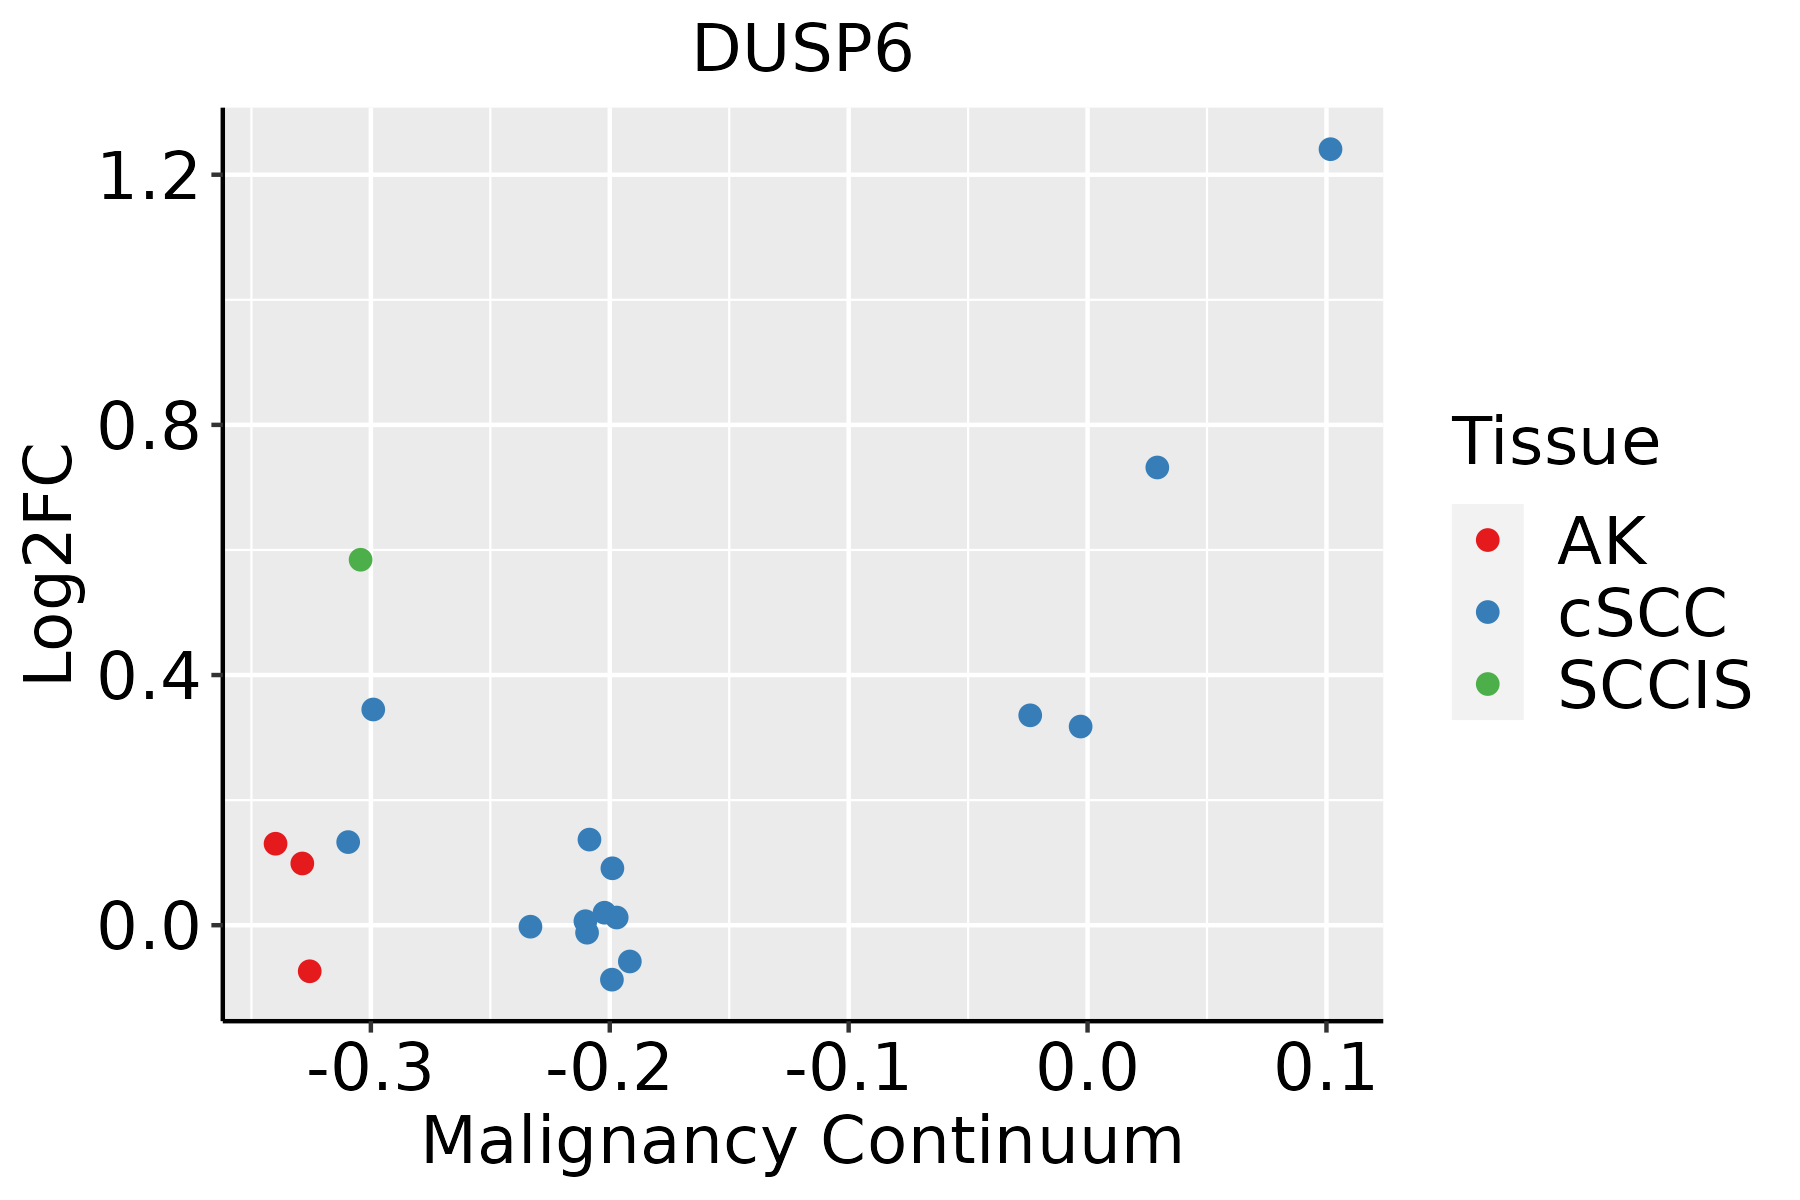 | AK: Actinic keratosis |
| cSCC: Cutaneous squamous cell carcinoma | ||
| SCCIS:squamous cell carcinoma in situ | ||
| Thyroid |  | ATC: Anaplastic thyroid cancer |
| HT: Hashimoto's thyroiditis | ||
| PTC: Papillary thyroid cancer |
| ∗log2FC in expression of this searched gene in stem-like cells from each diseased tissue sample relative to stem-like cells in normal samples in each tissue plotted against the malignancy continuum. Samples are colored based on if they are from different disease stage. |
Top |
Malignant transformation related pathway analysis |
| Find out the enriched GO biological processes and KEGG pathways involved in transition from healthy to precancer to cancer |
| Tissue | Disease Stage | Enriched GO biological Processes |
| Colorectum | AD |  |
| Colorectum | SER |  |
| Colorectum | MSS |  |
| Colorectum | MSI-H |  |
| Colorectum | FAP |  |
| ∗Top 15 enriched GO BP terms are showed in the bar plot of each disease state in each tissue. Each row represents a significant GO biological process which is colored according to the -log10(p.adjust). |
| Page: 1 2 3 4 5 6 7 8 9 |
| GO ID | Tissue | Disease Stage | Description | Gene Ratio | Bg Ratio | pvalue | p.adjust | Count |
| GO:004593610 | Cervix | CC | negative regulation of phosphate metabolic process | 88/2311 | 441/18723 | 2.92e-06 | 8.27e-05 | 88 |
| GO:001056310 | Cervix | CC | negative regulation of phosphorus metabolic process | 88/2311 | 442/18723 | 3.21e-06 | 8.77e-05 | 88 |
| GO:004232610 | Cervix | CC | negative regulation of phosphorylation | 77/2311 | 385/18723 | 1.09e-05 | 2.38e-04 | 77 |
| GO:00064708 | Cervix | CC | protein dephosphorylation | 60/2311 | 281/18723 | 1.33e-05 | 2.68e-04 | 60 |
| GO:000193310 | Cervix | CC | negative regulation of protein phosphorylation | 69/2311 | 342/18723 | 2.29e-05 | 4.01e-04 | 69 |
| GO:00486386 | Cervix | CC | regulation of developmental growth | 61/2311 | 330/18723 | 7.69e-04 | 6.85e-03 | 61 |
| GO:00434099 | Cervix | CC | negative regulation of MAPK cascade | 37/2311 | 180/18723 | 1.17e-03 | 9.50e-03 | 37 |
| GO:00163117 | Cervix | CC | dephosphorylation | 73/2311 | 417/18723 | 1.23e-03 | 9.87e-03 | 73 |
| GO:00703714 | Cervix | CC | ERK1 and ERK2 cascade | 60/2311 | 330/18723 | 1.28e-03 | 1.02e-02 | 60 |
| GO:00094109 | Cervix | CC | response to xenobiotic stimulus | 78/2311 | 462/18723 | 2.39e-03 | 1.70e-02 | 78 |
| GO:00703723 | Cervix | CC | regulation of ERK1 and ERK2 cascade | 54/2311 | 309/18723 | 5.11e-03 | 3.02e-02 | 54 |
| GO:0010563 | Colorectum | AD | negative regulation of phosphorus metabolic process | 130/3918 | 442/18723 | 1.26e-05 | 2.76e-04 | 130 |
| GO:0045936 | Colorectum | AD | negative regulation of phosphate metabolic process | 129/3918 | 441/18723 | 1.81e-05 | 3.76e-04 | 129 |
| GO:0016311 | Colorectum | AD | dephosphorylation | 123/3918 | 417/18723 | 1.84e-05 | 3.82e-04 | 123 |
| GO:0006470 | Colorectum | AD | protein dephosphorylation | 88/3918 | 281/18723 | 2.56e-05 | 4.89e-04 | 88 |
| GO:0042326 | Colorectum | AD | negative regulation of phosphorylation | 112/3918 | 385/18723 | 8.02e-05 | 1.27e-03 | 112 |
| GO:0001933 | Colorectum | AD | negative regulation of protein phosphorylation | 101/3918 | 342/18723 | 9.39e-05 | 1.42e-03 | 101 |
| GO:0009410 | Colorectum | AD | response to xenobiotic stimulus | 128/3918 | 462/18723 | 2.69e-04 | 3.31e-03 | 128 |
| GO:0043409 | Colorectum | AD | negative regulation of MAPK cascade | 57/3918 | 180/18723 | 4.61e-04 | 5.14e-03 | 57 |
| GO:0048638 | Colorectum | AD | regulation of developmental growth | 92/3918 | 330/18723 | 1.48e-03 | 1.25e-02 | 92 |
| Page: 1 2 3 4 5 6 7 8 |
| Pathway ID | Tissue | Disease Stage | Description | Gene Ratio | Bg Ratio | pvalue | p.adjust | qvalue | Count |
| hsa040109 | Cervix | CC | MAPK signaling pathway | 62/1267 | 302/8465 | 4.89e-03 | 1.67e-02 | 9.86e-03 | 62 |
| hsa0401012 | Cervix | CC | MAPK signaling pathway | 62/1267 | 302/8465 | 4.89e-03 | 1.67e-02 | 9.86e-03 | 62 |
| hsa052215 | Esophagus | ESCC | Acute myeloid leukemia | 49/4205 | 67/8465 | 7.43e-05 | 3.07e-04 | 1.57e-04 | 49 |
| hsa052028 | Esophagus | ESCC | Transcriptional misregulation in cancer | 116/4205 | 193/8465 | 2.08e-03 | 5.95e-03 | 3.05e-03 | 116 |
| hsa0522113 | Esophagus | ESCC | Acute myeloid leukemia | 49/4205 | 67/8465 | 7.43e-05 | 3.07e-04 | 1.57e-04 | 49 |
| hsa0520213 | Esophagus | ESCC | Transcriptional misregulation in cancer | 116/4205 | 193/8465 | 2.08e-03 | 5.95e-03 | 3.05e-03 | 116 |
| hsa05221 | Liver | HCC | Acute myeloid leukemia | 41/4020 | 67/8465 | 1.64e-02 | 3.90e-02 | 2.17e-02 | 41 |
| hsa052211 | Liver | HCC | Acute myeloid leukemia | 41/4020 | 67/8465 | 1.64e-02 | 3.90e-02 | 2.17e-02 | 41 |
| hsa040108 | Lung | IAC | MAPK signaling pathway | 62/1053 | 302/8465 | 3.54e-05 | 6.38e-04 | 4.24e-04 | 62 |
| hsa052026 | Lung | IAC | Transcriptional misregulation in cancer | 40/1053 | 193/8465 | 6.90e-04 | 5.90e-03 | 3.92e-03 | 40 |
| hsa0401011 | Lung | IAC | MAPK signaling pathway | 62/1053 | 302/8465 | 3.54e-05 | 6.38e-04 | 4.24e-04 | 62 |
| hsa0520211 | Lung | IAC | Transcriptional misregulation in cancer | 40/1053 | 193/8465 | 6.90e-04 | 5.90e-03 | 3.92e-03 | 40 |
| hsa0401021 | Lung | AIS | MAPK signaling pathway | 57/961 | 302/8465 | 6.41e-05 | 9.43e-04 | 6.03e-04 | 57 |
| hsa052022 | Lung | AIS | Transcriptional misregulation in cancer | 39/961 | 193/8465 | 2.15e-04 | 2.41e-03 | 1.54e-03 | 39 |
| hsa0401031 | Lung | AIS | MAPK signaling pathway | 57/961 | 302/8465 | 6.41e-05 | 9.43e-04 | 6.03e-04 | 57 |
| hsa052023 | Lung | AIS | Transcriptional misregulation in cancer | 39/961 | 193/8465 | 2.15e-04 | 2.41e-03 | 1.54e-03 | 39 |
| hsa040106 | Lung | MIAC | MAPK signaling pathway | 32/507 | 302/8465 | 1.12e-03 | 1.36e-02 | 9.81e-03 | 32 |
| hsa052024 | Lung | MIAC | Transcriptional misregulation in cancer | 22/507 | 193/8465 | 2.64e-03 | 2.26e-02 | 1.64e-02 | 22 |
| hsa052212 | Lung | MIAC | Acute myeloid leukemia | 10/507 | 67/8465 | 6.16e-03 | 4.07e-02 | 2.95e-02 | 10 |
| hsa040107 | Lung | MIAC | MAPK signaling pathway | 32/507 | 302/8465 | 1.12e-03 | 1.36e-02 | 9.81e-03 | 32 |
| Page: 1 2 |
Top |
Cell-cell communication analysis |
| Identification of potential cell-cell interactions between two cell types and their ligand-receptor pairs for different disease states |
| Ligand | Receptor | LRpair | Pathway | Tissue | Disease Stage |
| Page: 1 |
Top |
Single-cell gene regulatory network inference analysis |
| Find out the significant the regulons (TFs) and the target genes of each regulon across cell types for different disease states |
| TF | Cell Type | Tissue | Disease Stage | Target Gene | RSS | Regulon Activity |
| ∗The dot plots of a searched regulon are shown for all cell subpopulations in each disease state of each tissue based on the regulon specific score inferred using pySCENIC and by calculating the average expression. |
| Page: 1 |
Top |
Somatic mutation of malignant transformation related genes |
| Annotation of somatic variants for genes involved in malignant transformation |
| Hugo Symbol | Variant Class | Variant Classification | dbSNP RS | HGVSc | HGVSp | HGVSp Short | SWISSPROT | BIOTYPE | SIFT | PolyPhen | Tumor Sample Barcode | Tissue | Histology | Sex | Age | Stage | Therapy Types | Drugs | Outcome |
| DUSP6 | SNV | Missense_Mutation | novel | c.917C>A | p.Ala306Asp | p.A306D | Q16828 | protein_coding | deleterious(0) | probably_damaging(0.999) | TCGA-A7-A0CE-01 | Breast | breast invasive carcinoma | Female | <65 | I/II | Chemotherapy | adriamycin | SD |
| DUSP6 | SNV | Missense_Mutation | c.73G>A | p.Glu25Lys | p.E25K | Q16828 | protein_coding | tolerated(0.09) | benign(0.067) | TCGA-BH-A0BR-01 | Breast | breast invasive carcinoma | Female | <65 | I/II | Unknown | Unknown | SD | |
| DUSP6 | insertion | Frame_Shift_Ins | novel | c.915_916insATACTCCATTT | p.Ala306IlefsTer15 | p.A306Ifs*15 | Q16828 | protein_coding | TCGA-A7-A0CE-01 | Breast | breast invasive carcinoma | Female | <65 | I/II | Chemotherapy | adriamycin | SD | ||
| DUSP6 | insertion | In_Frame_Ins | novel | c.877_878insCTAATC | p.Cys293delinsSerAsnArg | p.C293delinsSNR | Q16828 | protein_coding | TCGA-A8-A082-01 | Breast | breast invasive carcinoma | Female | <65 | I/II | Chemotherapy | 5-fluorouracil | CR | ||
| DUSP6 | insertion | Frame_Shift_Ins | novel | c.875_876insAAAAGAAAATTGTGCTCTT | p.His292GlnfsTer13 | p.H292Qfs*13 | Q16828 | protein_coding | TCGA-A8-A082-01 | Breast | breast invasive carcinoma | Female | <65 | I/II | Chemotherapy | 5-fluorouracil | CR | ||
| DUSP6 | SNV | Missense_Mutation | novel | c.442N>C | p.Glu148Gln | p.E148Q | Q16828 | protein_coding | tolerated(0.06) | possibly_damaging(0.661) | TCGA-Q1-A73O-01 | Cervix | cervical & endocervical cancer | Female | <65 | I/II | Chemotherapy | cisplatin | CR |
| DUSP6 | SNV | Missense_Mutation | c.93N>A | p.Asn31Lys | p.N31K | Q16828 | protein_coding | tolerated(0.91) | benign(0.007) | TCGA-A6-6648-01 | Colorectum | colon adenocarcinoma | Male | <65 | I/II | Chemotherapy | oxaliplatin | PD | |
| DUSP6 | SNV | Missense_Mutation | novel | c.277N>A | p.Asp93Asn | p.D93N | Q16828 | protein_coding | tolerated(0.5) | benign(0.015) | TCGA-AA-3984-01 | Colorectum | colon adenocarcinoma | Female | <65 | I/II | Unknown | Unknown | SD |
| DUSP6 | SNV | Missense_Mutation | c.911N>T | p.Thr304Ile | p.T304I | Q16828 | protein_coding | deleterious(0.02) | probably_damaging(0.913) | TCGA-AA-A022-01 | Colorectum | colon adenocarcinoma | Female | >=65 | I/II | Unknown | Unknown | SD | |
| DUSP6 | SNV | Missense_Mutation | c.611N>T | p.Pro204Leu | p.P204L | Q16828 | protein_coding | deleterious(0.01) | possibly_damaging(0.641) | TCGA-G4-6295-01 | Colorectum | colon adenocarcinoma | Female | >=65 | I/II | Unknown | Unknown | SD |
| Page: 1 2 3 4 |
Top |
Related drugs of malignant transformation related genes |
| Identification of chemicals and drugs interact with genes involved in malignant transfromation |
| (DGIdb 4.0) |
| Entrez ID | Symbol | Category | Interaction Types | Drug Claim Name | Drug Name | PMIDs |
| 1848 | DUSP6 | DRUGGABLE GENOME, PROTEIN PHOSPHATASE, ENZYME, KINASE | DIMETHYL SULFOXIDE | 10702230 | ||
| 1848 | DUSP6 | DRUGGABLE GENOME, PROTEIN PHOSPHATASE, ENZYME, KINASE | TRAMETINIB | TRAMETINIB | 22169769 | |
| 1848 | DUSP6 | DRUGGABLE GENOME, PROTEIN PHOSPHATASE, ENZYME, KINASE | RETINOIC ACID | 11104676 |
| Page: 1 |

Copyright 2023-Present -The University of Texas Health Science Center at Houston |