
|
|||||
|
 | |
| |
| |
| |
| |
| |
|
Gene: DUSP4 |
Gene summary for DUSP4 |
| Gene information | Species | Human | Gene symbol | DUSP4 | Gene ID | 1846 |
| Gene name | dual specificity phosphatase 4 | |
| Gene Alias | HVH2 | |
| Cytomap | 8p12 | |
| Gene Type | protein-coding | GO ID | GO:0000165 | UniProtAcc | Q13115 |
Top |
Malignant transformation analysis |
| Identification of the aberrant gene expression in precancerous and cancerous lesions by comparing the gene expression of stem-like cells in diseased tissues with normal stem cells |
| Entrez ID | Symbol | Replicates | Species | Organ | Tissue | Adj P-value | Log2FC | Malignancy |
| 1846 | DUSP4 | GSM4909281 | Human | Breast | IDC | 2.57e-08 | -3.38e-01 | 0.21 |
| 1846 | DUSP4 | GSM4909282 | Human | Breast | IDC | 8.95e-11 | -3.37e-01 | -0.0288 |
| 1846 | DUSP4 | GSM4909285 | Human | Breast | IDC | 1.81e-17 | -3.73e-01 | 0.21 |
| 1846 | DUSP4 | GSM4909287 | Human | Breast | IDC | 7.49e-04 | -2.70e-01 | 0.2057 |
| 1846 | DUSP4 | GSM4909292 | Human | Breast | IDC | 2.20e-02 | 6.10e-01 | 0.1236 |
| 1846 | DUSP4 | GSM4909296 | Human | Breast | IDC | 5.08e-03 | -2.13e-01 | 0.1524 |
| 1846 | DUSP4 | GSM4909297 | Human | Breast | IDC | 1.85e-03 | 2.31e-01 | 0.1517 |
| 1846 | DUSP4 | GSM4909298 | Human | Breast | IDC | 2.72e-26 | 6.49e-01 | 0.1551 |
| 1846 | DUSP4 | GSM4909302 | Human | Breast | IDC | 5.72e-03 | 3.09e-01 | 0.1545 |
| 1846 | DUSP4 | GSM4909307 | Human | Breast | IDC | 5.87e-05 | 4.04e-01 | 0.1569 |
| 1846 | DUSP4 | GSM4909308 | Human | Breast | IDC | 6.51e-16 | 4.70e-01 | 0.158 |
| 1846 | DUSP4 | GSM4909311 | Human | Breast | IDC | 1.72e-14 | -3.30e-01 | 0.1534 |
| 1846 | DUSP4 | GSM4909315 | Human | Breast | IDC | 2.37e-04 | -3.24e-01 | 0.21 |
| 1846 | DUSP4 | GSM4909319 | Human | Breast | IDC | 3.41e-13 | -3.14e-01 | 0.1563 |
| 1846 | DUSP4 | brca2 | Human | Breast | Precancer | 1.12e-06 | 3.07e-01 | -0.024 |
| 1846 | DUSP4 | M1 | Human | Breast | IDC | 9.45e-03 | -3.37e-01 | 0.1577 |
| 1846 | DUSP4 | NCCBC14 | Human | Breast | DCIS | 1.41e-07 | 3.59e-01 | 0.2021 |
| 1846 | DUSP4 | NCCBC5 | Human | Breast | DCIS | 1.68e-03 | -1.81e-01 | 0.2046 |
| 1846 | DUSP4 | P1 | Human | Breast | IDC | 1.85e-08 | -2.17e-01 | 0.1527 |
| 1846 | DUSP4 | DCIS2 | Human | Breast | DCIS | 2.20e-32 | 2.64e-01 | 0.0085 |
| Page: 1 2 3 4 |
| Tissue | Expression Dynamics | Abbreviation |
| Breast | 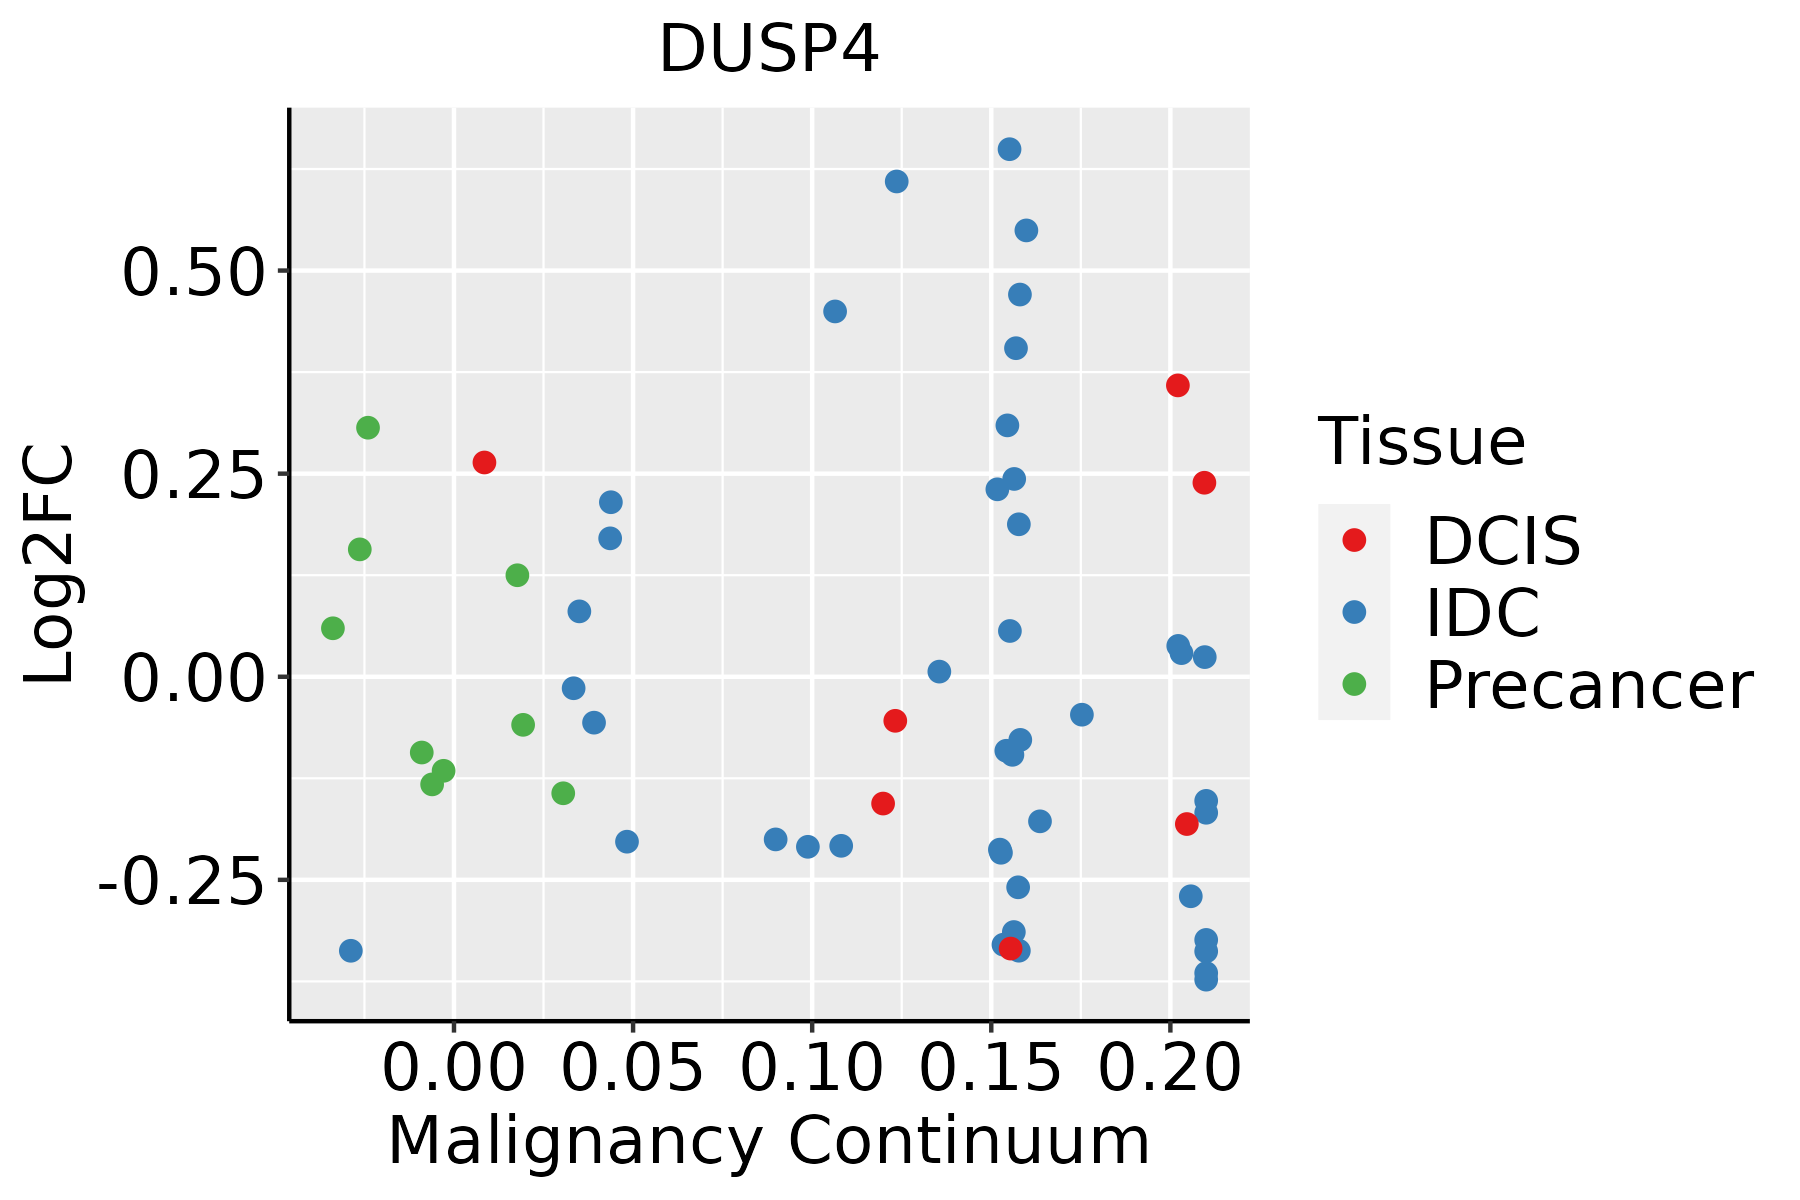 | IDC: Invasive ductal carcinoma |
| DCIS: Ductal carcinoma in situ | ||
| Precancer(BRCA1-mut): Precancerous lesion from BRCA1 mutation carriers | ||
| Esophagus |  | ESCC: Esophageal squamous cell carcinoma |
| HGIN: High-grade intraepithelial neoplasias | ||
| LGIN: Low-grade intraepithelial neoplasias | ||
| Oral Cavity | 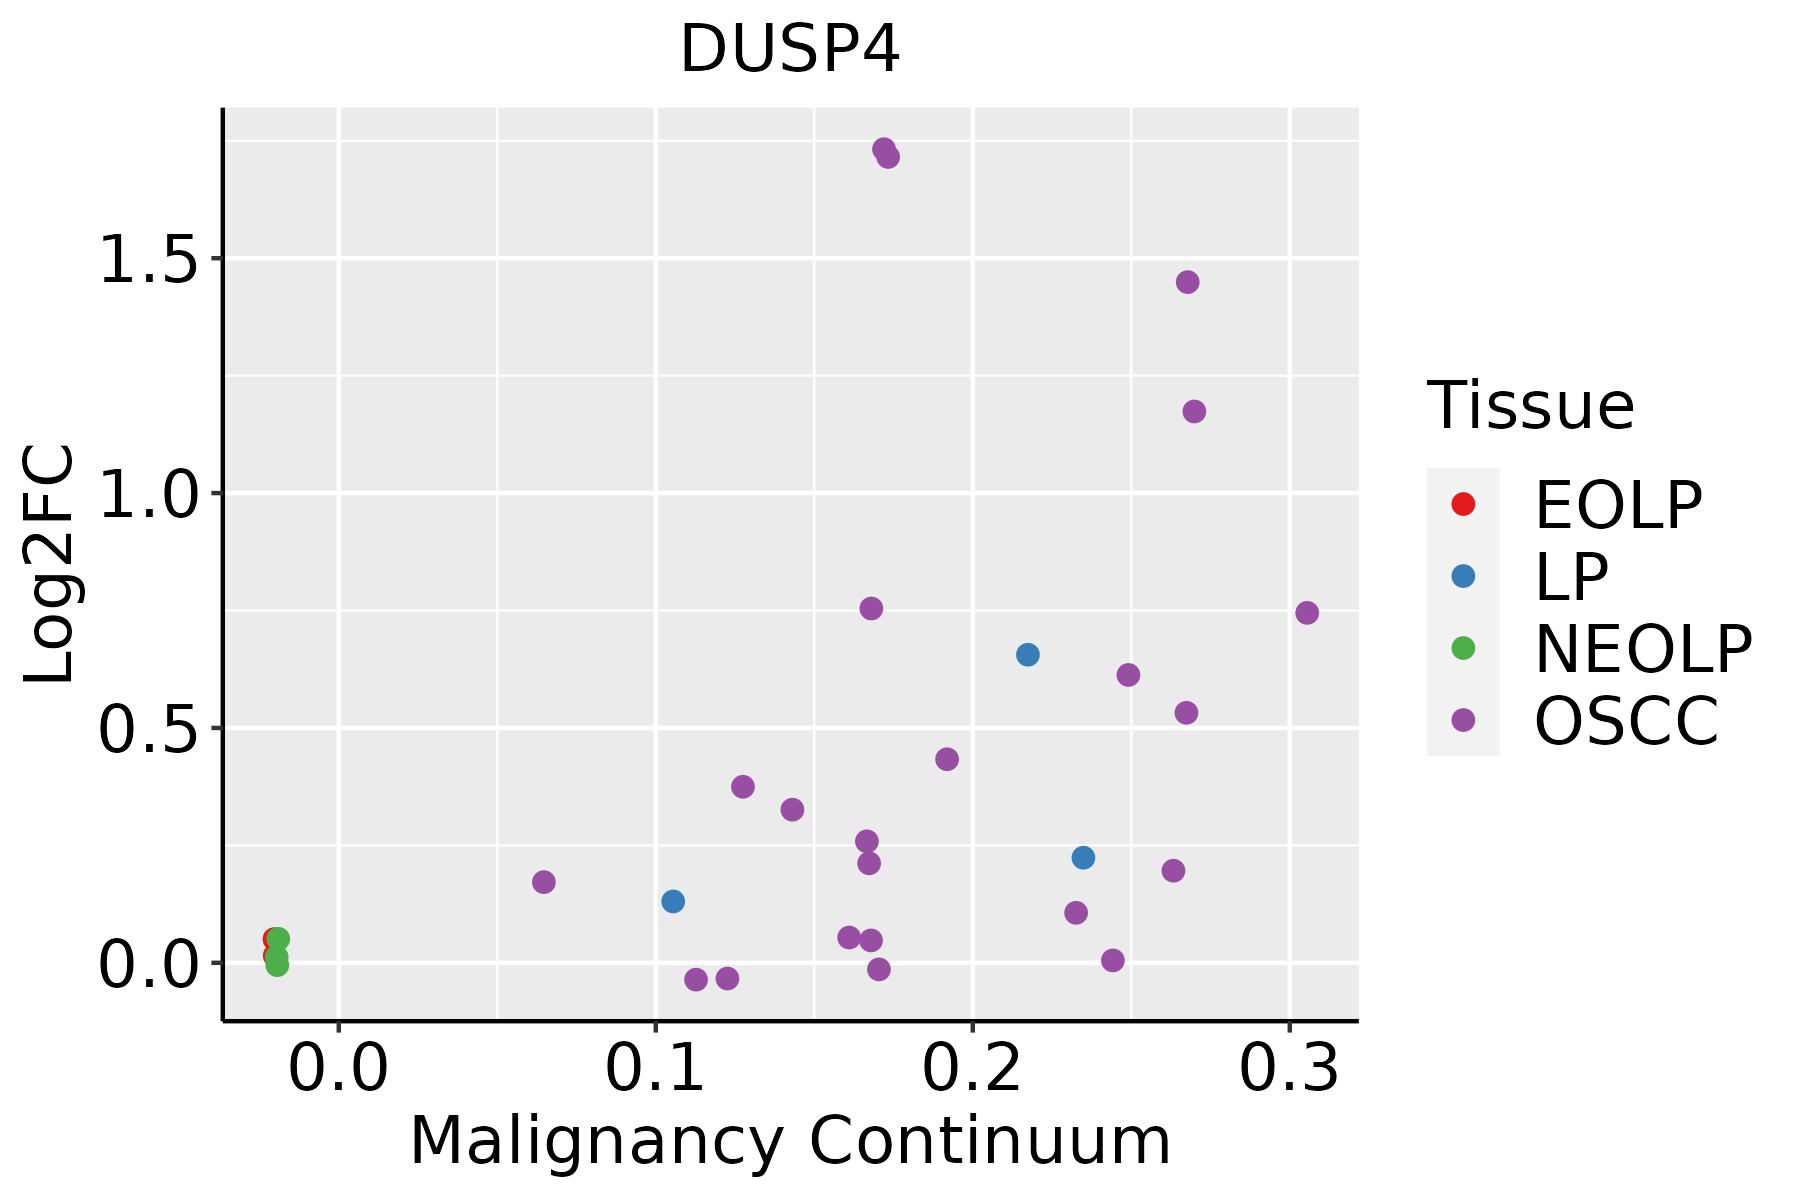 | EOLP: Erosive Oral lichen planus |
| LP: leukoplakia | ||
| NEOLP: Non-erosive oral lichen planus | ||
| OSCC: Oral squamous cell carcinoma | ||
| Thyroid | 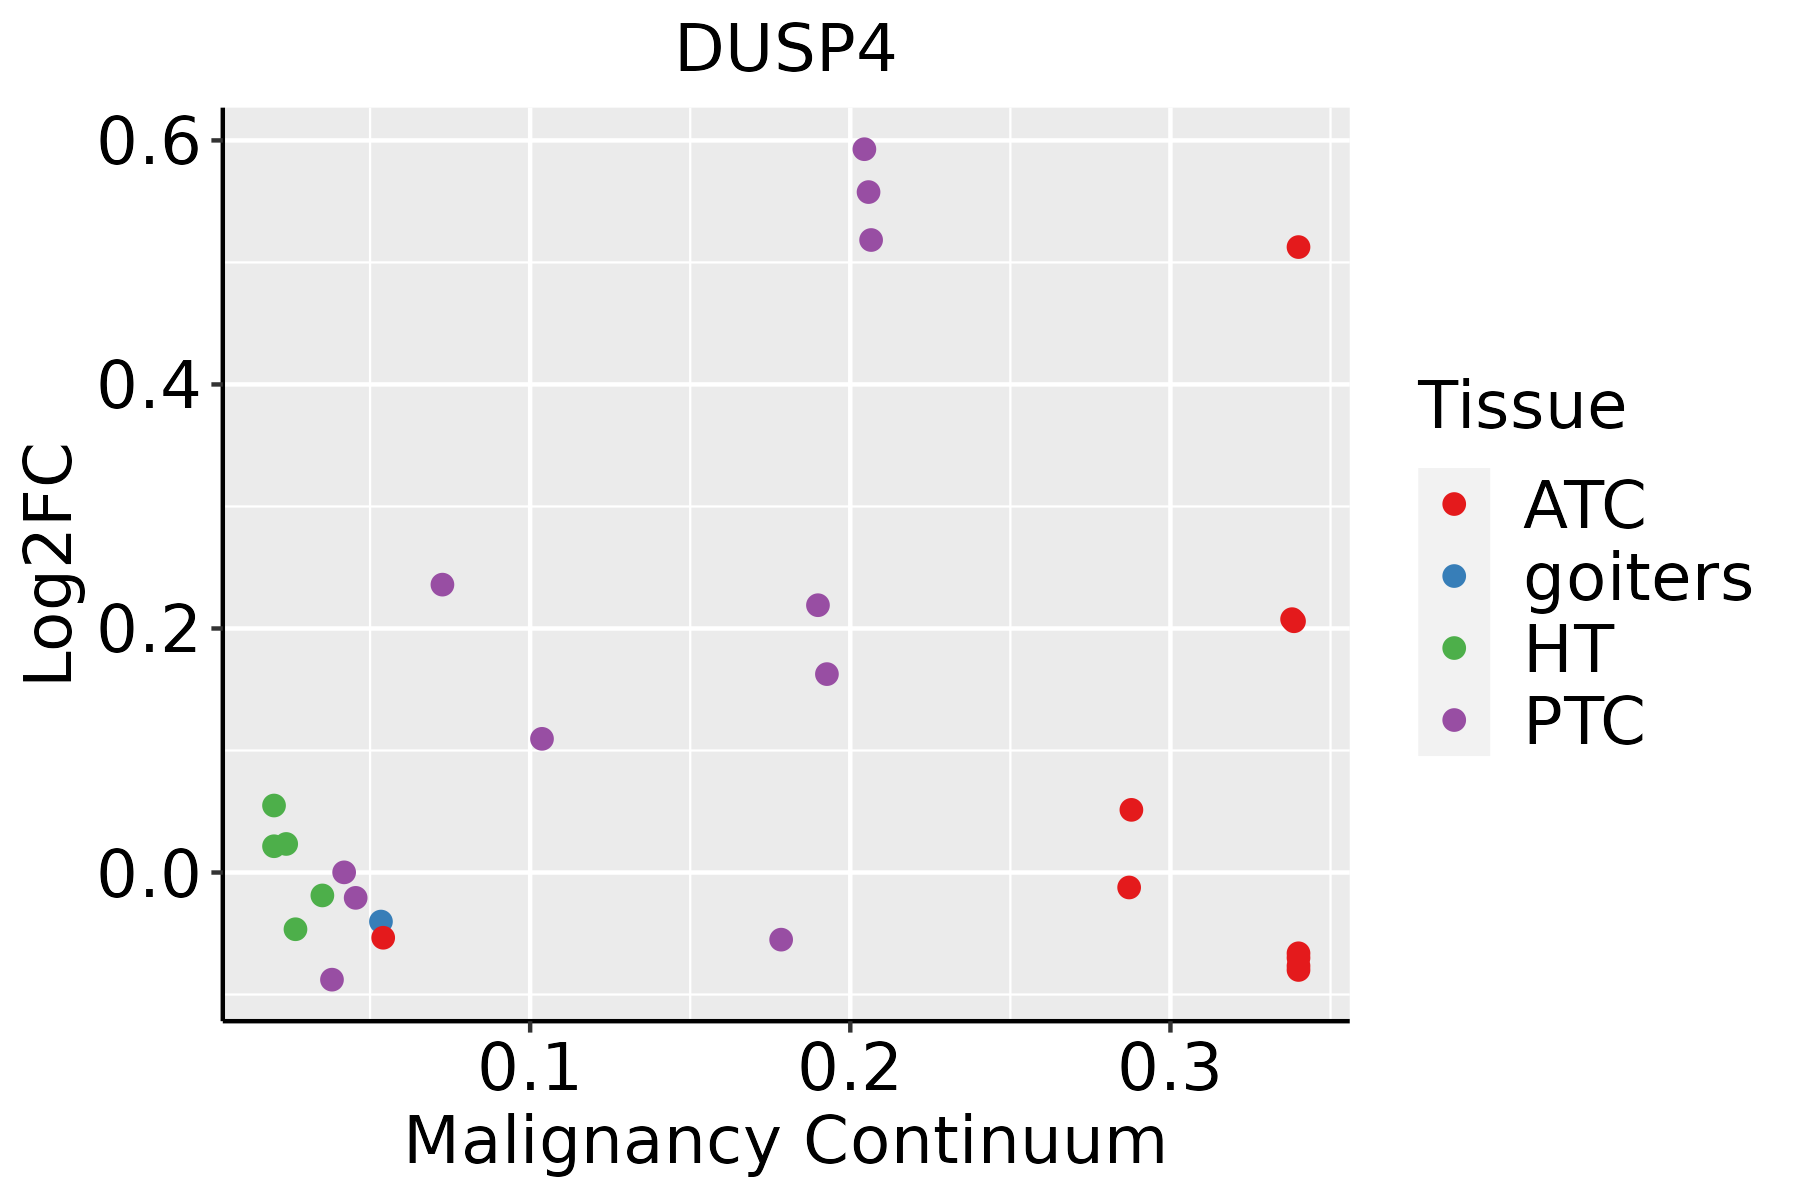 | ATC: Anaplastic thyroid cancer |
| HT: Hashimoto's thyroiditis | ||
| PTC: Papillary thyroid cancer |
| ∗log2FC in expression of this searched gene in stem-like cells from each diseased tissue sample relative to stem-like cells in normal samples in each tissue plotted against the malignancy continuum. Samples are colored based on if they are from different disease stage. |
Top |
Malignant transformation related pathway analysis |
| Find out the enriched GO biological processes and KEGG pathways involved in transition from healthy to precancer to cancer |
| Tissue | Disease Stage | Enriched GO biological Processes |
| Colorectum | AD |  |
| Colorectum | SER |  |
| Colorectum | MSS |  |
| Colorectum | MSI-H |  |
| Colorectum | FAP |  |
| ∗Top 15 enriched GO BP terms are showed in the bar plot of each disease state in each tissue. Each row represents a significant GO biological process which is colored according to the -log10(p.adjust). |
| Page: 1 2 3 4 5 6 7 8 9 |
| GO ID | Tissue | Disease Stage | Description | Gene Ratio | Bg Ratio | pvalue | p.adjust | Count |
| GO:00703713 | Breast | IDC | ERK1 and ERK2 cascade | 43/1434 | 330/18723 | 4.28e-04 | 5.84e-03 | 43 |
| GO:00703733 | Breast | IDC | negative regulation of ERK1 and ERK2 cascade | 14/1434 | 78/18723 | 2.21e-03 | 2.06e-02 | 14 |
| GO:00703722 | Breast | IDC | regulation of ERK1 and ERK2 cascade | 37/1434 | 309/18723 | 4.53e-03 | 3.49e-02 | 37 |
| GO:007037111 | Breast | DCIS | ERK1 and ERK2 cascade | 41/1390 | 330/18723 | 8.11e-04 | 9.32e-03 | 41 |
| GO:007037311 | Breast | DCIS | negative regulation of ERK1 and ERK2 cascade | 14/1390 | 78/18723 | 1.65e-03 | 1.64e-02 | 14 |
| GO:001631110 | Esophagus | ESCC | dephosphorylation | 251/8552 | 417/18723 | 1.26e-09 | 2.99e-08 | 251 |
| GO:00073698 | Esophagus | ESCC | gastrulation | 115/8552 | 185/18723 | 4.35e-06 | 4.64e-05 | 115 |
| GO:00074926 | Esophagus | ESCC | endoderm development | 54/8552 | 77/18723 | 1.20e-05 | 1.12e-04 | 54 |
| GO:00017064 | Esophagus | ESCC | endoderm formation | 38/8552 | 54/18723 | 2.08e-04 | 1.31e-03 | 38 |
| GO:00017044 | Esophagus | ESCC | formation of primary germ layer | 75/8552 | 121/18723 | 2.17e-04 | 1.36e-03 | 75 |
| GO:0043409110 | Esophagus | ESCC | negative regulation of MAPK cascade | 105/8552 | 180/18723 | 4.13e-04 | 2.35e-03 | 105 |
| GO:00163119 | Oral cavity | OSCC | dephosphorylation | 220/7305 | 417/18723 | 6.33e-09 | 1.34e-07 | 220 |
| GO:004340917 | Oral cavity | OSCC | negative regulation of MAPK cascade | 105/7305 | 180/18723 | 1.10e-07 | 1.87e-06 | 105 |
| GO:00074925 | Oral cavity | OSCC | endoderm development | 47/7305 | 77/18723 | 7.40e-05 | 5.81e-04 | 47 |
| GO:00017063 | Oral cavity | OSCC | endoderm formation | 34/7305 | 54/18723 | 3.12e-04 | 1.94e-03 | 34 |
| GO:00073697 | Oral cavity | OSCC | gastrulation | 95/7305 | 185/18723 | 4.17e-04 | 2.54e-03 | 95 |
| GO:00017043 | Oral cavity | OSCC | formation of primary germ layer | 65/7305 | 121/18723 | 7.08e-04 | 3.90e-03 | 65 |
| GO:00703735 | Oral cavity | OSCC | negative regulation of ERK1 and ERK2 cascade | 43/7305 | 78/18723 | 2.80e-03 | 1.22e-02 | 43 |
| GO:00703716 | Oral cavity | OSCC | ERK1 and ERK2 cascade | 150/7305 | 330/18723 | 9.47e-03 | 3.38e-02 | 150 |
| GO:00703724 | Oral cavity | OSCC | regulation of ERK1 and ERK2 cascade | 140/7305 | 309/18723 | 1.34e-02 | 4.46e-02 | 140 |
| Page: 1 2 |
| Pathway ID | Tissue | Disease Stage | Description | Gene Ratio | Bg Ratio | pvalue | p.adjust | qvalue | Count |
| hsa0401014 | Oral cavity | OSCC | MAPK signaling pathway | 165/3704 | 302/8465 | 7.11e-05 | 2.74e-04 | 1.40e-04 | 165 |
| hsa0401015 | Oral cavity | OSCC | MAPK signaling pathway | 165/3704 | 302/8465 | 7.11e-05 | 2.74e-04 | 1.40e-04 | 165 |
| Page: 1 |
Top |
Cell-cell communication analysis |
| Identification of potential cell-cell interactions between two cell types and their ligand-receptor pairs for different disease states |
| Ligand | Receptor | LRpair | Pathway | Tissue | Disease Stage |
| Page: 1 |
Top |
Single-cell gene regulatory network inference analysis |
| Find out the significant the regulons (TFs) and the target genes of each regulon across cell types for different disease states |
| TF | Cell Type | Tissue | Disease Stage | Target Gene | RSS | Regulon Activity |
| ∗The dot plots of a searched regulon are shown for all cell subpopulations in each disease state of each tissue based on the regulon specific score inferred using pySCENIC and by calculating the average expression. |
| Page: 1 |
Top |
Somatic mutation of malignant transformation related genes |
| Annotation of somatic variants for genes involved in malignant transformation |
| Hugo Symbol | Variant Class | Variant Classification | dbSNP RS | HGVSc | HGVSp | HGVSp Short | SWISSPROT | BIOTYPE | SIFT | PolyPhen | Tumor Sample Barcode | Tissue | Histology | Sex | Age | Stage | Therapy Types | Drugs | Outcome |
| DUSP4 | SNV | Missense_Mutation | novel | c.1181N>C | p.Cys394Ser | p.C394S | Q13115 | protein_coding | deleterious(0) | probably_damaging(0.997) | TCGA-AC-A23H-01 | Breast | breast invasive carcinoma | Female | >=65 | I/II | Unknown | Unknown | PD |
| DUSP4 | SNV | Missense_Mutation | novel | c.719N>T | p.Tyr240Phe | p.Y240F | Q13115 | protein_coding | tolerated(0.35) | benign(0.232) | TCGA-E2-A573-01 | Breast | breast invasive carcinoma | Female | <65 | I/II | Chemotherapy | taxotere | CR |
| DUSP4 | insertion | Nonsense_Mutation | novel | c.985_986insGACGAGGCCAGCCAGAATGGCAATAAGGACTCCGAAT | p.Gln329ArgfsTer9 | p.Q329Rfs*9 | Q13115 | protein_coding | TCGA-A8-A0A2-01 | Breast | breast invasive carcinoma | Female | >=65 | I/II | Hormone Therapy | tamoxiphen | SD | ||
| DUSP4 | SNV | Missense_Mutation | rs375453930 | c.823N>T | p.Arg275Cys | p.R275C | Q13115 | protein_coding | deleterious(0) | probably_damaging(0.998) | TCGA-2W-A8YY-01 | Cervix | cervical & endocervical cancer | Female | <65 | I/II | Chemotherapy | cisplatin | CR |
| DUSP4 | SNV | Missense_Mutation | c.662N>T | p.Gly221Val | p.G221V | Q13115 | protein_coding | deleterious(0) | probably_damaging(0.997) | TCGA-A6-6648-01 | Colorectum | colon adenocarcinoma | Male | <65 | I/II | Chemotherapy | oxaliplatin | PD | |
| DUSP4 | SNV | Missense_Mutation | rs375453930 | c.823C>T | p.Arg275Cys | p.R275C | Q13115 | protein_coding | deleterious(0) | probably_damaging(0.998) | TCGA-AA-3864-01 | Colorectum | colon adenocarcinoma | Male | >=65 | I/II | Unknown | Unknown | SD |
| DUSP4 | SNV | Missense_Mutation | rs774219516 | c.471C>A | p.Phe157Leu | p.F157L | Q13115 | protein_coding | tolerated(1) | benign(0) | TCGA-AA-A00N-01 | Colorectum | colon adenocarcinoma | Male | >=65 | I/II | Unknown | Unknown | PD |
| DUSP4 | SNV | Missense_Mutation | novel | c.450T>G | p.Phe150Leu | p.F150L | Q13115 | protein_coding | deleterious(0) | probably_damaging(0.978) | TCGA-AA-A010-01 | Colorectum | colon adenocarcinoma | Female | <65 | I/II | Chemotherapy | folinic | CR |
| DUSP4 | SNV | Missense_Mutation | rs375453930 | c.823N>T | p.Arg275Cys | p.R275C | Q13115 | protein_coding | deleterious(0) | probably_damaging(0.998) | TCGA-AD-6964-01 | Colorectum | colon adenocarcinoma | Male | <65 | III/IV | Chemotherapy | folfox | PD |
| DUSP4 | SNV | Missense_Mutation | c.62G>A | p.Arg21Gln | p.R21Q | Q13115 | protein_coding | tolerated(0.26) | benign(0.072) | TCGA-G4-6320-01 | Colorectum | colon adenocarcinoma | Male | >=65 | III/IV | Chemotherapy | oxaliplatin | SD |
| Page: 1 2 3 4 |
Top |
Related drugs of malignant transformation related genes |
| Identification of chemicals and drugs interact with genes involved in malignant transfromation |
| (DGIdb 4.0) |
| Entrez ID | Symbol | Category | Interaction Types | Drug Claim Name | Drug Name | PMIDs |
| Page: 1 |

Copyright 2023-Present -The University of Texas Health Science Center at Houston |