
|
|||||
|
 | |
| |
| |
| |
| |
| |
|
Gene: DUSP22 |
Gene summary for DUSP22 |
| Gene information | Species | Human | Gene symbol | DUSP22 | Gene ID | 56940 |
| Gene name | dual specificity phosphatase 22 | |
| Gene Alias | JKAP | |
| Cytomap | 6p25.3 | |
| Gene Type | protein-coding | GO ID | GO:0000122 | UniProtAcc | Q9NRW4 |
Top |
Malignant transformation analysis |
| Identification of the aberrant gene expression in precancerous and cancerous lesions by comparing the gene expression of stem-like cells in diseased tissues with normal stem cells |
| Entrez ID | Symbol | Replicates | Species | Organ | Tissue | Adj P-value | Log2FC | Malignancy |
| 56940 | DUSP22 | LZE8T | Human | Esophagus | ESCC | 1.31e-02 | 1.67e-01 | 0.067 |
| 56940 | DUSP22 | LZE20T | Human | Esophagus | ESCC | 4.56e-05 | 3.24e-01 | 0.0662 |
| 56940 | DUSP22 | LZE24T | Human | Esophagus | ESCC | 4.71e-12 | 4.18e-01 | 0.0596 |
| 56940 | DUSP22 | LZE6T | Human | Esophagus | ESCC | 4.32e-05 | 2.60e-01 | 0.0845 |
| 56940 | DUSP22 | P1T-E | Human | Esophagus | ESCC | 1.62e-05 | 4.44e-01 | 0.0875 |
| 56940 | DUSP22 | P2T-E | Human | Esophagus | ESCC | 6.13e-22 | 4.13e-01 | 0.1177 |
| 56940 | DUSP22 | P4T-E | Human | Esophagus | ESCC | 3.15e-17 | 4.58e-01 | 0.1323 |
| 56940 | DUSP22 | P5T-E | Human | Esophagus | ESCC | 3.63e-08 | 1.86e-01 | 0.1327 |
| 56940 | DUSP22 | P8T-E | Human | Esophagus | ESCC | 1.59e-12 | 2.21e-01 | 0.0889 |
| 56940 | DUSP22 | P9T-E | Human | Esophagus | ESCC | 8.65e-03 | 1.36e-01 | 0.1131 |
| 56940 | DUSP22 | P10T-E | Human | Esophagus | ESCC | 2.72e-05 | 1.44e-02 | 0.116 |
| 56940 | DUSP22 | P11T-E | Human | Esophagus | ESCC | 4.74e-06 | 6.29e-01 | 0.1426 |
| 56940 | DUSP22 | P12T-E | Human | Esophagus | ESCC | 1.77e-09 | 1.78e-01 | 0.1122 |
| 56940 | DUSP22 | P15T-E | Human | Esophagus | ESCC | 9.22e-14 | 2.65e-01 | 0.1149 |
| 56940 | DUSP22 | P16T-E | Human | Esophagus | ESCC | 2.46e-15 | 2.09e-01 | 0.1153 |
| 56940 | DUSP22 | P17T-E | Human | Esophagus | ESCC | 4.15e-07 | 5.56e-01 | 0.1278 |
| 56940 | DUSP22 | P20T-E | Human | Esophagus | ESCC | 2.27e-12 | 2.97e-01 | 0.1124 |
| 56940 | DUSP22 | P21T-E | Human | Esophagus | ESCC | 3.85e-35 | 6.09e-01 | 0.1617 |
| 56940 | DUSP22 | P22T-E | Human | Esophagus | ESCC | 3.80e-14 | 2.06e-01 | 0.1236 |
| 56940 | DUSP22 | P23T-E | Human | Esophagus | ESCC | 2.23e-12 | 3.96e-01 | 0.108 |
| Page: 1 2 3 4 5 |
| Tissue | Expression Dynamics | Abbreviation |
| Esophagus | 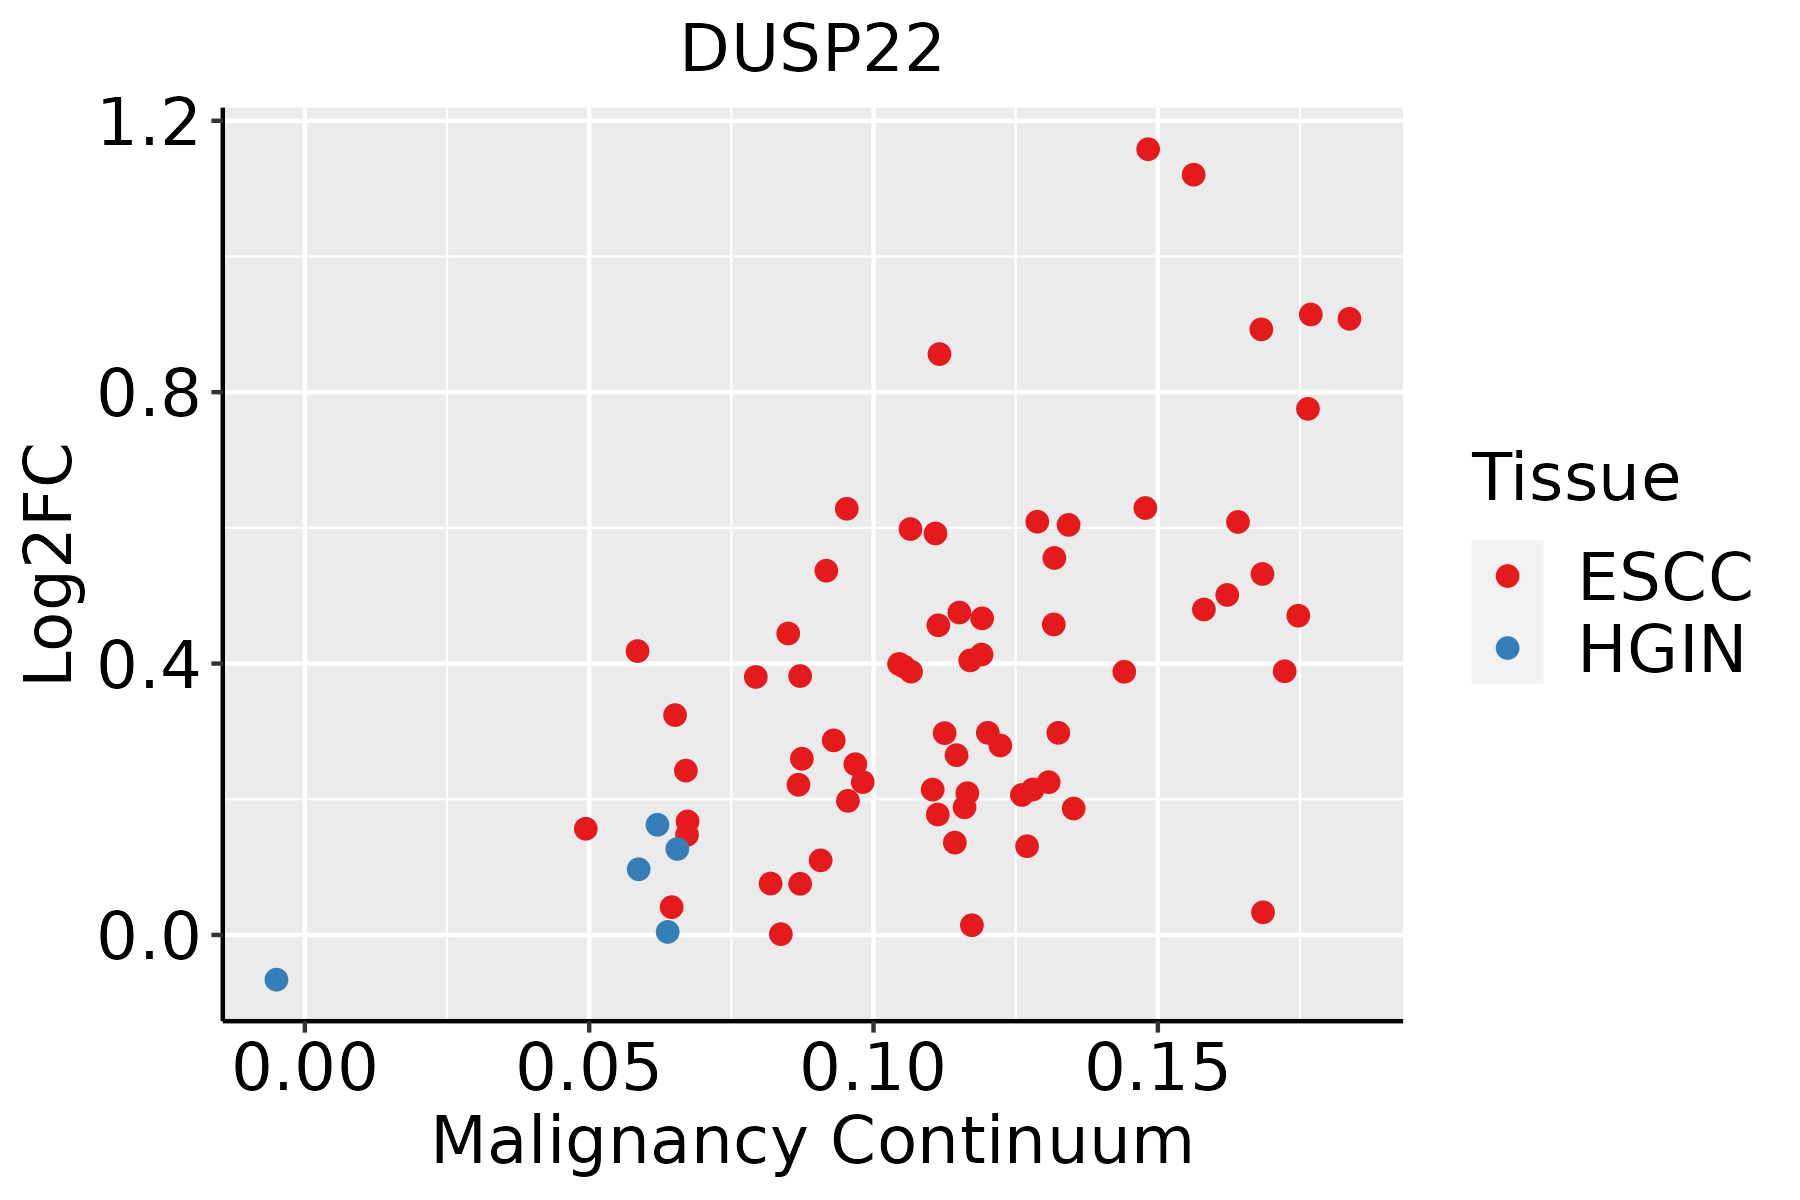 | ESCC: Esophageal squamous cell carcinoma |
| HGIN: High-grade intraepithelial neoplasias | ||
| LGIN: Low-grade intraepithelial neoplasias | ||
| Liver | 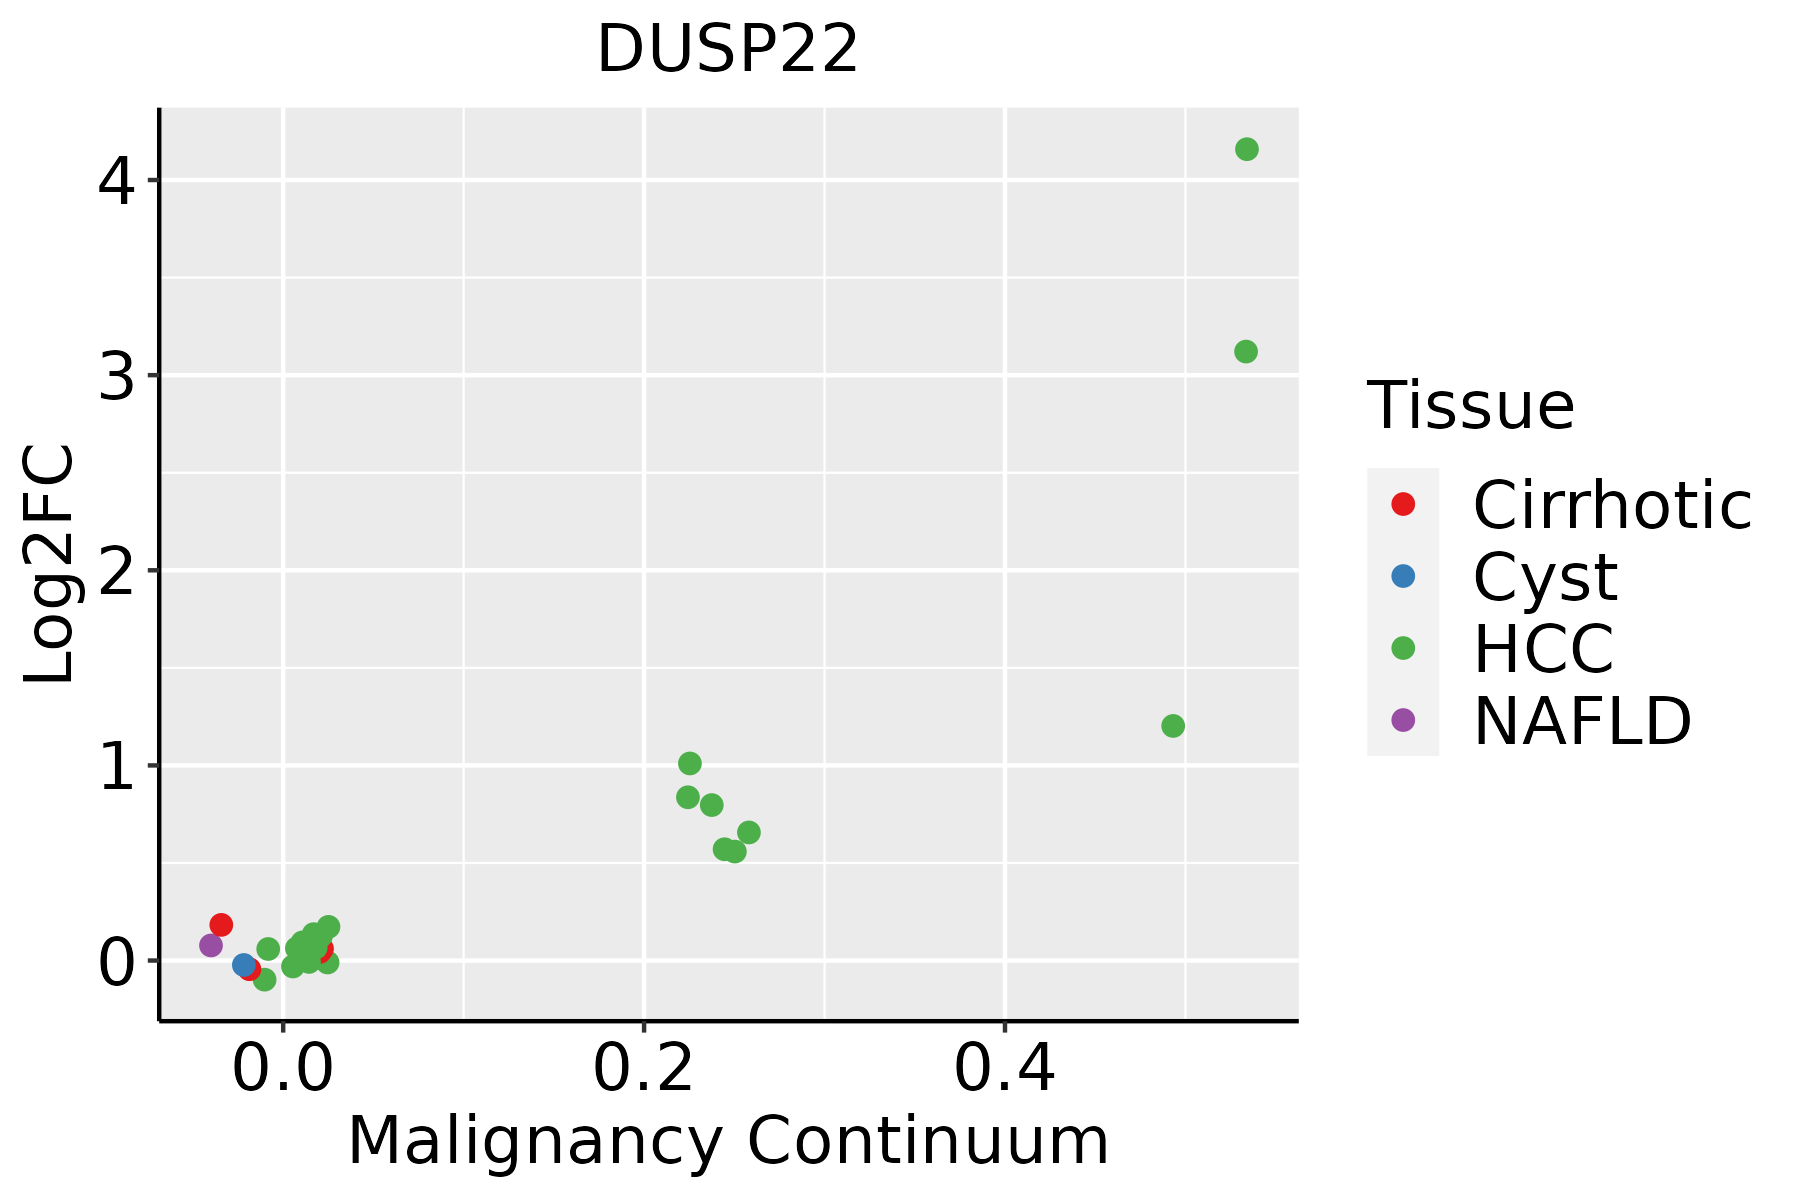 | HCC: Hepatocellular carcinoma |
| NAFLD: Non-alcoholic fatty liver disease | ||
| Oral Cavity | 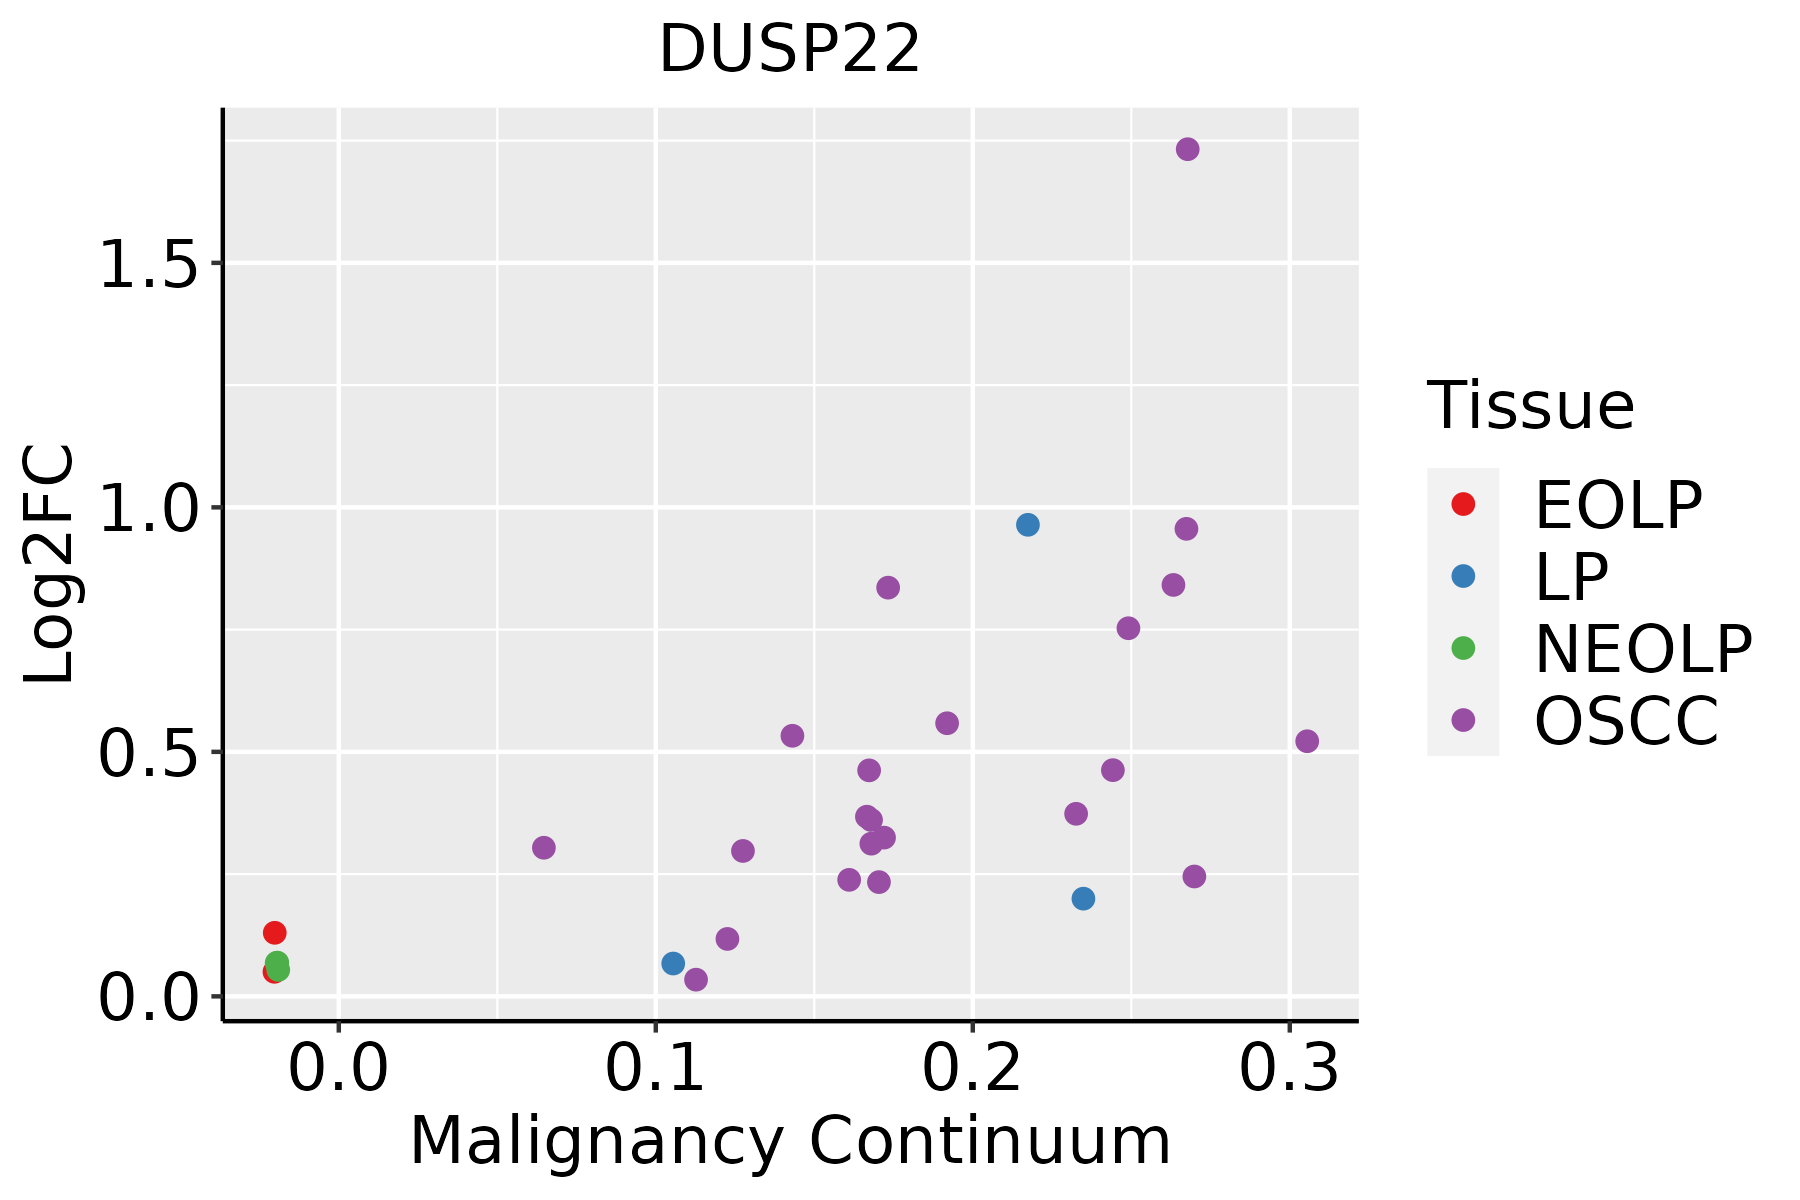 | EOLP: Erosive Oral lichen planus |
| LP: leukoplakia | ||
| NEOLP: Non-erosive oral lichen planus | ||
| OSCC: Oral squamous cell carcinoma | ||
| Skin | 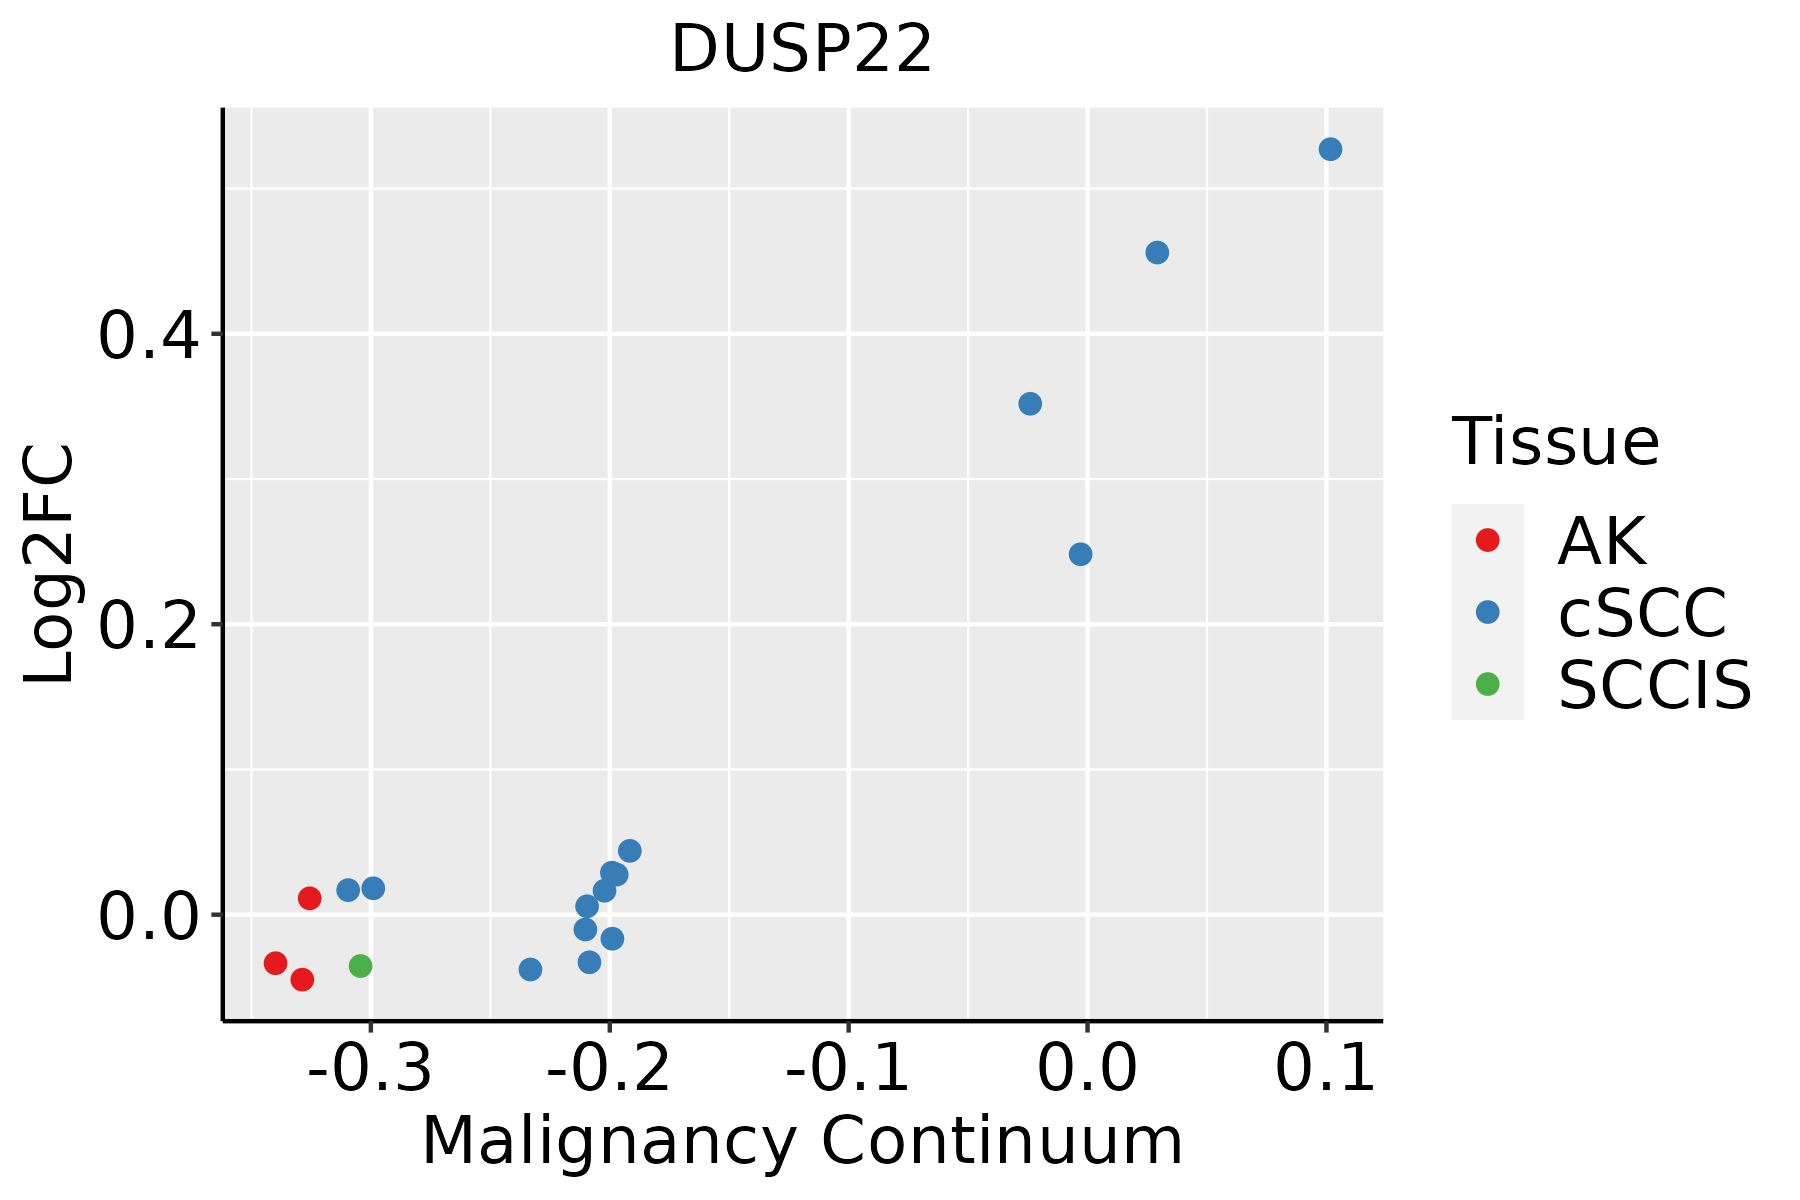 | AK: Actinic keratosis |
| cSCC: Cutaneous squamous cell carcinoma | ||
| SCCIS:squamous cell carcinoma in situ |
| ∗log2FC in expression of this searched gene in stem-like cells from each diseased tissue sample relative to stem-like cells in normal samples in each tissue plotted against the malignancy continuum. Samples are colored based on if they are from different disease stage. |
Top |
Malignant transformation related pathway analysis |
| Find out the enriched GO biological processes and KEGG pathways involved in transition from healthy to precancer to cancer |
| Tissue | Disease Stage | Enriched GO biological Processes |
| Colorectum | AD |  |
| Colorectum | SER |  |
| Colorectum | MSS |  |
| Colorectum | MSI-H |  |
| Colorectum | FAP |  |
| ∗Top 15 enriched GO BP terms are showed in the bar plot of each disease state in each tissue. Each row represents a significant GO biological process which is colored according to the -log10(p.adjust). |
| Page: 1 2 3 4 5 6 7 8 9 |
| GO ID | Tissue | Disease Stage | Description | Gene Ratio | Bg Ratio | pvalue | p.adjust | Count |
| GO:0010563111 | Esophagus | ESCC | negative regulation of phosphorus metabolic process | 274/8552 | 442/18723 | 2.32e-12 | 9.41e-11 | 274 |
| GO:0045936111 | Esophagus | ESCC | negative regulation of phosphate metabolic process | 273/8552 | 441/18723 | 3.18e-12 | 1.25e-10 | 273 |
| GO:0051348111 | Esophagus | ESCC | negative regulation of transferase activity | 177/8552 | 268/18723 | 1.08e-11 | 4.00e-10 | 177 |
| GO:0042326111 | Esophagus | ESCC | negative regulation of phosphorylation | 237/8552 | 385/18723 | 1.86e-10 | 5.33e-09 | 237 |
| GO:0150115110 | Esophagus | ESCC | cell-substrate junction organization | 77/8552 | 101/18723 | 3.46e-10 | 9.57e-09 | 77 |
| GO:0001933111 | Esophagus | ESCC | negative regulation of protein phosphorylation | 213/8552 | 342/18723 | 3.54e-10 | 9.76e-09 | 213 |
| GO:000704418 | Esophagus | ESCC | cell-substrate junction assembly | 73/8552 | 95/18723 | 5.27e-10 | 1.35e-08 | 73 |
| GO:001631110 | Esophagus | ESCC | dephosphorylation | 251/8552 | 417/18723 | 1.26e-09 | 2.99e-08 | 251 |
| GO:003367319 | Esophagus | ESCC | negative regulation of kinase activity | 154/8552 | 237/18723 | 1.38e-09 | 3.27e-08 | 154 |
| GO:000646920 | Esophagus | ESCC | negative regulation of protein kinase activity | 140/8552 | 212/18723 | 1.53e-09 | 3.56e-08 | 140 |
| GO:003158919 | Esophagus | ESCC | cell-substrate adhesion | 221/8552 | 363/18723 | 3.06e-09 | 6.62e-08 | 221 |
| GO:000647018 | Esophagus | ESCC | protein dephosphorylation | 177/8552 | 281/18723 | 3.13e-09 | 6.72e-08 | 177 |
| GO:001081020 | Esophagus | ESCC | regulation of cell-substrate adhesion | 144/8552 | 221/18723 | 3.55e-09 | 7.45e-08 | 144 |
| GO:004804116 | Esophagus | ESCC | focal adhesion assembly | 65/8552 | 87/18723 | 3.28e-08 | 6.08e-07 | 65 |
| GO:003109818 | Esophagus | ESCC | stress-activated protein kinase signaling cascade | 154/8552 | 247/18723 | 8.53e-08 | 1.44e-06 | 154 |
| GO:00715599 | Esophagus | ESCC | response to transforming growth factor beta | 157/8552 | 256/18723 | 2.95e-07 | 4.23e-06 | 157 |
| GO:005140318 | Esophagus | ESCC | stress-activated MAPK cascade | 147/8552 | 239/18723 | 5.43e-07 | 7.18e-06 | 147 |
| GO:000195217 | Esophagus | ESCC | regulation of cell-matrix adhesion | 85/8552 | 128/18723 | 1.70e-06 | 2.02e-05 | 85 |
| GO:00715609 | Esophagus | ESCC | cellular response to transforming growth factor beta stimulus | 151/8552 | 250/18723 | 1.78e-06 | 2.10e-05 | 151 |
| GO:000716018 | Esophagus | ESCC | cell-matrix adhesion | 141/8552 | 233/18723 | 3.33e-06 | 3.71e-05 | 141 |
| Page: 1 2 3 4 5 6 7 8 9 |
| Pathway ID | Tissue | Disease Stage | Description | Gene Ratio | Bg Ratio | pvalue | p.adjust | qvalue | Count |
| Page: 1 |
Top |
Cell-cell communication analysis |
| Identification of potential cell-cell interactions between two cell types and their ligand-receptor pairs for different disease states |
| Ligand | Receptor | LRpair | Pathway | Tissue | Disease Stage |
| Page: 1 |
Top |
Single-cell gene regulatory network inference analysis |
| Find out the significant the regulons (TFs) and the target genes of each regulon across cell types for different disease states |
| TF | Cell Type | Tissue | Disease Stage | Target Gene | RSS | Regulon Activity |
| ∗The dot plots of a searched regulon are shown for all cell subpopulations in each disease state of each tissue based on the regulon specific score inferred using pySCENIC and by calculating the average expression. |
| Page: 1 |
Top |
Somatic mutation of malignant transformation related genes |
| Annotation of somatic variants for genes involved in malignant transformation |
| Hugo Symbol | Variant Class | Variant Classification | dbSNP RS | HGVSc | HGVSp | HGVSp Short | SWISSPROT | BIOTYPE | SIFT | PolyPhen | Tumor Sample Barcode | Tissue | Histology | Sex | Age | Stage | Therapy Types | Drugs | Outcome |
| DUSP22 | SNV | Missense_Mutation | novel | c.272N>C | p.Gly91Ala | p.G91A | Q9NRW4 | protein_coding | deleterious(0) | probably_damaging(1) | TCGA-AC-A5EH-01 | Breast | breast invasive carcinoma | Female | >=65 | I/II | Unknown | Unknown | SD |
| DUSP22 | SNV | Missense_Mutation | novel | c.568N>A | p.Phe190Ile | p.F190I | Q9NRW4 | protein_coding | tolerated(0.27) | benign(0.013) | TCGA-BH-A0BW-01 | Breast | breast invasive carcinoma | Female | >=65 | I/II | Chemotherapy | adriamycin | CR |
| DUSP22 | SNV | Missense_Mutation | c.212N>A | p.Ile71Asn | p.I71N | Q9NRW4 | protein_coding | tolerated(0.2) | probably_damaging(0.948) | TCGA-C8-A135-01 | Breast | breast invasive carcinoma | Female | <65 | I/II | Chemotherapy | 5-fluorouracil | CR | |
| DUSP22 | SNV | Missense_Mutation | rs772626114 | c.529N>T | p.Arg177Cys | p.R177C | Q9NRW4 | protein_coding | deleterious(0.01) | possibly_damaging(0.491) | TCGA-E2-A14P-01 | Breast | breast invasive carcinoma | Female | >=65 | III/IV | Targeted Molecular therapy | trastuzumab | SD |
| DUSP22 | insertion | Nonsense_Mutation | novel | c.432_433insTCTAGGAATTAATACTTCATA | p.His144_Gln145insSerArgAsnTerTyrPheIle | p.H144_Q145insSRN*YFI | Q9NRW4 | protein_coding | TCGA-B6-A0IA-01 | Breast | breast invasive carcinoma | Female | <65 | I/II | Unknown | Unknown | SD | ||
| DUSP22 | SNV | Missense_Mutation | rs768192099 | c.301N>A | p.Ala101Thr | p.A101T | Q9NRW4 | protein_coding | deleterious(0) | probably_damaging(0.999) | TCGA-A6-3809-01 | Colorectum | colon adenocarcinoma | Female | >=65 | I/II | Unknown | Unknown | SD |
| DUSP22 | SNV | Missense_Mutation | c.563N>T | p.Ser188Ile | p.S188I | Q9NRW4 | protein_coding | tolerated(0.18) | benign(0.006) | TCGA-AA-3713-01 | Colorectum | colon adenocarcinoma | Male | >=65 | III/IV | Chemotherapy | 5-fluorouracil | PR | |
| DUSP22 | SNV | Missense_Mutation | c.149N>G | p.Tyr50Cys | p.Y50C | Q9NRW4 | protein_coding | deleterious(0) | probably_damaging(0.973) | TCGA-AA-3715-01 | Colorectum | colon adenocarcinoma | Male | >=65 | I/II | Unknown | Unknown | PD | |
| DUSP22 | SNV | Missense_Mutation | c.82A>G | p.Lys28Glu | p.K28E | Q9NRW4 | protein_coding | tolerated(0.07) | benign(0.003) | TCGA-AA-A02E-01 | Colorectum | colon adenocarcinoma | Female | >=65 | III/IV | Unknown | Unknown | PD | |
| DUSP22 | SNV | Missense_Mutation | rs772626114 | c.529N>T | p.Arg177Cys | p.R177C | Q9NRW4 | protein_coding | deleterious(0.01) | possibly_damaging(0.491) | TCGA-AD-6889-01 | Colorectum | colon adenocarcinoma | Male | >=65 | I/II | Chemotherapy | xeloda | PD |
| Page: 1 2 3 4 5 6 7 |
Top |
Related drugs of malignant transformation related genes |
| Identification of chemicals and drugs interact with genes involved in malignant transfromation |
| (DGIdb 4.0) |
| Entrez ID | Symbol | Category | Interaction Types | Drug Claim Name | Drug Name | PMIDs |
| Page: 1 |

Copyright 2023-Present -The University of Texas Health Science Center at Houston |