
|
|||||
|
 | |
| |
| |
| |
| |
| |
|
Gene: DUSP2 |
Gene summary for DUSP2 |
| Gene information | Species | Human | Gene symbol | DUSP2 | Gene ID | 1844 |
| Gene name | dual specificity phosphatase 2 | |
| Gene Alias | PAC-1 | |
| Cytomap | 2q11.2 | |
| Gene Type | protein-coding | GO ID | GO:0000165 | UniProtAcc | Q05923 |
Top |
Malignant transformation analysis |
| Identification of the aberrant gene expression in precancerous and cancerous lesions by comparing the gene expression of stem-like cells in diseased tissues with normal stem cells |
| Entrez ID | Symbol | Replicates | Species | Organ | Tissue | Adj P-value | Log2FC | Malignancy |
| 1844 | DUSP2 | HSIL_HPV_1 | Human | Cervix | HSIL_HPV | 3.26e-06 | -4.81e-01 | 0.0116 |
| 1844 | DUSP2 | HSIL_HPV_2 | Human | Cervix | HSIL_HPV | 2.25e-16 | -5.47e-01 | 0.0208 |
| 1844 | DUSP2 | N_HPV_2 | Human | Cervix | N_HPV | 1.54e-06 | 2.16e-01 | -0.0131 |
| 1844 | DUSP2 | CCI_1 | Human | Cervix | CC | 1.38e-04 | -5.98e-01 | 0.528 |
| 1844 | DUSP2 | CCI_2 | Human | Cervix | CC | 4.51e-04 | -5.98e-01 | 0.5249 |
| 1844 | DUSP2 | CCI_3 | Human | Cervix | CC | 1.19e-06 | -5.98e-01 | 0.516 |
| 1844 | DUSP2 | CCII_1 | Human | Cervix | CC | 3.49e-06 | -5.64e-01 | 0.3249 |
| 1844 | DUSP2 | Tumor | Human | Cervix | CC | 2.65e-13 | -5.43e-01 | 0.1241 |
| 1844 | DUSP2 | sample3 | Human | Cervix | CC | 1.67e-17 | -5.40e-01 | 0.1387 |
| 1844 | DUSP2 | H2 | Human | Cervix | HSIL_HPV | 6.16e-09 | -4.62e-01 | 0.0632 |
| 1844 | DUSP2 | L1 | Human | Cervix | CC | 3.30e-04 | -4.86e-01 | 0.0802 |
| 1844 | DUSP2 | T3 | Human | Cervix | CC | 1.19e-13 | -5.14e-01 | 0.1389 |
| 1844 | DUSP2 | LZE20T | Human | Esophagus | ESCC | 7.26e-07 | 1.34e+00 | 0.0662 |
| 1844 | DUSP2 | LZE22T | Human | Esophagus | ESCC | 3.51e-08 | 2.06e+00 | 0.068 |
| 1844 | DUSP2 | LZE24D1 | Human | Esophagus | HGIN | 1.28e-05 | 1.62e+00 | 0.054 |
| 1844 | DUSP2 | LZE24T | Human | Esophagus | ESCC | 1.70e-08 | 9.14e-01 | 0.0596 |
| 1844 | DUSP2 | LZE21T | Human | Esophagus | ESCC | 3.65e-07 | 2.21e+00 | 0.0655 |
| 1844 | DUSP2 | LZE6T | Human | Esophagus | ESCC | 2.84e-03 | 8.90e-02 | 0.0845 |
| 1844 | DUSP2 | P1T-E | Human | Esophagus | ESCC | 1.14e-08 | 1.56e+00 | 0.0875 |
| 1844 | DUSP2 | P2T-E | Human | Esophagus | ESCC | 1.44e-48 | 2.09e+00 | 0.1177 |
| Page: 1 2 3 4 5 6 |
| Tissue | Expression Dynamics | Abbreviation |
| Cervix | 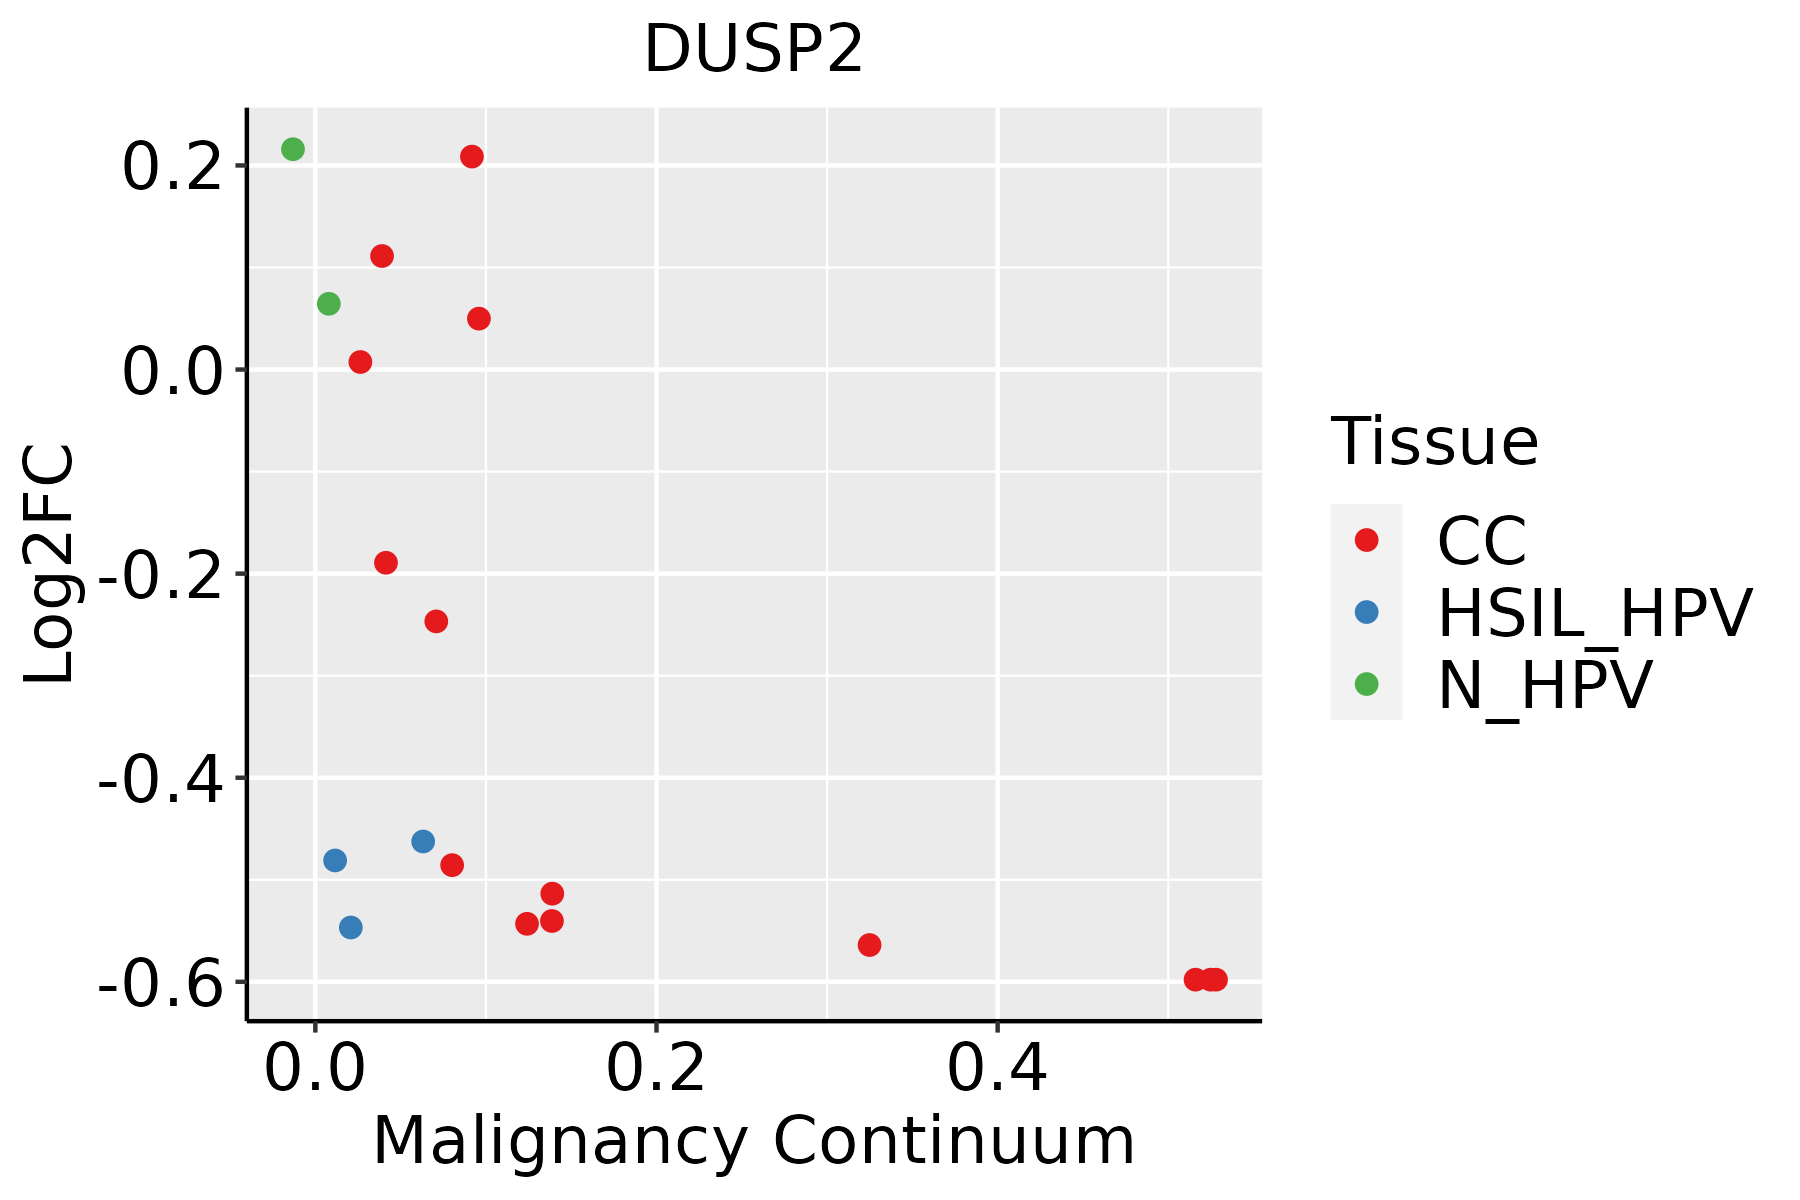 | CC: Cervix cancer |
| HSIL_HPV: HPV-infected high-grade squamous intraepithelial lesions | ||
| N_HPV: HPV-infected normal cervix | ||
| Esophagus | 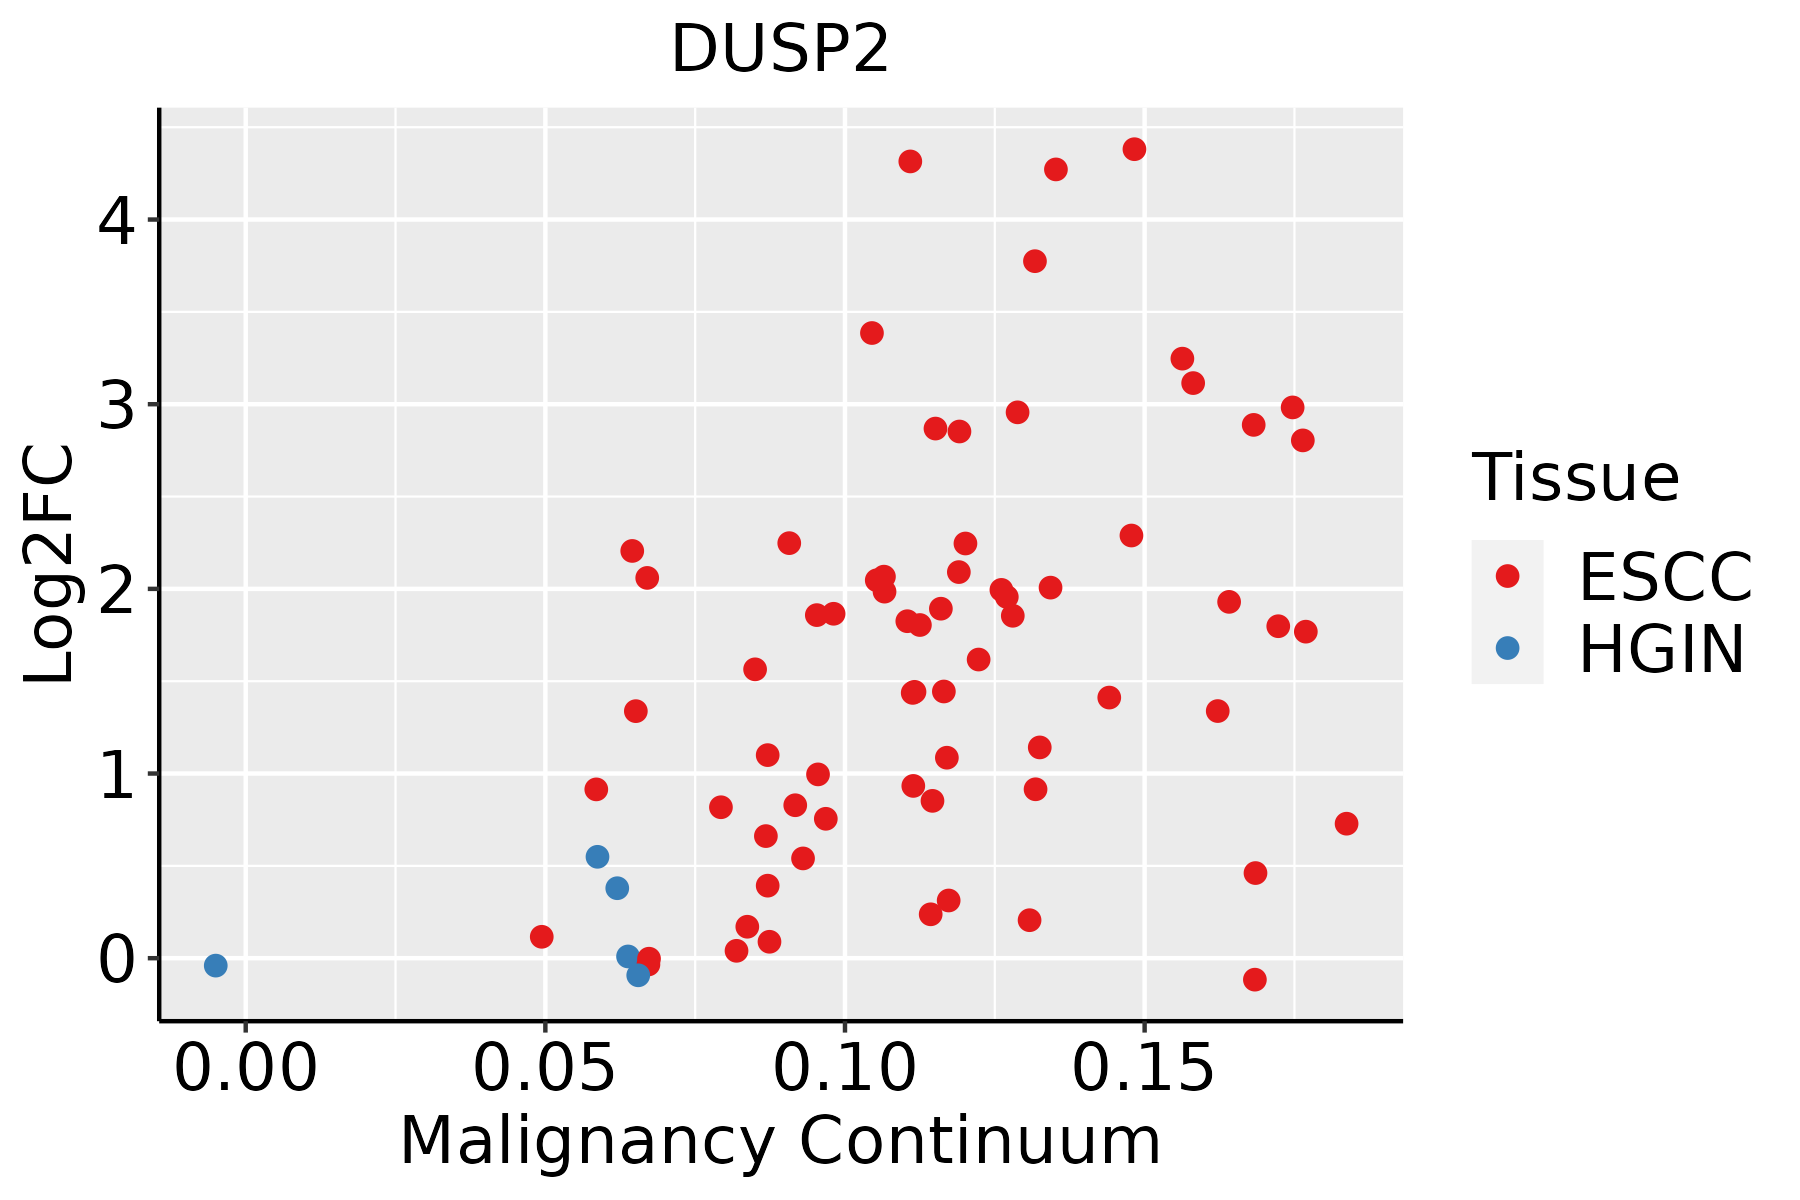 | ESCC: Esophageal squamous cell carcinoma |
| HGIN: High-grade intraepithelial neoplasias | ||
| LGIN: Low-grade intraepithelial neoplasias | ||
| Oral Cavity | 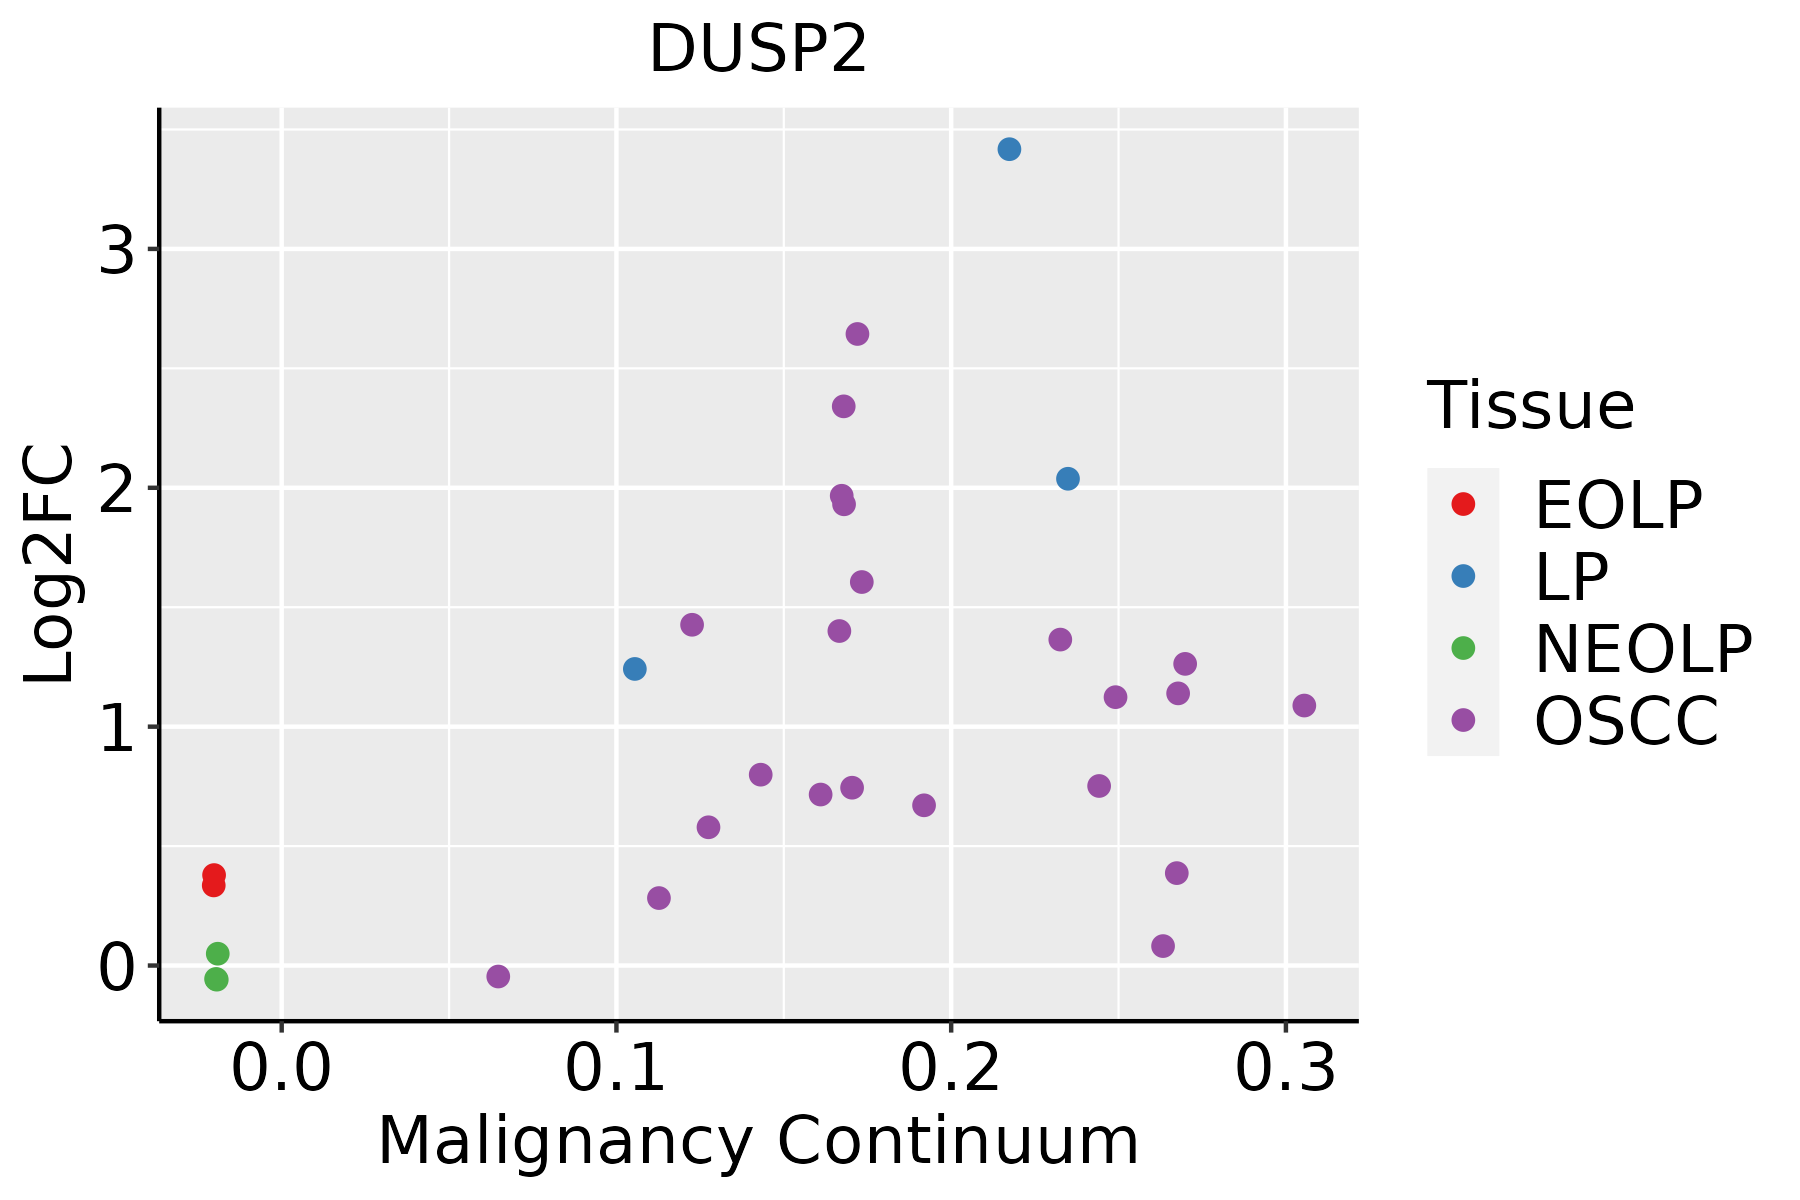 | EOLP: Erosive Oral lichen planus |
| LP: leukoplakia | ||
| NEOLP: Non-erosive oral lichen planus | ||
| OSCC: Oral squamous cell carcinoma | ||
| Prostate | 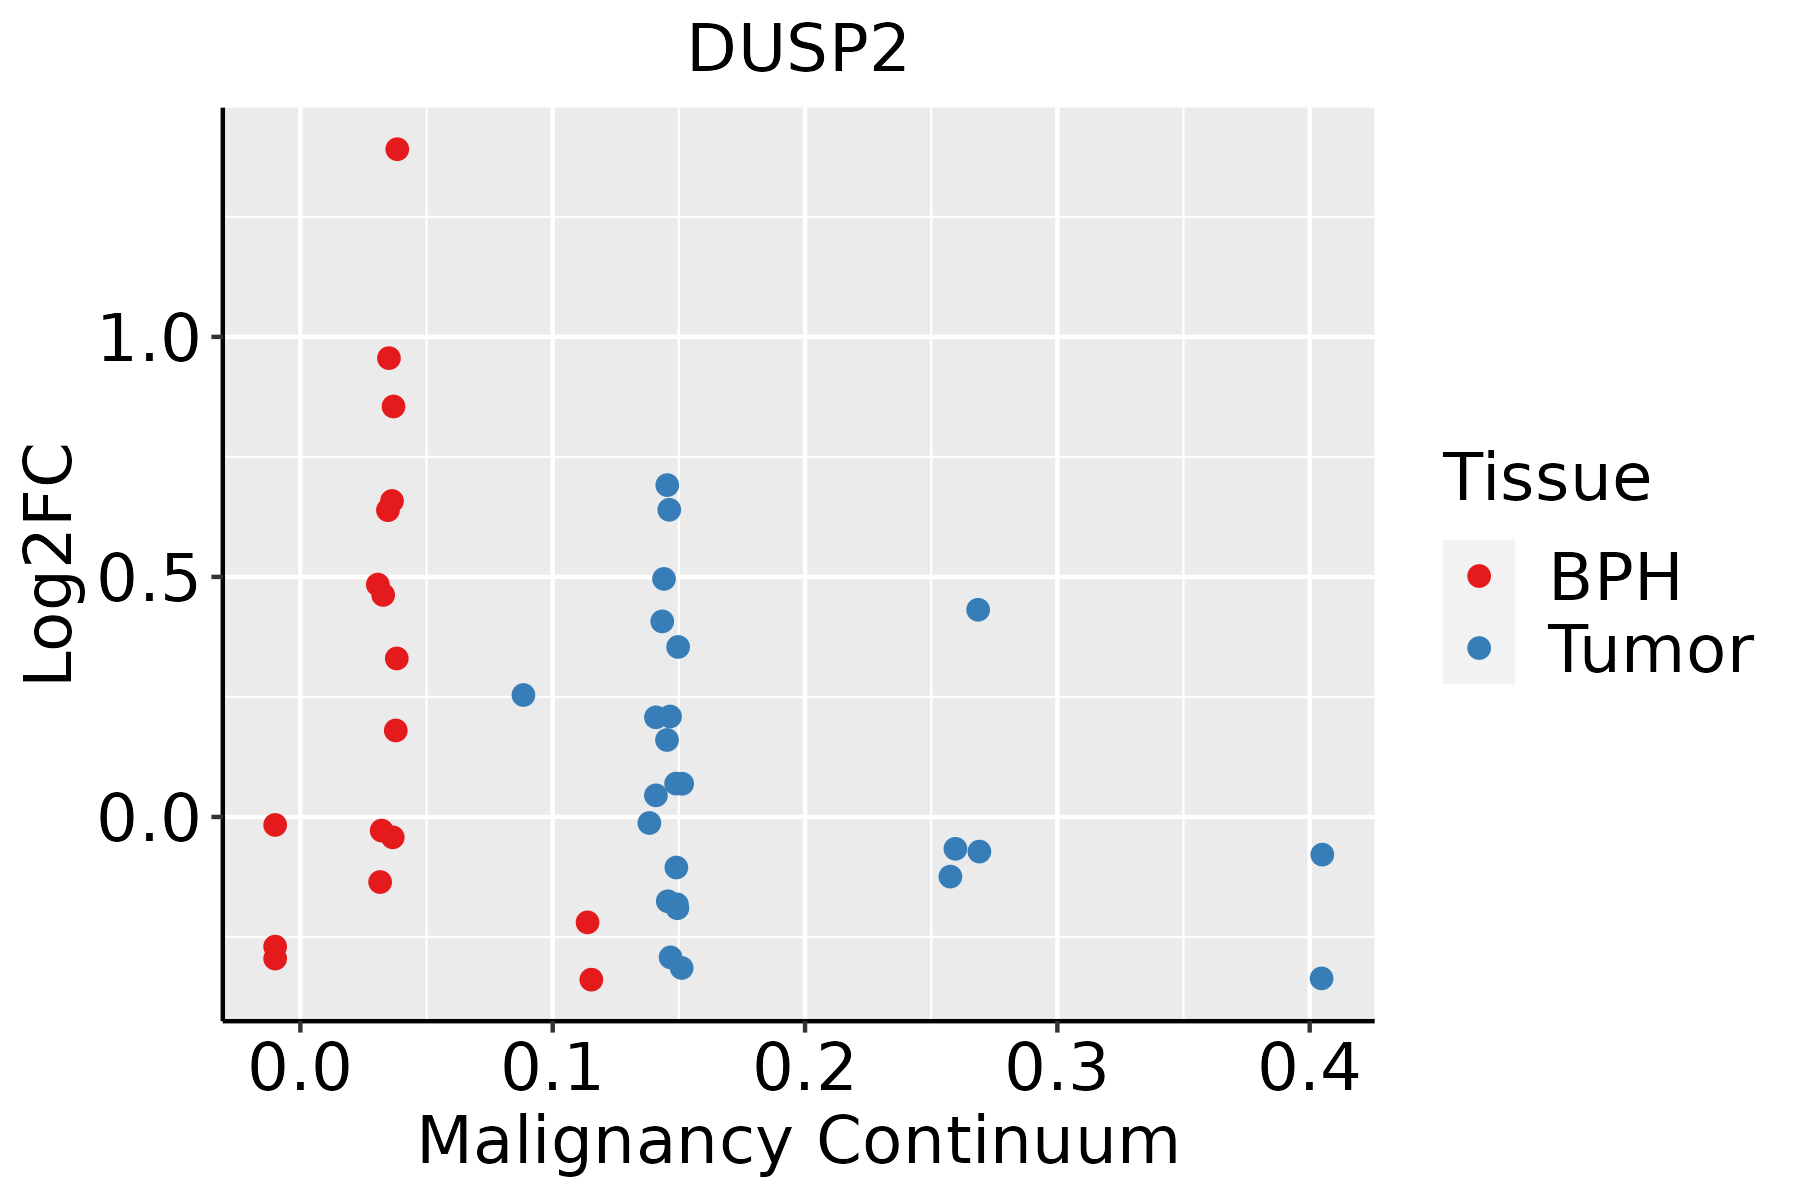 | BPH: Benign Prostatic Hyperplasia |
| Skin |  | AK: Actinic keratosis |
| cSCC: Cutaneous squamous cell carcinoma | ||
| SCCIS:squamous cell carcinoma in situ | ||
| Thyroid | 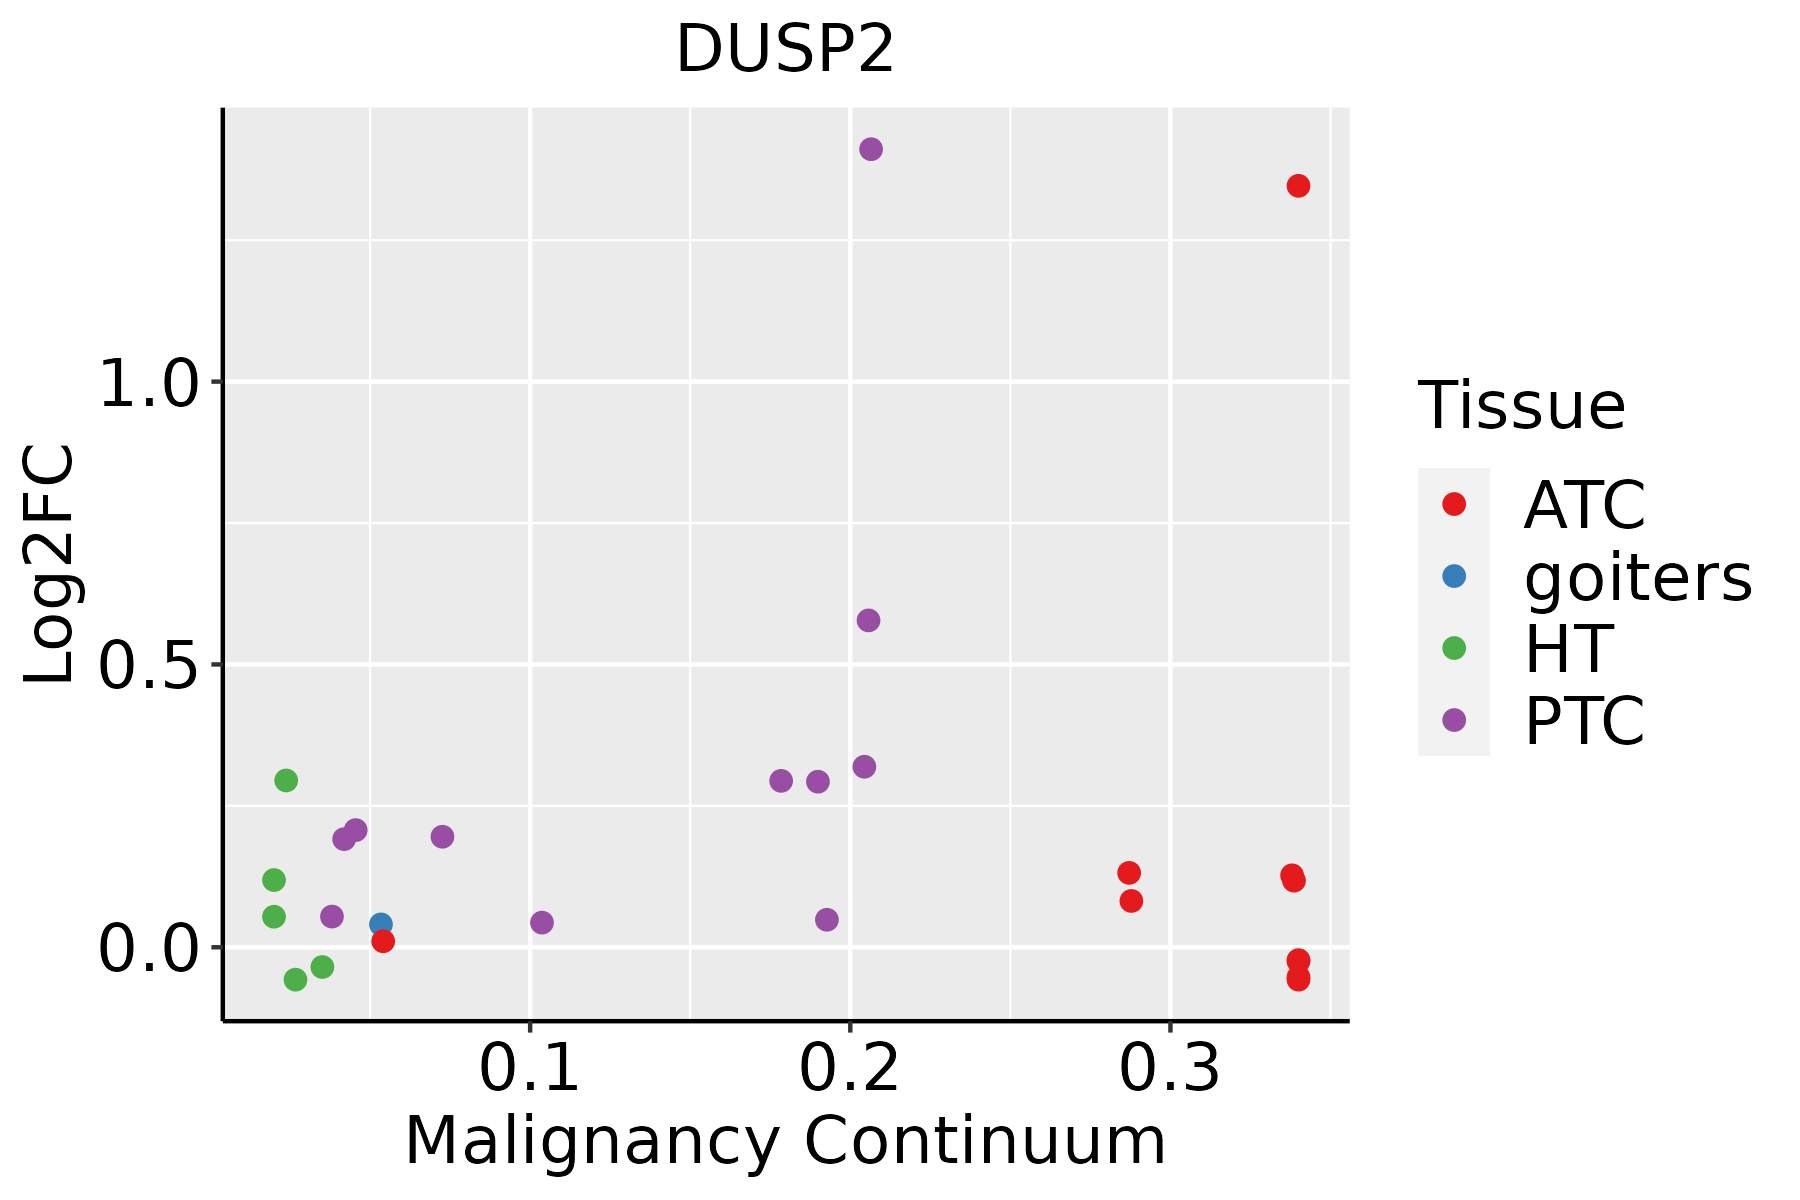 | ATC: Anaplastic thyroid cancer |
| HT: Hashimoto's thyroiditis | ||
| PTC: Papillary thyroid cancer |
| ∗log2FC in expression of this searched gene in stem-like cells from each diseased tissue sample relative to stem-like cells in normal samples in each tissue plotted against the malignancy continuum. Samples are colored based on if they are from different disease stage. |
Top |
Malignant transformation related pathway analysis |
| Find out the enriched GO biological processes and KEGG pathways involved in transition from healthy to precancer to cancer |
| Tissue | Disease Stage | Enriched GO biological Processes |
| Colorectum | AD |  |
| Colorectum | SER |  |
| Colorectum | MSS |  |
| Colorectum | MSI-H |  |
| Colorectum | FAP |  |
| ∗Top 15 enriched GO BP terms are showed in the bar plot of each disease state in each tissue. Each row represents a significant GO biological process which is colored according to the -log10(p.adjust). |
| Page: 1 2 3 4 5 6 7 8 9 |
| GO ID | Tissue | Disease Stage | Description | Gene Ratio | Bg Ratio | pvalue | p.adjust | Count |
| GO:00073695 | Cervix | CC | gastrulation | 42/2311 | 185/18723 | 5.83e-05 | 8.46e-04 | 42 |
| GO:00074923 | Cervix | CC | endoderm development | 20/2311 | 77/18723 | 8.40e-04 | 7.30e-03 | 20 |
| GO:00434099 | Cervix | CC | negative regulation of MAPK cascade | 37/2311 | 180/18723 | 1.17e-03 | 9.50e-03 | 37 |
| GO:0001704 | Cervix | CC | formation of primary germ layer | 27/2311 | 121/18723 | 1.49e-03 | 1.16e-02 | 27 |
| GO:00017041 | Cervix | HSIL_HPV | formation of primary germ layer | 13/737 | 121/18723 | 9.63e-04 | 1.20e-02 | 13 |
| GO:004340913 | Cervix | HSIL_HPV | negative regulation of MAPK cascade | 16/737 | 180/18723 | 2.05e-03 | 2.13e-02 | 16 |
| GO:000736911 | Cervix | HSIL_HPV | gastrulation | 16/737 | 185/18723 | 2.71e-03 | 2.58e-02 | 16 |
| GO:0001706 | Cervix | HSIL_HPV | endoderm formation | 7/737 | 54/18723 | 5.04e-03 | 4.12e-02 | 7 |
| GO:004340923 | Cervix | N_HPV | negative regulation of MAPK cascade | 12/534 | 180/18723 | 5.61e-03 | 3.98e-02 | 12 |
| GO:0010563111 | Esophagus | ESCC | negative regulation of phosphorus metabolic process | 274/8552 | 442/18723 | 2.32e-12 | 9.41e-11 | 274 |
| GO:0045936111 | Esophagus | ESCC | negative regulation of phosphate metabolic process | 273/8552 | 441/18723 | 3.18e-12 | 1.25e-10 | 273 |
| GO:0051348111 | Esophagus | ESCC | negative regulation of transferase activity | 177/8552 | 268/18723 | 1.08e-11 | 4.00e-10 | 177 |
| GO:0042326111 | Esophagus | ESCC | negative regulation of phosphorylation | 237/8552 | 385/18723 | 1.86e-10 | 5.33e-09 | 237 |
| GO:0150115110 | Esophagus | ESCC | cell-substrate junction organization | 77/8552 | 101/18723 | 3.46e-10 | 9.57e-09 | 77 |
| GO:0001933111 | Esophagus | ESCC | negative regulation of protein phosphorylation | 213/8552 | 342/18723 | 3.54e-10 | 9.76e-09 | 213 |
| GO:000704418 | Esophagus | ESCC | cell-substrate junction assembly | 73/8552 | 95/18723 | 5.27e-10 | 1.35e-08 | 73 |
| GO:001631110 | Esophagus | ESCC | dephosphorylation | 251/8552 | 417/18723 | 1.26e-09 | 2.99e-08 | 251 |
| GO:003367319 | Esophagus | ESCC | negative regulation of kinase activity | 154/8552 | 237/18723 | 1.38e-09 | 3.27e-08 | 154 |
| GO:000646920 | Esophagus | ESCC | negative regulation of protein kinase activity | 140/8552 | 212/18723 | 1.53e-09 | 3.56e-08 | 140 |
| GO:003158919 | Esophagus | ESCC | cell-substrate adhesion | 221/8552 | 363/18723 | 3.06e-09 | 6.62e-08 | 221 |
| Page: 1 2 3 4 5 6 7 8 9 10 11 12 |
| Pathway ID | Tissue | Disease Stage | Description | Gene Ratio | Bg Ratio | pvalue | p.adjust | qvalue | Count |
| hsa040109 | Cervix | CC | MAPK signaling pathway | 62/1267 | 302/8465 | 4.89e-03 | 1.67e-02 | 9.86e-03 | 62 |
| hsa0401012 | Cervix | CC | MAPK signaling pathway | 62/1267 | 302/8465 | 4.89e-03 | 1.67e-02 | 9.86e-03 | 62 |
| hsa0401014 | Oral cavity | OSCC | MAPK signaling pathway | 165/3704 | 302/8465 | 7.11e-05 | 2.74e-04 | 1.40e-04 | 165 |
| hsa0401015 | Oral cavity | OSCC | MAPK signaling pathway | 165/3704 | 302/8465 | 7.11e-05 | 2.74e-04 | 1.40e-04 | 165 |
| hsa0401023 | Oral cavity | EOLP | MAPK signaling pathway | 68/1218 | 302/8465 | 7.48e-05 | 3.40e-04 | 2.01e-04 | 68 |
| hsa0401033 | Oral cavity | EOLP | MAPK signaling pathway | 68/1218 | 302/8465 | 7.48e-05 | 3.40e-04 | 2.01e-04 | 68 |
| hsa0401010 | Prostate | BPH | MAPK signaling pathway | 87/1718 | 302/8465 | 2.05e-04 | 1.13e-03 | 6.98e-04 | 87 |
| hsa0401013 | Prostate | BPH | MAPK signaling pathway | 87/1718 | 302/8465 | 2.05e-04 | 1.13e-03 | 6.98e-04 | 87 |
| hsa0401022 | Prostate | Tumor | MAPK signaling pathway | 87/1791 | 302/8465 | 8.46e-04 | 3.94e-03 | 2.45e-03 | 87 |
| hsa0401032 | Prostate | Tumor | MAPK signaling pathway | 87/1791 | 302/8465 | 8.46e-04 | 3.94e-03 | 2.45e-03 | 87 |
| Page: 1 |
Top |
Cell-cell communication analysis |
| Identification of potential cell-cell interactions between two cell types and their ligand-receptor pairs for different disease states |
| Ligand | Receptor | LRpair | Pathway | Tissue | Disease Stage |
| Page: 1 |
Top |
Single-cell gene regulatory network inference analysis |
| Find out the significant the regulons (TFs) and the target genes of each regulon across cell types for different disease states |
| TF | Cell Type | Tissue | Disease Stage | Target Gene | RSS | Regulon Activity |
| ∗The dot plots of a searched regulon are shown for all cell subpopulations in each disease state of each tissue based on the regulon specific score inferred using pySCENIC and by calculating the average expression. |
| Page: 1 |
Top |
Somatic mutation of malignant transformation related genes |
| Annotation of somatic variants for genes involved in malignant transformation |
| Hugo Symbol | Variant Class | Variant Classification | dbSNP RS | HGVSc | HGVSp | HGVSp Short | SWISSPROT | BIOTYPE | SIFT | PolyPhen | Tumor Sample Barcode | Tissue | Histology | Sex | Age | Stage | Therapy Types | Drugs | Outcome |
| DUSP2 | SNV | Missense_Mutation | novel | c.625N>C | p.Cys209Arg | p.C209R | Q05923 | protein_coding | deleterious(0) | probably_damaging(0.999) | TCGA-AO-A128-01 | Breast | breast invasive carcinoma | Female | <65 | I/II | Chemotherapy | doxorubicin | SD |
| DUSP2 | SNV | Missense_Mutation | rs768360352 | c.878T>G | p.Val293Gly | p.V293G | Q05923 | protein_coding | deleterious(0) | probably_damaging(0.999) | TCGA-C8-A27B-01 | Breast | breast invasive carcinoma | Female | <65 | I/II | Chemotherapy | 5-fluorouracil | CR |
| DUSP2 | SNV | Missense_Mutation | c.829N>T | p.Arg277Cys | p.R277C | Q05923 | protein_coding | deleterious(0) | probably_damaging(0.988) | TCGA-A6-3809-01 | Colorectum | colon adenocarcinoma | Female | >=65 | I/II | Unknown | Unknown | SD | |
| DUSP2 | SNV | Missense_Mutation | rs751919546 | c.619N>A | p.Ala207Thr | p.A207T | Q05923 | protein_coding | tolerated(0.18) | benign(0.397) | TCGA-NH-A50U-01 | Colorectum | colon adenocarcinoma | Male | <65 | I/II | Ancillary | leucovorin | PD |
| DUSP2 | SNV | Missense_Mutation | novel | c.712N>A | p.Glu238Lys | p.E238K | Q05923 | protein_coding | deleterious(0) | possibly_damaging(0.869) | TCGA-A5-A0G2-01 | Endometrium | uterine corpus endometrioid carcinoma | Female | <65 | III/IV | Unknown | Unknown | SD |
| DUSP2 | SNV | Missense_Mutation | novel | c.62N>A | p.Pro21Gln | p.P21Q | Q05923 | protein_coding | tolerated(0.31) | possibly_damaging(0.769) | TCGA-AP-A1DK-01 | Endometrium | uterine corpus endometrioid carcinoma | Female | <65 | I/II | Unknown | Unknown | SD |
| DUSP2 | SNV | Missense_Mutation | novel | c.824N>A | p.Ser275Asn | p.S275N | Q05923 | protein_coding | deleterious(0.03) | benign(0.015) | TCGA-AX-A1CE-01 | Endometrium | uterine corpus endometrioid carcinoma | Female | <65 | I/II | Unspecific | Paclitaxel | SD |
| DUSP2 | SNV | Missense_Mutation | novel | c.721G>T | p.Gly241Cys | p.G241C | Q05923 | protein_coding | deleterious(0.04) | possibly_damaging(0.537) | TCGA-DF-A2KU-01 | Endometrium | uterine corpus endometrioid carcinoma | Female | Unknown | I/II | Unknown | Unknown | SD |
| DUSP2 | SNV | Missense_Mutation | novel | c.16N>A | p.Ala6Thr | p.A6T | Q05923 | protein_coding | tolerated(0.3) | benign(0) | TCGA-EY-A215-01 | Endometrium | uterine corpus endometrioid carcinoma | Female | <65 | I/II | Unknown | Unknown | SD |
| DUSP2 | SNV | Missense_Mutation | c.899T>G | p.Phe300Cys | p.F300C | Q05923 | protein_coding | deleterious(0) | probably_damaging(0.999) | TCGA-ES-A2HT-01 | Liver | liver hepatocellular carcinoma | Male | <65 | I/II | Unknown | Unknown | SD |
| Page: 1 2 |
Top |
Related drugs of malignant transformation related genes |
| Identification of chemicals and drugs interact with genes involved in malignant transfromation |
| (DGIdb 4.0) |
| Entrez ID | Symbol | Category | Interaction Types | Drug Claim Name | Drug Name | PMIDs |
| Page: 1 |

Copyright 2023-Present -The University of Texas Health Science Center at Houston |