
|
|||||
|
 | |
| |
| |
| |
| |
| |
|
Gene: DUSP16 |
Gene summary for DUSP16 |
| Gene information | Species | Human | Gene symbol | DUSP16 | Gene ID | 80824 |
| Gene name | dual specificity phosphatase 16 | |
| Gene Alias | MKP-7 | |
| Cytomap | 12p13.2 | |
| Gene Type | protein-coding | GO ID | GO:0000165 | UniProtAcc | A0A024RAR2 |
Top |
Malignant transformation analysis |
| Identification of the aberrant gene expression in precancerous and cancerous lesions by comparing the gene expression of stem-like cells in diseased tissues with normal stem cells |
| Entrez ID | Symbol | Replicates | Species | Organ | Tissue | Adj P-value | Log2FC | Malignancy |
| 80824 | DUSP16 | AEH-subject1 | Human | Endometrium | AEH | 3.52e-19 | 5.42e-01 | -0.3059 |
| 80824 | DUSP16 | AEH-subject4 | Human | Endometrium | AEH | 1.31e-11 | 5.26e-01 | -0.2657 |
| 80824 | DUSP16 | AEH-subject5 | Human | Endometrium | AEH | 1.32e-09 | 4.28e-01 | -0.2953 |
| 80824 | DUSP16 | EEC-subject1 | Human | Endometrium | EEC | 1.08e-09 | 4.57e-01 | -0.2682 |
| 80824 | DUSP16 | EEC-subject4 | Human | Endometrium | EEC | 1.24e-05 | 2.86e-01 | -0.2571 |
| 80824 | DUSP16 | GSM6177620_NYU_UCEC1_lib3_lib3 | Human | Endometrium | EEC | 2.87e-02 | 1.13e-02 | -0.1883 |
| 80824 | DUSP16 | GSM6177622_NYU_UCEC3_lib2_lib2 | Human | Endometrium | EEC | 1.06e-02 | -6.63e-02 | -0.1916 |
| 80824 | DUSP16 | RNA-P17T-P17T-2 | Human | Lung | IAC | 2.56e-02 | 4.47e-01 | 0.3371 |
| 80824 | DUSP16 | RNA-P25T1-P25T1-1 | Human | Lung | AIS | 7.93e-14 | 6.31e-01 | -0.2116 |
| 80824 | DUSP16 | RNA-P25T1-P25T1-2 | Human | Lung | AIS | 2.98e-03 | 6.65e-01 | -0.1941 |
| 80824 | DUSP16 | RNA-P25T1-P25T1-3 | Human | Lung | AIS | 1.05e-06 | 7.07e-01 | -0.2107 |
| 80824 | DUSP16 | RNA-P25T1-P25T1-4 | Human | Lung | AIS | 5.33e-08 | 5.67e-01 | -0.2119 |
| 80824 | DUSP16 | RNA-P6T1-P6T1-2 | Human | Lung | MIAC | 3.96e-02 | 6.53e-01 | -0.0186 |
| 80824 | DUSP16 | RNA-P6T1-P6T1-4 | Human | Lung | MIAC | 2.39e-02 | 5.39e-01 | -0.0263 |
| 80824 | DUSP16 | RNA-P6T2-P6T2-1 | Human | Lung | IAC | 2.53e-16 | 5.79e-01 | -0.0166 |
| 80824 | DUSP16 | RNA-P6T2-P6T2-2 | Human | Lung | IAC | 1.53e-15 | 5.02e-01 | -0.0132 |
| 80824 | DUSP16 | RNA-P6T2-P6T2-3 | Human | Lung | IAC | 8.21e-19 | 5.29e-01 | -0.013 |
| 80824 | DUSP16 | RNA-P6T2-P6T2-4 | Human | Lung | IAC | 2.91e-10 | 5.11e-01 | -0.0121 |
| 80824 | DUSP16 | RNA-P7T1-P7T1-1 | Human | Lung | AIS | 9.11e-08 | 9.01e-01 | -0.0961 |
| 80824 | DUSP16 | RNA-P7T1-P7T1-2 | Human | Lung | AIS | 1.91e-07 | 8.61e-01 | -0.0876 |
| Page: 1 2 |
| Tissue | Expression Dynamics | Abbreviation |
| Endometrium |  | AEH: Atypical endometrial hyperplasia |
| EEC: Endometrioid Cancer | ||
| Lung | 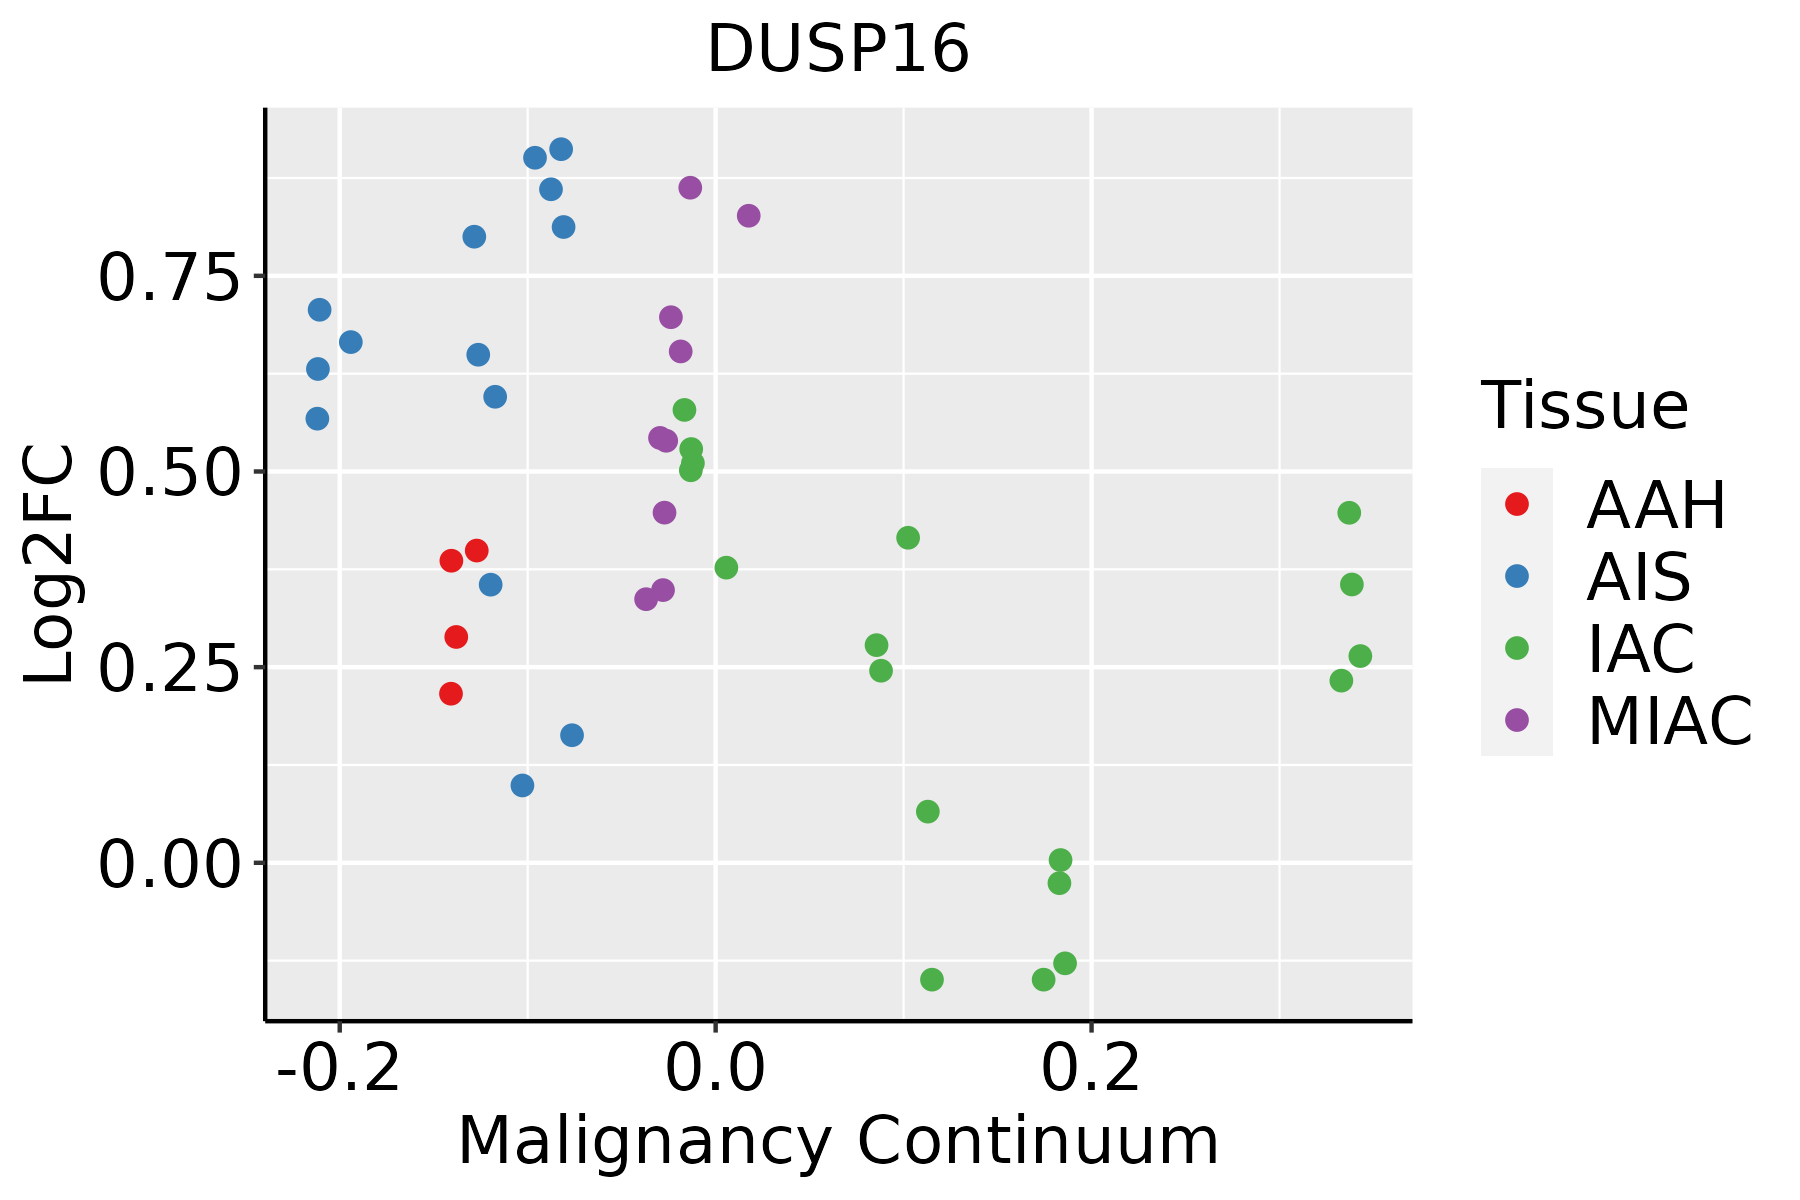 | AAH: Atypical adenomatous hyperplasia |
| AIS: Adenocarcinoma in situ | ||
| IAC: Invasive lung adenocarcinoma | ||
| MIA: Minimally invasive adenocarcinoma | ||
| Prostate |  | BPH: Benign Prostatic Hyperplasia |
| ∗log2FC in expression of this searched gene in stem-like cells from each diseased tissue sample relative to stem-like cells in normal samples in each tissue plotted against the malignancy continuum. Samples are colored based on if they are from different disease stage. |
Top |
Malignant transformation related pathway analysis |
| Find out the enriched GO biological processes and KEGG pathways involved in transition from healthy to precancer to cancer |
| Tissue | Disease Stage | Enriched GO biological Processes |
| Colorectum | AD |  |
| Colorectum | SER |  |
| Colorectum | MSS |  |
| Colorectum | MSI-H |  |
| Colorectum | FAP |  |
| ∗Top 15 enriched GO BP terms are showed in the bar plot of each disease state in each tissue. Each row represents a significant GO biological process which is colored according to the -log10(p.adjust). |
| Page: 1 2 3 4 5 6 7 8 9 |
| GO ID | Tissue | Disease Stage | Description | Gene Ratio | Bg Ratio | pvalue | p.adjust | Count |
| GO:00066117 | Endometrium | AEH | protein export from nucleus | 17/2100 | 57/18723 | 1.13e-04 | 1.60e-03 | 17 |
| GO:000691310 | Endometrium | AEH | nucleocytoplasmic transport | 54/2100 | 301/18723 | 3.24e-04 | 3.62e-03 | 54 |
| GO:005116910 | Endometrium | AEH | nuclear transport | 54/2100 | 301/18723 | 3.24e-04 | 3.62e-03 | 54 |
| GO:005116810 | Endometrium | AEH | nuclear export | 32/2100 | 154/18723 | 4.02e-04 | 4.29e-03 | 32 |
| GO:004340910 | Endometrium | AEH | negative regulation of MAPK cascade | 33/2100 | 180/18723 | 3.04e-03 | 2.15e-02 | 33 |
| GO:000661114 | Endometrium | EEC | protein export from nucleus | 20/2168 | 57/18723 | 2.96e-06 | 8.25e-05 | 20 |
| GO:000691314 | Endometrium | EEC | nucleocytoplasmic transport | 59/2168 | 301/18723 | 3.31e-05 | 5.65e-04 | 59 |
| GO:005116914 | Endometrium | EEC | nuclear transport | 59/2168 | 301/18723 | 3.31e-05 | 5.65e-04 | 59 |
| GO:005116814 | Endometrium | EEC | nuclear export | 35/2168 | 154/18723 | 6.36e-05 | 9.48e-04 | 35 |
| GO:004340914 | Endometrium | EEC | negative regulation of MAPK cascade | 34/2168 | 180/18723 | 2.69e-03 | 1.95e-02 | 34 |
| GO:00069138 | Lung | IAC | nucleocytoplasmic transport | 63/2061 | 301/18723 | 3.50e-07 | 2.54e-05 | 63 |
| GO:00511698 | Lung | IAC | nuclear transport | 63/2061 | 301/18723 | 3.50e-07 | 2.54e-05 | 63 |
| GO:00511688 | Lung | IAC | nuclear export | 38/2061 | 154/18723 | 1.24e-06 | 6.45e-05 | 38 |
| GO:00434098 | Lung | IAC | negative regulation of MAPK cascade | 40/2061 | 180/18723 | 1.05e-05 | 3.30e-04 | 40 |
| GO:00163116 | Lung | IAC | dephosphorylation | 75/2061 | 417/18723 | 1.21e-05 | 3.64e-04 | 75 |
| GO:00066115 | Lung | IAC | protein export from nucleus | 14/2061 | 57/18723 | 2.93e-03 | 2.61e-02 | 14 |
| GO:004340912 | Lung | AIS | negative regulation of MAPK cascade | 39/1849 | 180/18723 | 1.92e-06 | 1.12e-04 | 39 |
| GO:001631112 | Lung | AIS | dephosphorylation | 69/1849 | 417/18723 | 1.27e-05 | 4.78e-04 | 69 |
| GO:005116813 | Lung | AIS | nuclear export | 33/1849 | 154/18723 | 1.47e-05 | 5.40e-04 | 33 |
| GO:000691313 | Lung | AIS | nucleocytoplasmic transport | 52/1849 | 301/18723 | 4.54e-05 | 1.34e-03 | 52 |
| Page: 1 2 |
| Pathway ID | Tissue | Disease Stage | Description | Gene Ratio | Bg Ratio | pvalue | p.adjust | qvalue | Count |
| hsa040108 | Lung | IAC | MAPK signaling pathway | 62/1053 | 302/8465 | 3.54e-05 | 6.38e-04 | 4.24e-04 | 62 |
| hsa0401011 | Lung | IAC | MAPK signaling pathway | 62/1053 | 302/8465 | 3.54e-05 | 6.38e-04 | 4.24e-04 | 62 |
| hsa0401021 | Lung | AIS | MAPK signaling pathway | 57/961 | 302/8465 | 6.41e-05 | 9.43e-04 | 6.03e-04 | 57 |
| hsa0401031 | Lung | AIS | MAPK signaling pathway | 57/961 | 302/8465 | 6.41e-05 | 9.43e-04 | 6.03e-04 | 57 |
| hsa040106 | Lung | MIAC | MAPK signaling pathway | 32/507 | 302/8465 | 1.12e-03 | 1.36e-02 | 9.81e-03 | 32 |
| hsa040107 | Lung | MIAC | MAPK signaling pathway | 32/507 | 302/8465 | 1.12e-03 | 1.36e-02 | 9.81e-03 | 32 |
| hsa0401010 | Prostate | BPH | MAPK signaling pathway | 87/1718 | 302/8465 | 2.05e-04 | 1.13e-03 | 6.98e-04 | 87 |
| hsa0401013 | Prostate | BPH | MAPK signaling pathway | 87/1718 | 302/8465 | 2.05e-04 | 1.13e-03 | 6.98e-04 | 87 |
| hsa0401022 | Prostate | Tumor | MAPK signaling pathway | 87/1791 | 302/8465 | 8.46e-04 | 3.94e-03 | 2.45e-03 | 87 |
| hsa0401032 | Prostate | Tumor | MAPK signaling pathway | 87/1791 | 302/8465 | 8.46e-04 | 3.94e-03 | 2.45e-03 | 87 |
| Page: 1 |
Top |
Cell-cell communication analysis |
| Identification of potential cell-cell interactions between two cell types and their ligand-receptor pairs for different disease states |
| Ligand | Receptor | LRpair | Pathway | Tissue | Disease Stage |
| Page: 1 |
Top |
Single-cell gene regulatory network inference analysis |
| Find out the significant the regulons (TFs) and the target genes of each regulon across cell types for different disease states |
| TF | Cell Type | Tissue | Disease Stage | Target Gene | RSS | Regulon Activity |
| ∗The dot plots of a searched regulon are shown for all cell subpopulations in each disease state of each tissue based on the regulon specific score inferred using pySCENIC and by calculating the average expression. |
| Page: 1 |
Top |
Somatic mutation of malignant transformation related genes |
| Annotation of somatic variants for genes involved in malignant transformation |
| Hugo Symbol | Variant Class | Variant Classification | dbSNP RS | HGVSc | HGVSp | HGVSp Short | SWISSPROT | BIOTYPE | SIFT | PolyPhen | Tumor Sample Barcode | Tissue | Histology | Sex | Age | Stage | Therapy Types | Drugs | Outcome |
| DUSP16 | SNV | Missense_Mutation | rs370518275 | c.623N>A | p.Arg208His | p.R208H | Q9BY84 | protein_coding | deleterious(0) | probably_damaging(0.992) | TCGA-A2-A0CR-01 | Breast | breast invasive carcinoma | Female | <65 | I/II | Chemotherapy | adriamycin | CR |
| DUSP16 | SNV | Missense_Mutation | rs148059278 | c.482N>A | p.Arg161Gln | p.R161Q | Q9BY84 | protein_coding | deleterious(0) | possibly_damaging(0.722) | TCGA-A8-A09Z-01 | Breast | breast invasive carcinoma | Female | >=65 | I/II | Unknown | Unknown | SD |
| DUSP16 | SNV | Missense_Mutation | novel | c.130G>A | p.Glu44Lys | p.E44K | Q9BY84 | protein_coding | tolerated(0.11) | benign(0.381) | TCGA-C8-A12X-01 | Breast | breast invasive carcinoma | Female | <65 | I/II | Unknown | Unknown | SD |
| DUSP16 | SNV | Missense_Mutation | novel | c.130N>A | p.Glu44Lys | p.E44K | Q9BY84 | protein_coding | tolerated(0.11) | benign(0.381) | TCGA-D8-A1Y1-01 | Breast | breast invasive carcinoma | Female | >=65 | III/IV | Hormone Therapy | tamoxiphen | PD |
| DUSP16 | SNV | Missense_Mutation | c.629N>T | p.Pro210Leu | p.P210L | Q9BY84 | protein_coding | deleterious(0) | possibly_damaging(0.876) | TCGA-D8-A1Y3-01 | Breast | breast invasive carcinoma | Female | <65 | III/IV | Chemotherapy | doxorubicine+cyclophosphamide | SD | |
| DUSP16 | SNV | Missense_Mutation | novel | c.34N>T | p.Thr12Ser | p.T12S | Q9BY84 | protein_coding | tolerated(0.3) | benign(0.115) | TCGA-GI-A2C9-01 | Breast | breast invasive carcinoma | Female | <65 | I/II | Unspecific | SD | |
| DUSP16 | insertion | Frame_Shift_Ins | novel | c.905dupC | p.Gly303TrpfsTer19 | p.G303Wfs*19 | Q9BY84 | protein_coding | TCGA-B6-A0IC-01 | Breast | breast invasive carcinoma | Female | >=65 | I/II | Unknown | Unknown | SD | ||
| DUSP16 | insertion | Frame_Shift_Ins | novel | c.1510_1511insGGGGATTACAGGCACCAGCCACCATGCCCGG | p.His504ArgfsTer44 | p.H504Rfs*44 | Q9BY84 | protein_coding | TCGA-BH-A0AY-01 | Breast | breast invasive carcinoma | Female | <65 | I/II | Chemotherapy | SD | |||
| DUSP16 | SNV | Missense_Mutation | rs866115319 | c.1832N>A | p.Arg611Gln | p.R611Q | Q9BY84 | protein_coding | tolerated(0.08) | possibly_damaging(0.838) | TCGA-EA-A410-01 | Cervix | cervical & endocervical cancer | Female | <65 | I/II | Unknown | Unknown | SD |
| DUSP16 | SNV | Missense_Mutation | c.238N>C | p.Asp80His | p.D80H | Q9BY84 | protein_coding | tolerated(0.17) | benign(0.166) | TCGA-IR-A3LA-01 | Cervix | cervical & endocervical cancer | Female | <65 | I/II | Chemotherapy | cisplatin | CR |
| Page: 1 2 3 4 5 6 7 |
Top |
Related drugs of malignant transformation related genes |
| Identification of chemicals and drugs interact with genes involved in malignant transfromation |
| (DGIdb 4.0) |
| Entrez ID | Symbol | Category | Interaction Types | Drug Claim Name | Drug Name | PMIDs |
| Page: 1 |

Copyright 2023-Present -The University of Texas Health Science Center at Houston |