Schematic overview of the cellular and molecular mechanisms involved in the cancer progression, including the proposed cellular and molecular mechanisms in cancer cells trajectory. AT1: alveolar type 1 cells; AT2: alveolar type 2 cells; AAH: atypical adenomatous hyperplasia; AIS: adenocarcinoma in situ; MIA: minimally invasive adenocarcinoma; IA: invasive adenocarcinoma; EMT: epithelial-mesenchymal transition

Home

Download

Statistics

Help

Contact

Center for Computational Systems Medicine
leaf

Gene summary

leaf

Malignant transformation analysis

leaf

Malignant transformation related pathway analysis

leaf

Cell-cell communication analysis

leaf

Single-cell gene regulatory network inference analysis

leaf

Somatic mutation of malignant transformation related genes

leaf

Related drugs of malignant transformation related genes

Gene: DUSP12

Gene summary for DUSP12

check button Gene summary.

Gene informationSpeciesHuman
Gene symbol

DUSP12

Gene ID

11266

Gene namedual specificity phosphatase 12
Gene AliasDUSP1
Cytomap1q23.3
Gene Typeprotein-coding
GO ID

GO:0005975

UniProtAcc

Q9UNI6


Top

Malignant transformation analysis

check button Identification of the aberrant gene expression in precancerous and cancerous lesions by comparing the gene expression of stem-like cells in diseased tissues with normal stem cells
check button Malignant transformation involving gene list.
Entrez IDSymbolReplicatesSpeciesOrganTissueAdj P-valueLog2FCMalignancy
11266DUSP12LZE4THumanEsophagusESCC6.12e-123.06e-010.0811
11266DUSP12LZE7THumanEsophagusESCC2.93e-095.72e-010.0667
11266DUSP12LZE8THumanEsophagusESCC1.30e-021.15e-010.067
11266DUSP12LZE24THumanEsophagusESCC9.75e-062.55e-010.0596
11266DUSP12LZE6THumanEsophagusESCC1.24e-022.22e-010.0845
11266DUSP12P1T-EHumanEsophagusESCC1.35e-021.48e-010.0875
11266DUSP12P2T-EHumanEsophagusESCC2.90e-276.52e-010.1177
11266DUSP12P4T-EHumanEsophagusESCC5.39e-449.77e-010.1323
11266DUSP12P5T-EHumanEsophagusESCC2.84e-256.02e-010.1327
11266DUSP12P8T-EHumanEsophagusESCC1.18e-132.58e-010.0889
11266DUSP12P9T-EHumanEsophagusESCC3.69e-184.31e-010.1131
11266DUSP12P10T-EHumanEsophagusESCC4.50e-203.98e-010.116
11266DUSP12P11T-EHumanEsophagusESCC5.94e-195.67e-010.1426
11266DUSP12P12T-EHumanEsophagusESCC3.96e-304.05e-010.1122
11266DUSP12P15T-EHumanEsophagusESCC6.40e-214.11e-010.1149
11266DUSP12P16T-EHumanEsophagusESCC2.03e-204.38e-010.1153
11266DUSP12P17T-EHumanEsophagusESCC1.23e-051.48e-010.1278
11266DUSP12P19T-EHumanEsophagusESCC4.10e-055.24e-010.1662
11266DUSP12P20T-EHumanEsophagusESCC1.48e-133.32e-010.1124
11266DUSP12P21T-EHumanEsophagusESCC6.55e-345.79e-010.1617
Page: 1 2 3 4 5 

check button Transcriptomic changes along malignancy continuum.
TissueExpression DynamicsAbbreviation
EsophagusThe image shows the transcriptomic changes along malignancy continuum.log2FC in expression of this searched gene in stem-like cells from each diseased tissue sample relative to stem-like cells in normal samples in each tissue plotted against the malignancy continuum. Samples are colored based on if they are from different disease stage.
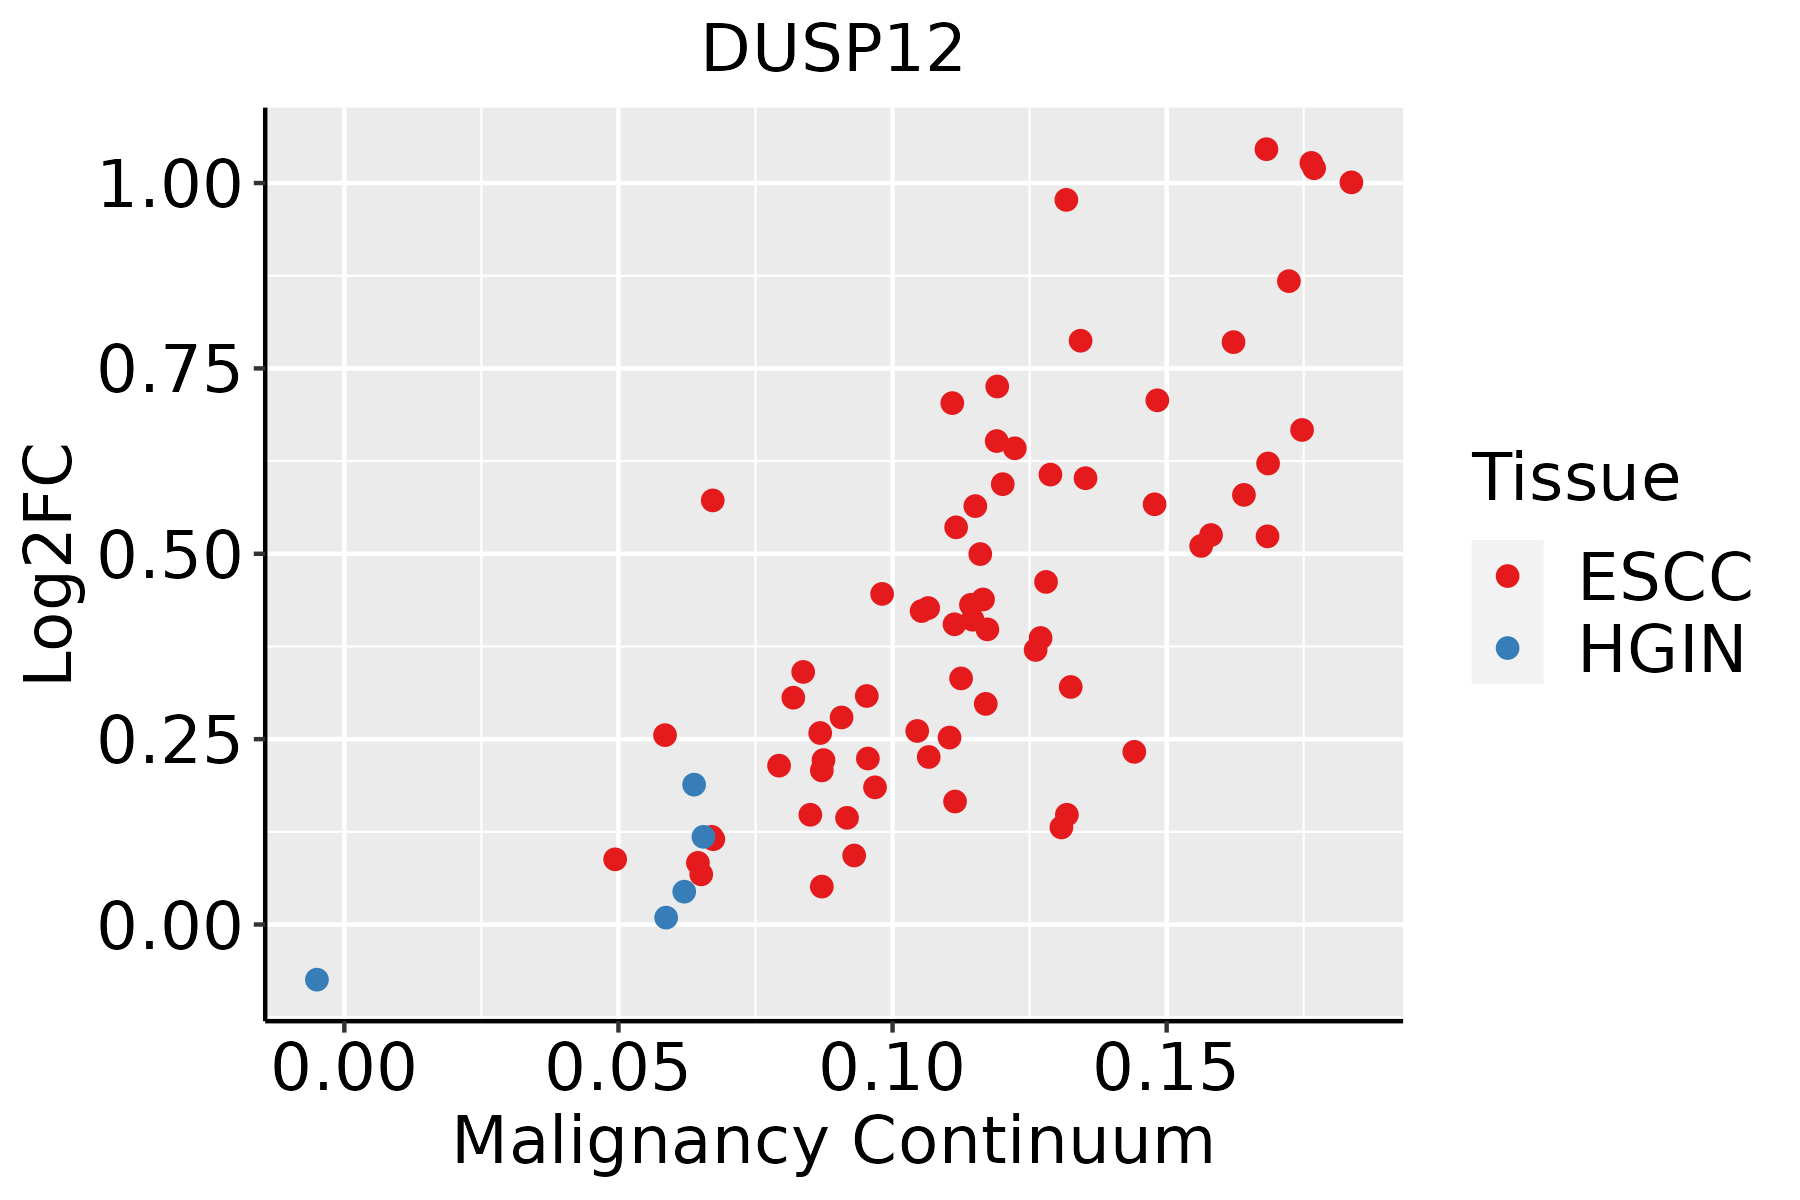
ESCC: Esophageal squamous cell carcinoma
HGIN: High-grade intraepithelial neoplasias
LGIN: Low-grade intraepithelial neoplasias
LiverThe image shows the transcriptomic changes along malignancy continuum.log2FC in expression of this searched gene in stem-like cells from each diseased tissue sample relative to stem-like cells in normal samples in each tissue plotted against the malignancy continuum. Samples are colored based on if they are from different disease stage.
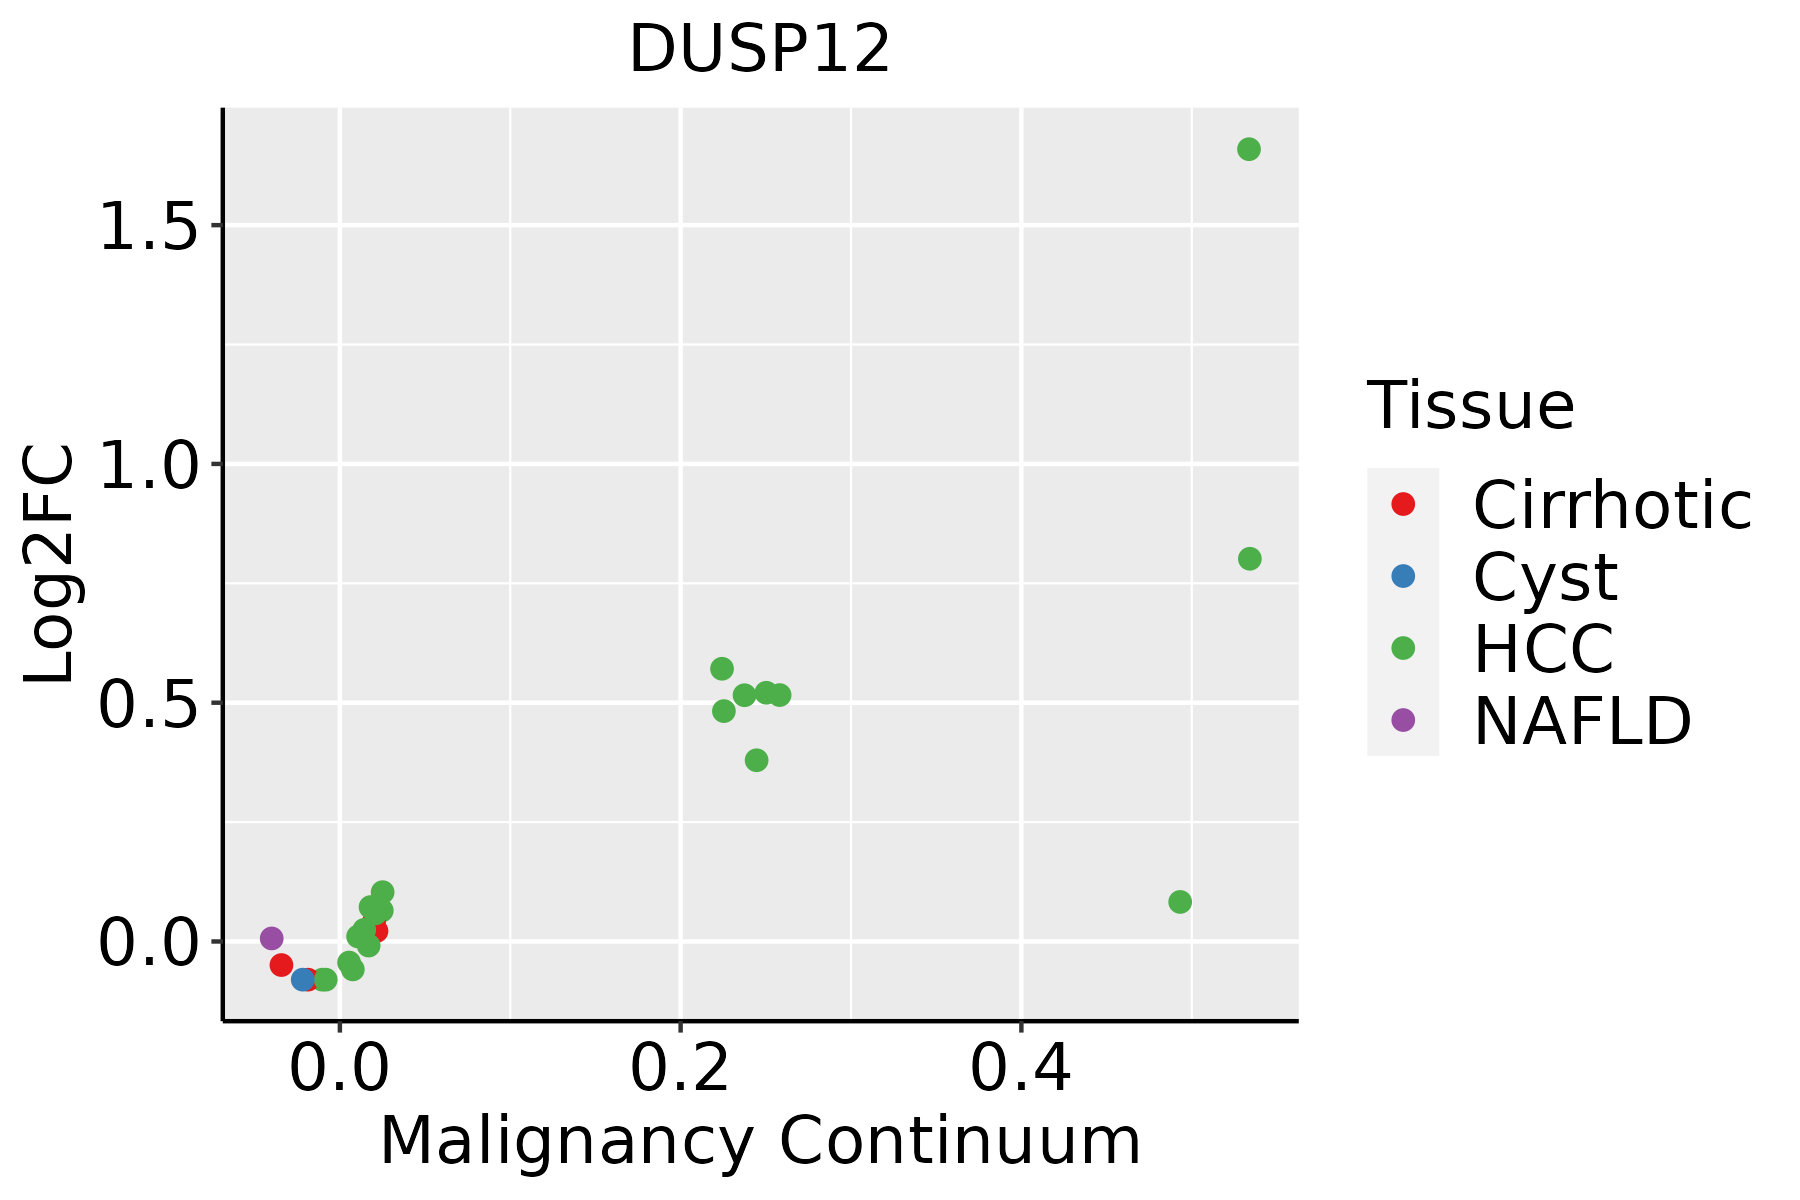
HCC: Hepatocellular carcinoma
NAFLD: Non-alcoholic fatty liver disease
Oral CavityThe image shows the transcriptomic changes along malignancy continuum.log2FC in expression of this searched gene in stem-like cells from each diseased tissue sample relative to stem-like cells in normal samples in each tissue plotted against the malignancy continuum. Samples are colored based on if they are from different disease stage.
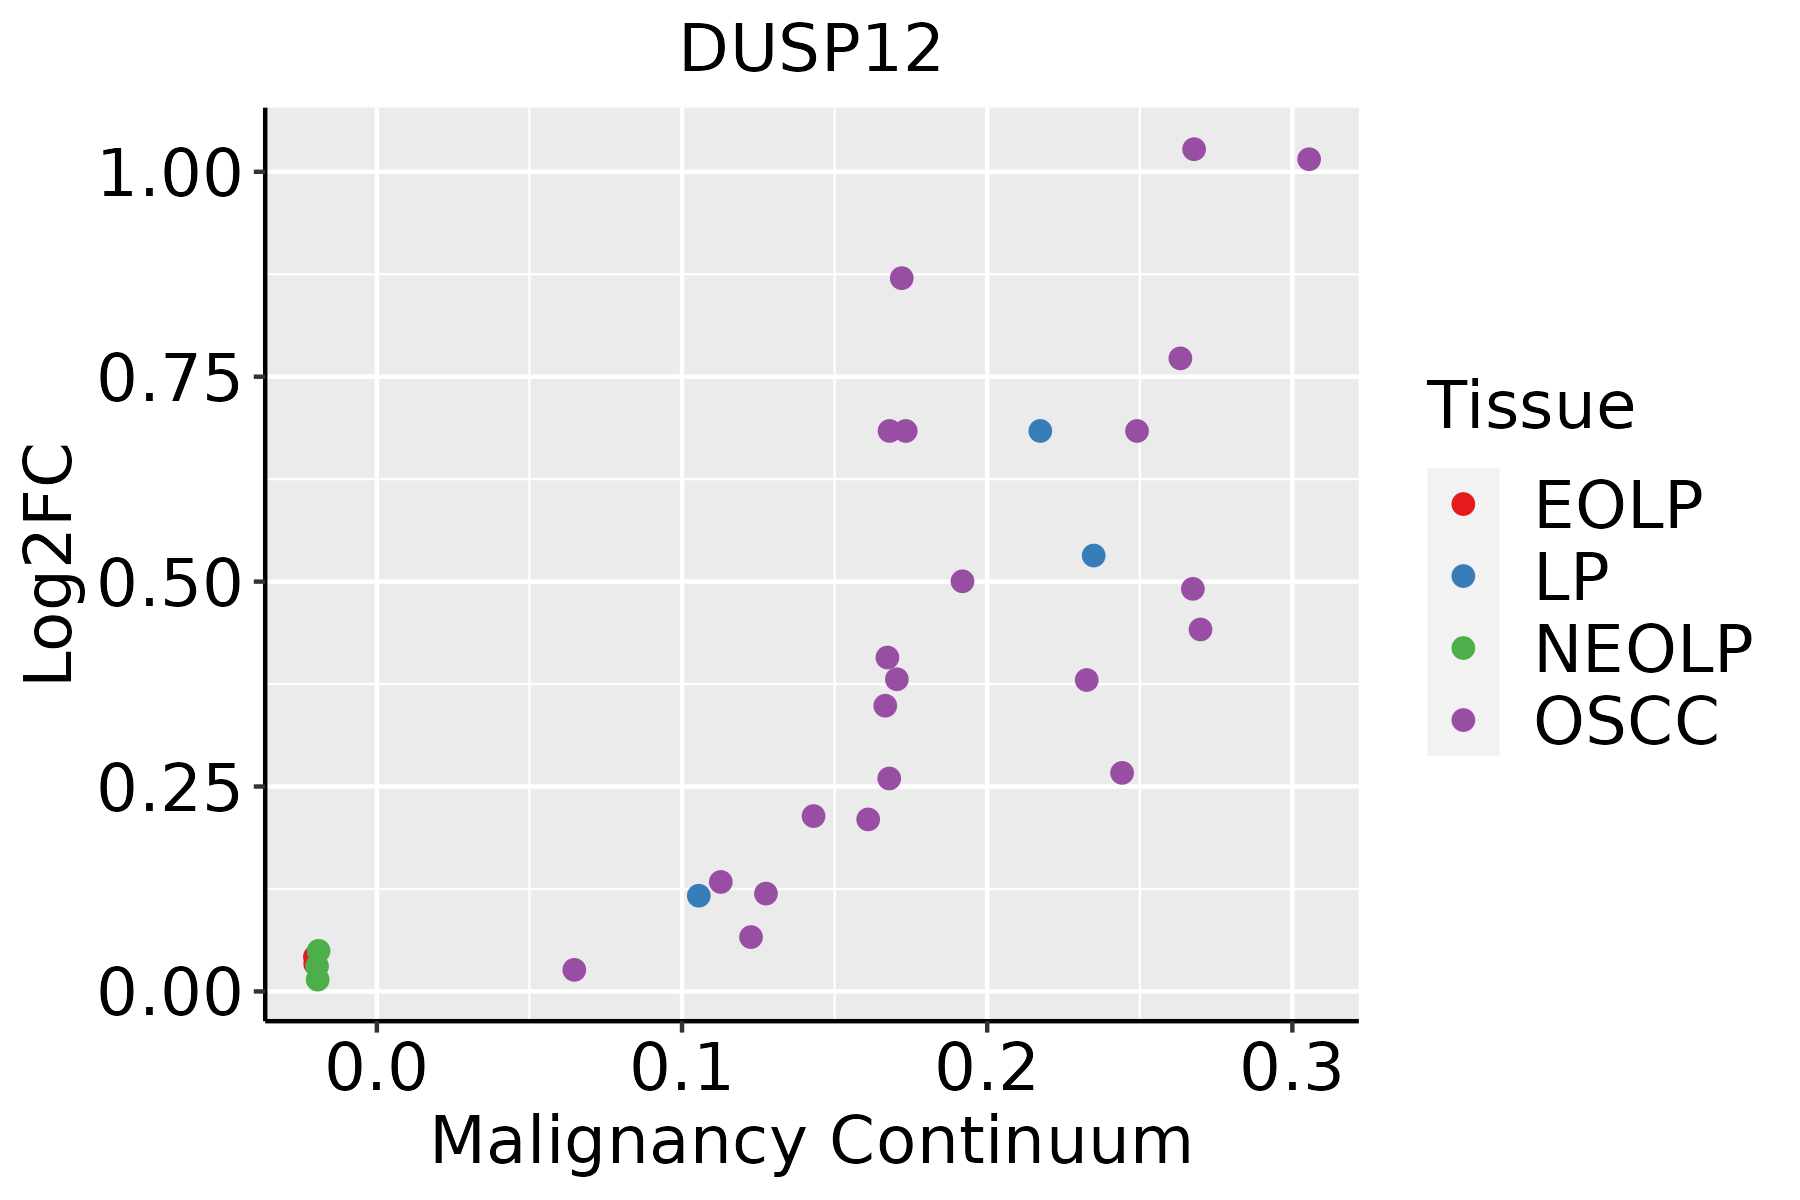
EOLP: Erosive Oral lichen planus
LP: leukoplakia
NEOLP: Non-erosive oral lichen planus
OSCC: Oral squamous cell carcinoma
SkinThe image shows the transcriptomic changes along malignancy continuum.log2FC in expression of this searched gene in stem-like cells from each diseased tissue sample relative to stem-like cells in normal samples in each tissue plotted against the malignancy continuum. Samples are colored based on if they are from different disease stage.
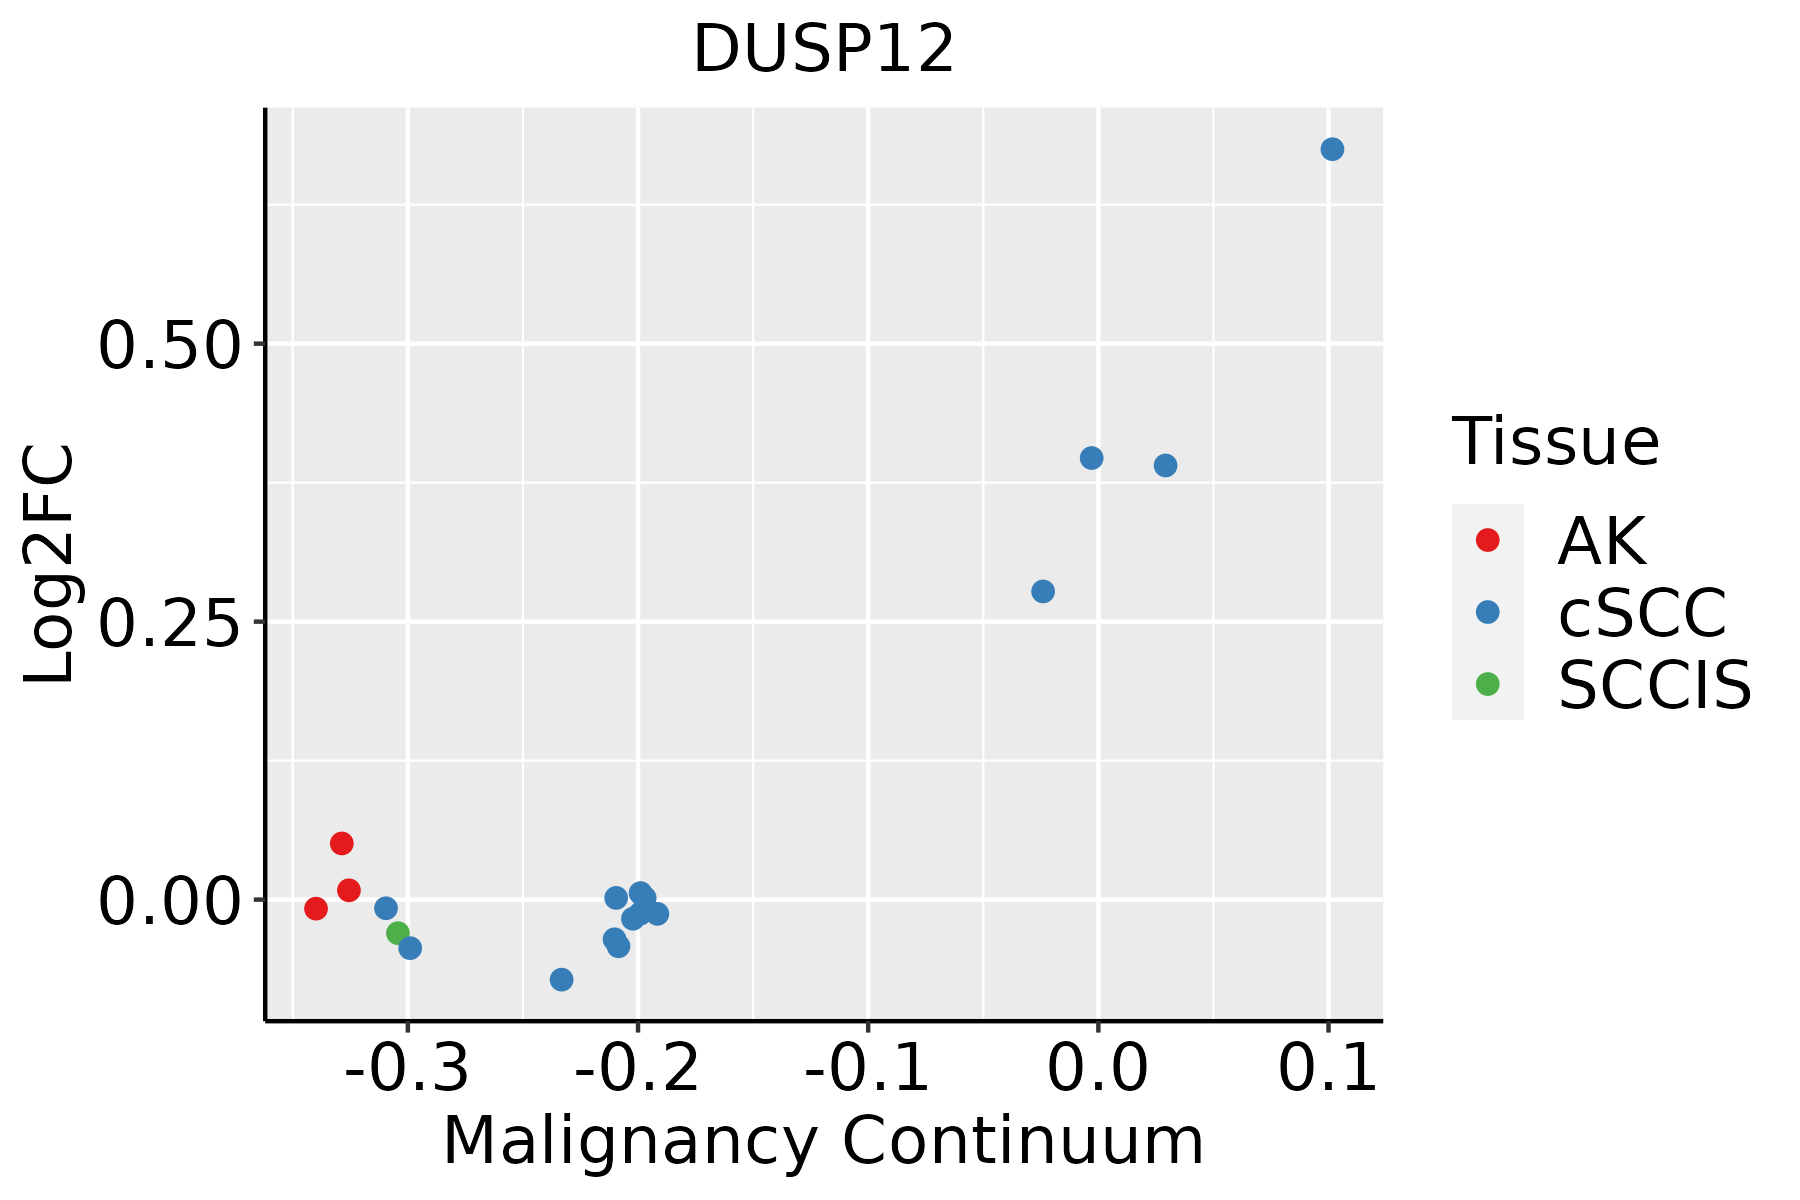
AK: Actinic keratosis
cSCC: Cutaneous squamous cell carcinoma
SCCIS:squamous cell carcinoma in situ
∗log2FC in expression of this searched gene in stem-like cells from each diseased tissue sample relative to stem-like cells in normal samples in each tissue plotted against the malignancy continuum. Samples are colored based on if they are from different disease stage.

Top

Malignant transformation related pathway analysis

check buttonFind out the enriched GO biological processes and KEGG pathways involved in transition from healthy to precancer to cancer
check button Figure of enriched GO biological processes.
TissueDisease StageEnriched GO biological Processes
ColorectumADGO analysis - Figure of enriched GO biological processes: Top 15 enriched GO BP terms are showed in the bar plot of each disease state in each tissue. Each row represents a significant GO biological process which is colored according to the -log10(p.adjust).
ColorectumSERGO analysis - Figure of enriched GO biological processes: Top 15 enriched GO BP terms are showed in the bar plot of each disease state in each tissue. Each row represents a significant GO biological process which is colored according to the -log10(p.adjust).
ColorectumMSSGO analysis - Figure of enriched GO biological processes: Top 15 enriched GO BP terms are showed in the bar plot of each disease state in each tissue. Each row represents a significant GO biological process which is colored according to the -log10(p.adjust).
ColorectumMSI-HGO analysis - Figure of enriched GO biological processes: Top 15 enriched GO BP terms are showed in the bar plot of each disease state in each tissue. Each row represents a significant GO biological process which is colored according to the -log10(p.adjust).
ColorectumFAPGO analysis - Figure of enriched GO biological processes: Top 15 enriched GO BP terms are showed in the bar plot of each disease state in each tissue. Each row represents a significant GO biological process which is colored according to the -log10(p.adjust).
∗Top 15 enriched GO BP terms are showed in the bar plot of each disease state in each tissue. Each row represents a significant GO biological process which is colored according to the -log10(p.adjust).
Page: 1 2 3 4 5 6 7 8 9 

check button Enriched GO biological processes.
GO IDTissueDisease StageDescriptionGene RatioBg Ratiopvaluep.adjustCount
GO:001631110EsophagusESCCdephosphorylation251/8552417/187231.26e-092.99e-08251
GO:000647018EsophagusESCCprotein dephosphorylation177/8552281/187233.13e-096.72e-08177
GO:00059969EsophagusESCCmonosaccharide metabolic process159/8552257/187231.11e-071.81e-06159
GO:00193189EsophagusESCChexose metabolic process147/8552237/187232.63e-073.94e-06147
GO:003367420EsophagusESCCpositive regulation of kinase activity260/8552467/187237.26e-067.22e-05260
GO:00060069EsophagusESCCglucose metabolic process119/8552196/187231.51e-051.36e-04119
GO:00442626EsophagusESCCcellular carbohydrate metabolic process160/8552283/187231.43e-049.66e-04160
GO:00620129EsophagusESCCregulation of small molecule metabolic process184/8552334/187233.11e-041.85e-03184
GO:00109065EsophagusESCCregulation of glucose metabolic process71/8552119/187231.46e-036.92e-0371
GO:00061096EsophagusESCCregulation of carbohydrate metabolic process101/8552178/187231.89e-038.52e-03101
GO:00106755EsophagusESCCregulation of cellular carbohydrate metabolic process83/8552146/187234.24e-031.69e-0283
GO:000599621LiverHCCmonosaccharide metabolic process167/7958257/187232.31e-131.25e-11167
GO:001931821LiverHCChexose metabolic process155/7958237/187237.63e-133.90e-11155
GO:000600621LiverHCCglucose metabolic process128/7958196/187238.60e-113.06e-09128
GO:006201222LiverHCCregulation of small molecule metabolic process190/7958334/187236.77e-081.40e-06190
GO:001631121LiverHCCdephosphorylation230/7958417/187231.00e-071.96e-06230
GO:000647021LiverHCCprotein dephosphorylation162/7958281/187231.91e-073.46e-06162
GO:000610921LiverHCCregulation of carbohydrate metabolic process109/7958178/187233.36e-075.78e-06109
GO:00109062LiverHCCregulation of glucose metabolic process76/7958119/187232.03e-062.79e-0576
GO:00106752LiverHCCregulation of cellular carbohydrate metabolic process88/7958146/187231.08e-051.24e-0488
Page: 1 2 

check button Enriched KEGG pathways.
Pathway IDTissueDisease StageDescriptionGene RatioBg Ratiopvaluep.adjustqvalueCount
Page: 1 

Top

Cell-cell communication analysis

check buttonIdentification of potential cell-cell interactions between two cell types and their ligand-receptor pairs for different disease states
LigandReceptorLRpairPathwayTissueDisease Stage
Page: 1 

Top

Single-cell gene regulatory network inference analysis

check buttonFind out the significant the regulons (TFs) and the target genes of each regulon across cell types for different disease states
TFCell TypeTissueDisease StageTarget GeneRSSRegulon Activity
∗The dot plots of a searched regulon are shown for all cell subpopulations in each disease state of each tissue based on the regulon specific score inferred using pySCENIC and by calculating the average expression.
Page: 1 

Top

Somatic mutation of malignant transformation related genes

check buttonAnnotation of somatic variants for genes involved in malignant transformation
Hugo SymbolVariant ClassVariant ClassificationdbSNP RSHGVScHGVSpHGVSp ShortSWISSPROTBIOTYPESIFTPolyPhenTumor Sample BarcodeTissueHistologySexAgeStageTherapy TypesDrugsOutcome
DUSP12SNVMissense_Mutationrs747507283c.548N>Ap.Arg183Hisp.R183HQ9UNI6protein_codingdeleterious(0)probably_damaging(0.94)TCGA-GM-A2D9-01Breastbreast invasive carcinomaFemale>=65I/IIHormone TherapyarimidexSD
DUSP12SNVMissense_Mutationc.545A>Gp.Tyr182Cysp.Y182CQ9UNI6protein_codingdeleterious(0)probably_damaging(0.921)TCGA-FU-A3HZ-01Cervixcervical & endocervical cancerFemale<65I/IIChemotherapycisplatinCR
DUSP12SNVMissense_Mutationnovelc.468N>Cp.Glu156Aspp.E156DQ9UNI6protein_codingtolerated(0.2)possibly_damaging(0.725)TCGA-VS-A94X-01Cervixcervical & endocervical cancerFemale<65I/IIChemotherapycisplatinPD
DUSP12SNVMissense_Mutationc.71N>Tp.Ala24Valp.A24VQ9UNI6protein_codingtolerated_low_confidence(0.12)benign(0)TCGA-AA-3663-01Colorectumcolon adenocarcinomaMale<65I/IIUnknownUnknownSD
DUSP12SNVMissense_Mutationc.998T>Cp.Leu333Serp.L333SQ9UNI6protein_codingtolerated(0.21)benign(0.025)TCGA-CM-5861-01Colorectumcolon adenocarcinomaFemale<65I/IIUnknownUnknownPD
DUSP12SNVMissense_Mutationrs778635807c.547N>Tp.Arg183Cysp.R183CQ9UNI6protein_codingdeleterious(0)probably_damaging(0.959)TCGA-EI-6917-01Colorectumrectum adenocarcinomaMale<65III/IVChemotherapy5fluorouracil+oxaciplatina+l-folinianSD
DUSP12SNVMissense_Mutationnovelc.78N>Tp.Gln26Hisp.Q26HQ9UNI6protein_codingtolerated_low_confidence(0.31)benign(0)TCGA-AJ-A3EL-01Endometriumuterine corpus endometrioid carcinomaFemale<65I/IIUnknownUnknownSD
DUSP12SNVMissense_Mutationnovelc.753N>Tp.Met251Ilep.M251IQ9UNI6protein_codingtolerated(0.62)benign(0)TCGA-AJ-A3EL-01Endometriumuterine corpus endometrioid carcinomaFemale<65I/IIUnknownUnknownSD
DUSP12SNVMissense_Mutationc.746A>Gp.Lys249Argp.K249RQ9UNI6protein_codingtolerated(0.21)possibly_damaging(0.566)TCGA-AP-A0LI-01Endometriumuterine corpus endometrioid carcinomaFemale>=65III/IVChemotherapypaclitaxelSD
DUSP12SNVMissense_Mutationnovelc.143N>Cp.Leu48Prop.L48PQ9UNI6protein_codingdeleterious(0)probably_damaging(1)TCGA-AP-A1DK-01Endometriumuterine corpus endometrioid carcinomaFemale<65I/IIUnknownUnknownSD
Page: 1 2 3 

Top

Related drugs of malignant transformation related genes

check buttonIdentification of chemicals and drugs interact with genes involved in malignant transfromation
(DGIdb 4.0)
Entrez IDSymbolCategoryInteraction TypesDrug Claim NameDrug NamePMIDs
Page: 1