
|
|||||
|
 | |
| |
| |
| |
| |
| |
|
Gene: DUSP11 |
Gene summary for DUSP11 |
| Gene information | Species | Human | Gene symbol | DUSP11 | Gene ID | 8446 |
| Gene name | dual specificity phosphatase 11 | |
| Gene Alias | PIR1 | |
| Cytomap | 2p13.1 | |
| Gene Type | protein-coding | GO ID | GO:0006139 | UniProtAcc | O75319 |
Top |
Malignant transformation analysis |
| Identification of the aberrant gene expression in precancerous and cancerous lesions by comparing the gene expression of stem-like cells in diseased tissues with normal stem cells |
| Entrez ID | Symbol | Replicates | Species | Organ | Tissue | Adj P-value | Log2FC | Malignancy |
| 8446 | DUSP11 | LZE2D | Human | Esophagus | HGIN | 1.70e-02 | 1.96e-01 | 0.0642 |
| 8446 | DUSP11 | LZE4T | Human | Esophagus | ESCC | 1.51e-21 | 6.08e-01 | 0.0811 |
| 8446 | DUSP11 | LZE7T | Human | Esophagus | ESCC | 5.04e-08 | 3.67e-01 | 0.0667 |
| 8446 | DUSP11 | LZE8T | Human | Esophagus | ESCC | 8.82e-14 | 2.32e-01 | 0.067 |
| 8446 | DUSP11 | LZE20T | Human | Esophagus | ESCC | 1.21e-08 | 1.78e-01 | 0.0662 |
| 8446 | DUSP11 | LZE22T | Human | Esophagus | ESCC | 5.41e-04 | 5.33e-01 | 0.068 |
| 8446 | DUSP11 | LZE24T | Human | Esophagus | ESCC | 1.44e-18 | 4.20e-01 | 0.0596 |
| 8446 | DUSP11 | LZE21T | Human | Esophagus | ESCC | 1.05e-03 | 4.39e-01 | 0.0655 |
| 8446 | DUSP11 | LZE6T | Human | Esophagus | ESCC | 1.04e-06 | 4.56e-01 | 0.0845 |
| 8446 | DUSP11 | P1T-E | Human | Esophagus | ESCC | 1.84e-03 | 4.45e-01 | 0.0875 |
| 8446 | DUSP11 | P2T-E | Human | Esophagus | ESCC | 3.32e-38 | 7.39e-01 | 0.1177 |
| 8446 | DUSP11 | P4T-E | Human | Esophagus | ESCC | 7.06e-30 | 7.91e-01 | 0.1323 |
| 8446 | DUSP11 | P5T-E | Human | Esophagus | ESCC | 6.45e-27 | 5.16e-01 | 0.1327 |
| 8446 | DUSP11 | P8T-E | Human | Esophagus | ESCC | 4.84e-22 | 3.49e-01 | 0.0889 |
| 8446 | DUSP11 | P9T-E | Human | Esophagus | ESCC | 3.13e-16 | 2.53e-01 | 0.1131 |
| 8446 | DUSP11 | P10T-E | Human | Esophagus | ESCC | 9.83e-28 | 4.51e-01 | 0.116 |
| 8446 | DUSP11 | P11T-E | Human | Esophagus | ESCC | 1.42e-19 | 5.95e-01 | 0.1426 |
| 8446 | DUSP11 | P12T-E | Human | Esophagus | ESCC | 6.32e-25 | 5.14e-01 | 0.1122 |
| 8446 | DUSP11 | P15T-E | Human | Esophagus | ESCC | 2.89e-28 | 6.58e-01 | 0.1149 |
| 8446 | DUSP11 | P16T-E | Human | Esophagus | ESCC | 6.53e-19 | 4.60e-01 | 0.1153 |
| Page: 1 2 3 4 5 |
| Tissue | Expression Dynamics | Abbreviation |
| Esophagus | 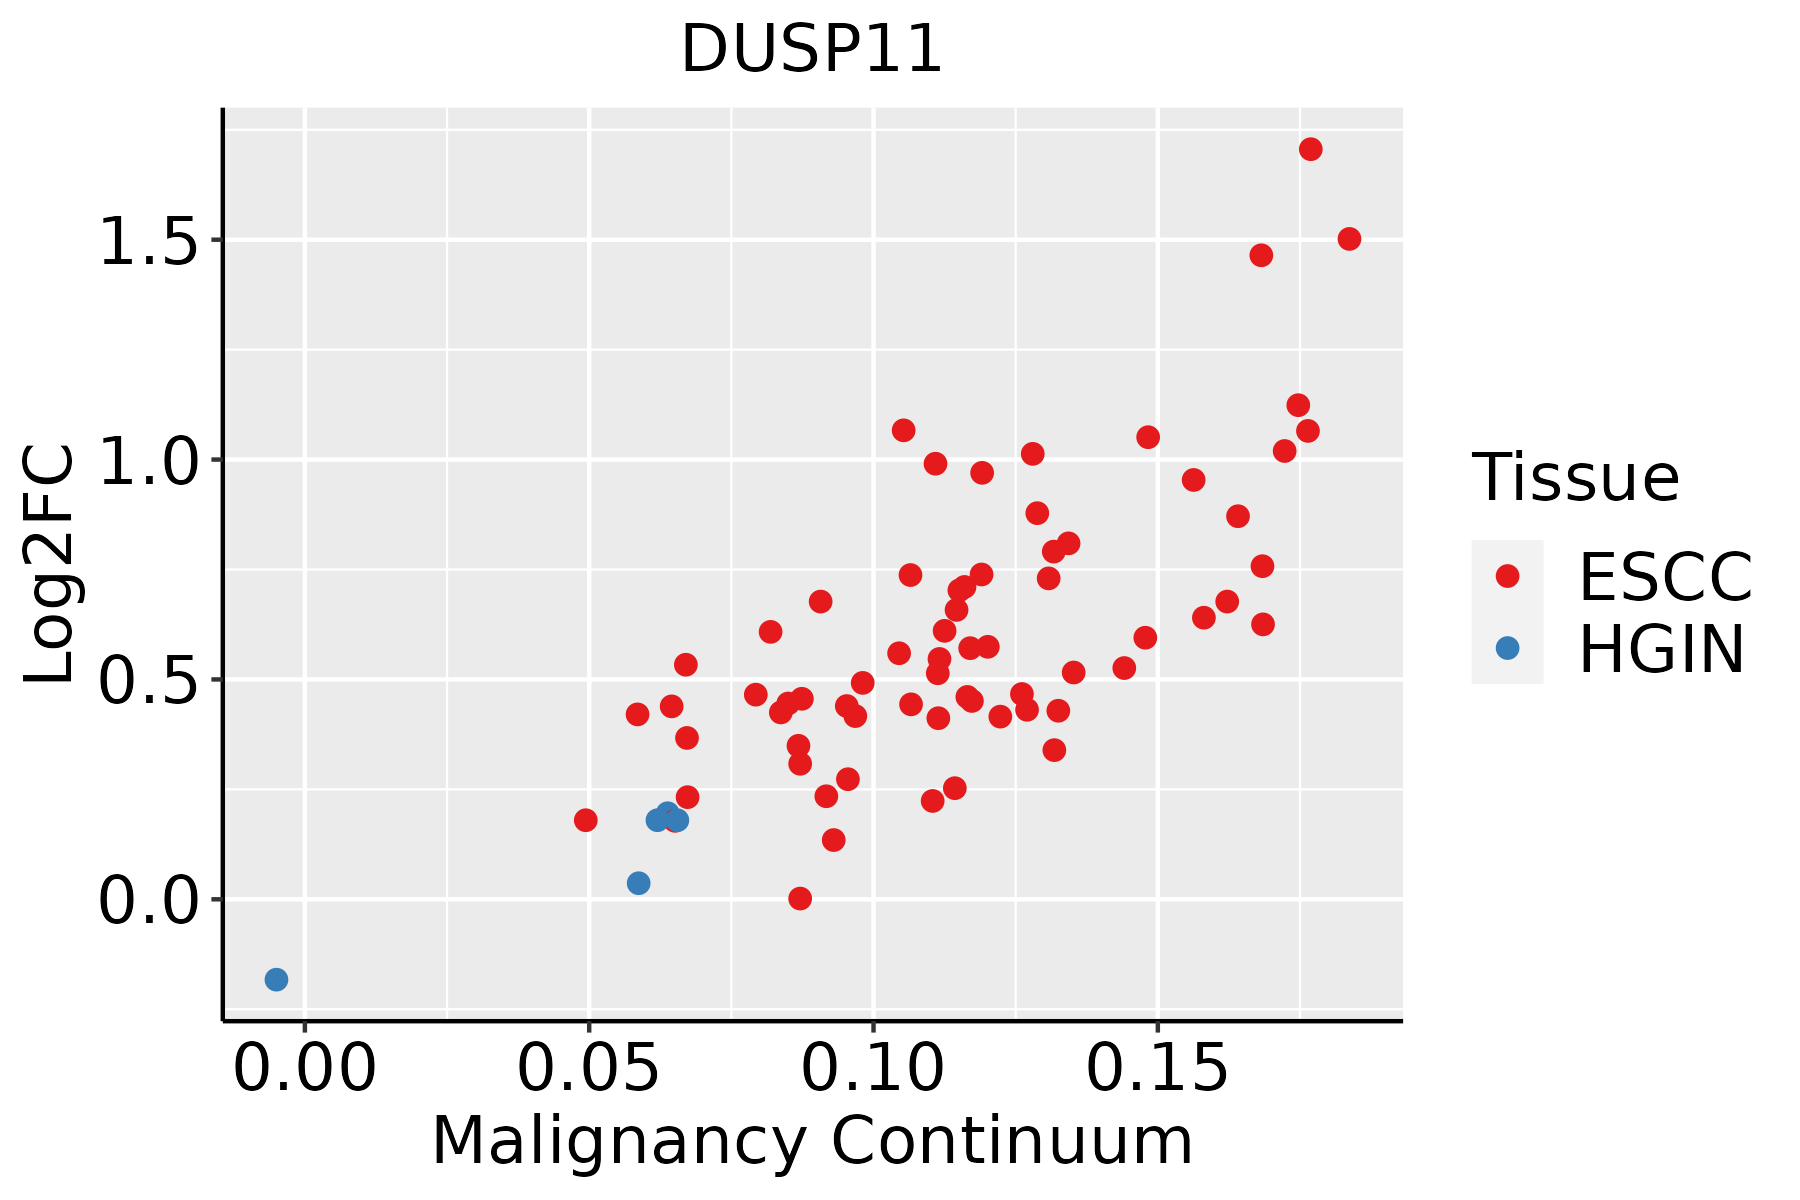 | ESCC: Esophageal squamous cell carcinoma |
| HGIN: High-grade intraepithelial neoplasias | ||
| LGIN: Low-grade intraepithelial neoplasias | ||
| Liver | 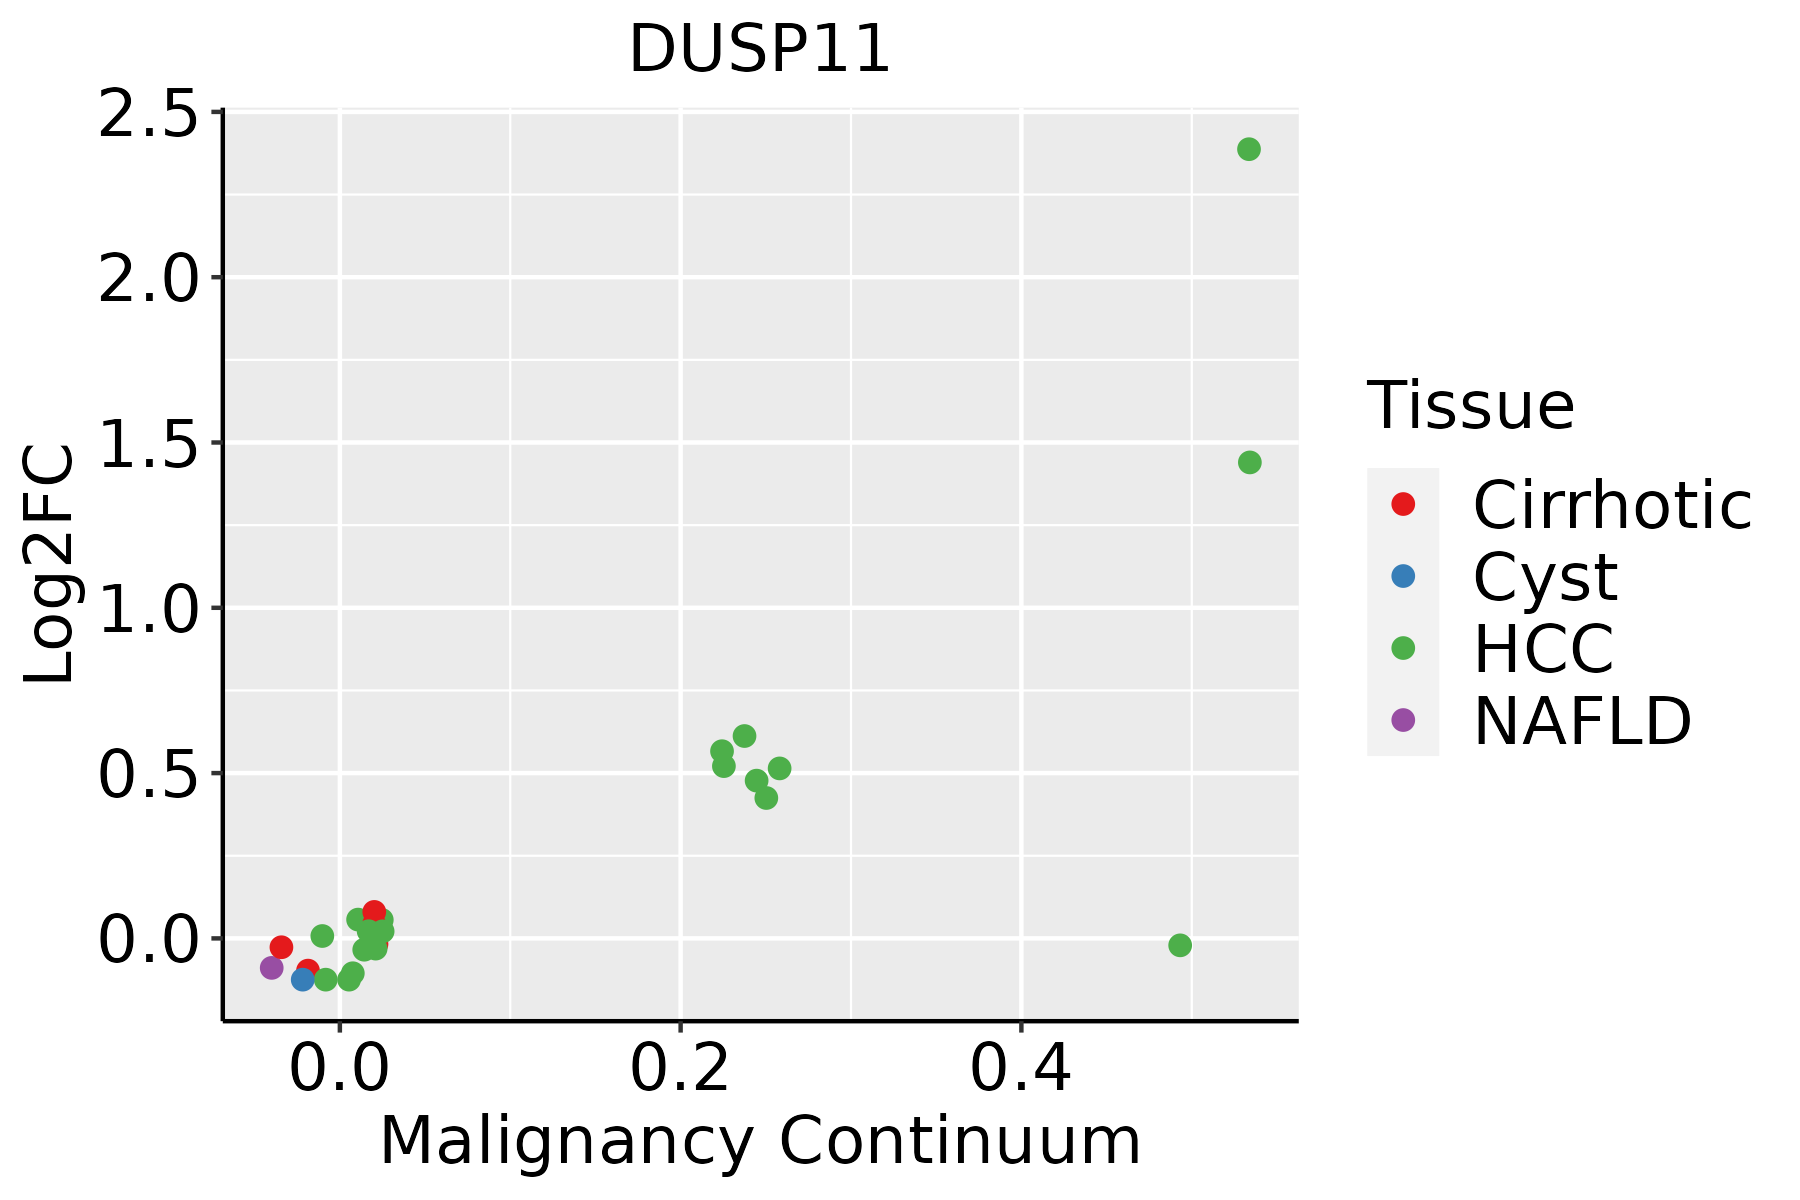 | HCC: Hepatocellular carcinoma |
| NAFLD: Non-alcoholic fatty liver disease | ||
| Oral Cavity | 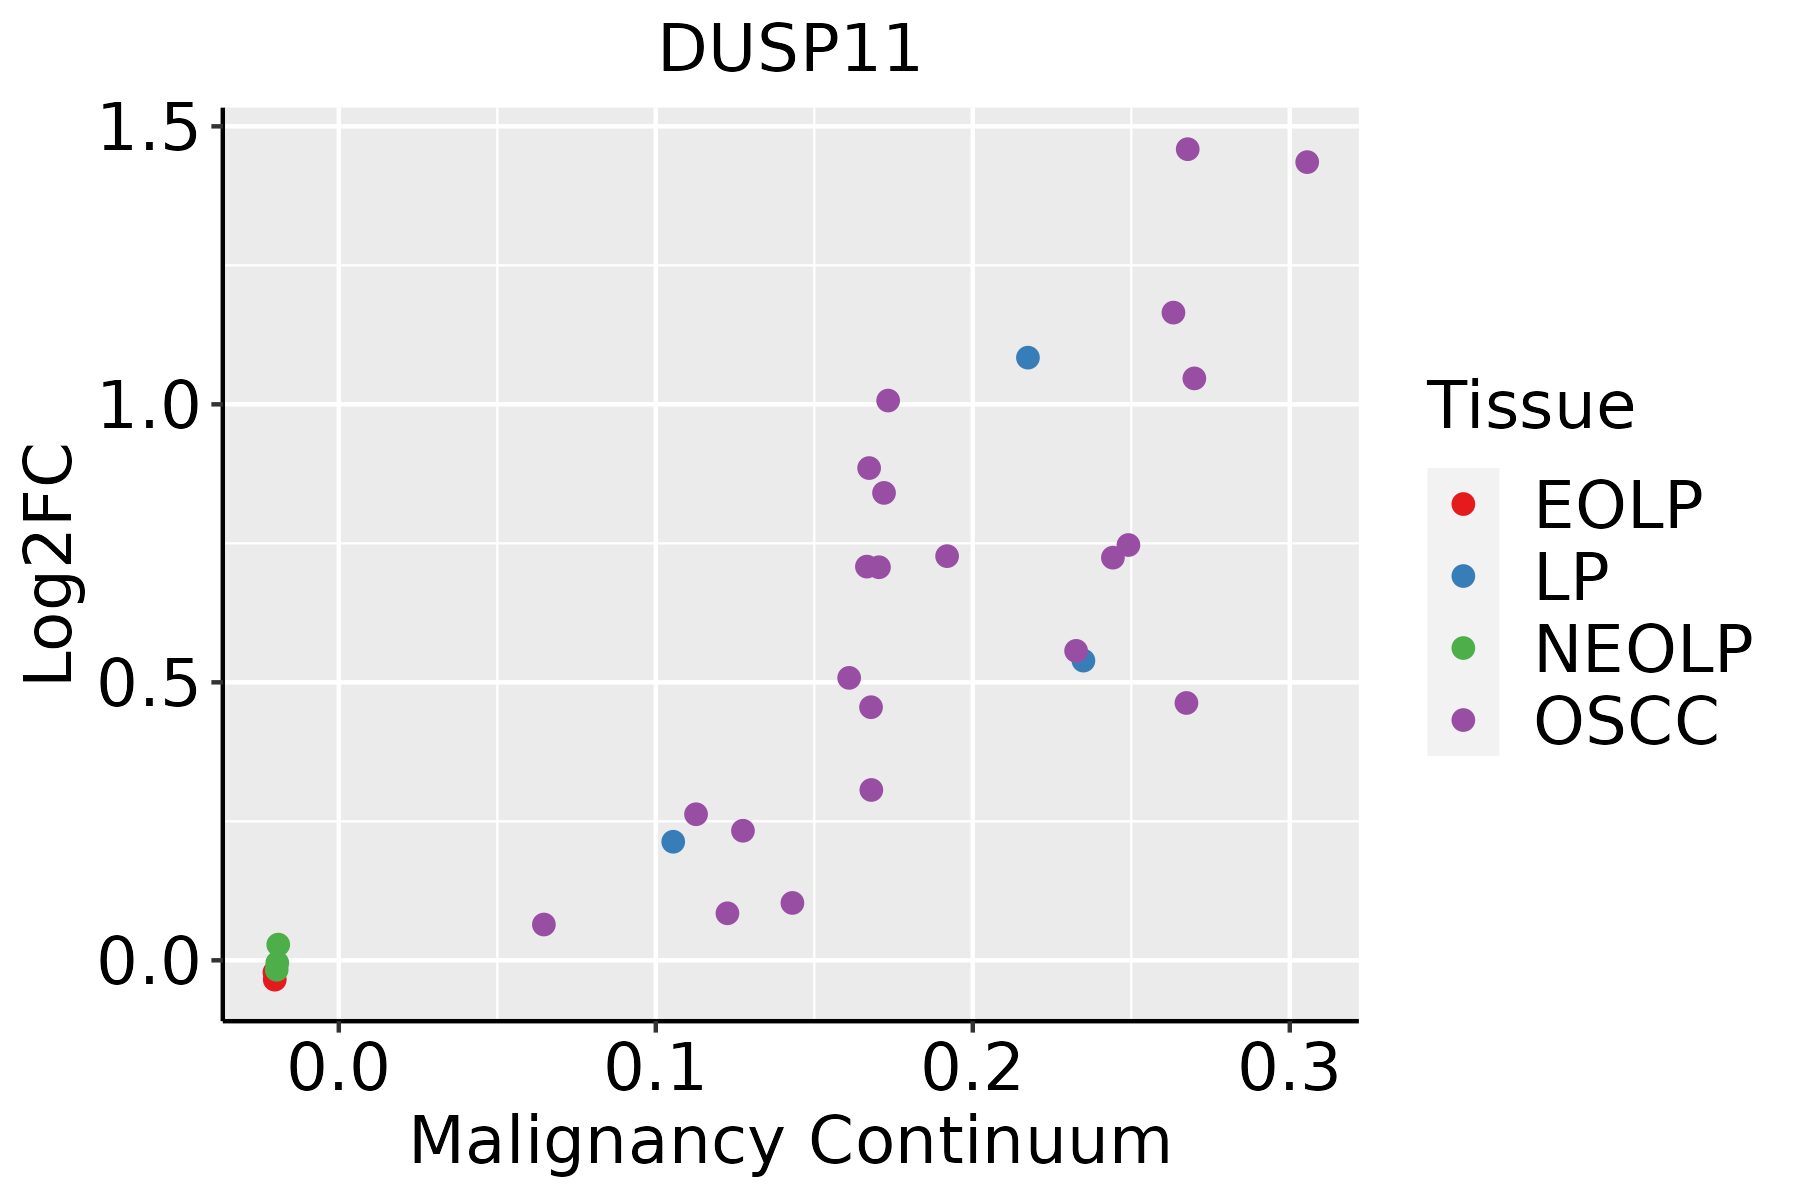 | EOLP: Erosive Oral lichen planus |
| LP: leukoplakia | ||
| NEOLP: Non-erosive oral lichen planus | ||
| OSCC: Oral squamous cell carcinoma | ||
| Skin |  | AK: Actinic keratosis |
| cSCC: Cutaneous squamous cell carcinoma | ||
| SCCIS:squamous cell carcinoma in situ |
| ∗log2FC in expression of this searched gene in stem-like cells from each diseased tissue sample relative to stem-like cells in normal samples in each tissue plotted against the malignancy continuum. Samples are colored based on if they are from different disease stage. |
Top |
Malignant transformation related pathway analysis |
| Find out the enriched GO biological processes and KEGG pathways involved in transition from healthy to precancer to cancer |
| Tissue | Disease Stage | Enriched GO biological Processes |
| Colorectum | AD |  |
| Colorectum | SER |  |
| Colorectum | MSS |  |
| Colorectum | MSI-H |  |
| Colorectum | FAP |  |
| ∗Top 15 enriched GO BP terms are showed in the bar plot of each disease state in each tissue. Each row represents a significant GO biological process which is colored according to the -log10(p.adjust). |
| Page: 1 2 3 4 5 6 7 8 9 |
| GO ID | Tissue | Disease Stage | Description | Gene Ratio | Bg Ratio | pvalue | p.adjust | Count |
| GO:000647017 | Esophagus | HGIN | protein dephosphorylation | 61/2587 | 281/18723 | 1.86e-04 | 3.51e-03 | 61 |
| GO:001631110 | Esophagus | ESCC | dephosphorylation | 251/8552 | 417/18723 | 1.26e-09 | 2.99e-08 | 251 |
| GO:000647018 | Esophagus | ESCC | protein dephosphorylation | 177/8552 | 281/18723 | 3.13e-09 | 6.72e-08 | 177 |
| GO:000647011 | Liver | Cirrhotic | protein dephosphorylation | 96/4634 | 281/18723 | 2.32e-04 | 2.11e-03 | 96 |
| GO:001631111 | Liver | Cirrhotic | dephosphorylation | 130/4634 | 417/18723 | 1.58e-03 | 1.03e-02 | 130 |
| GO:001631121 | Liver | HCC | dephosphorylation | 230/7958 | 417/18723 | 1.00e-07 | 1.96e-06 | 230 |
| GO:000647021 | Liver | HCC | protein dephosphorylation | 162/7958 | 281/18723 | 1.91e-07 | 3.46e-06 | 162 |
| GO:000647015 | Oral cavity | OSCC | protein dephosphorylation | 162/7305 | 281/18723 | 1.56e-10 | 4.56e-09 | 162 |
| GO:00163119 | Oral cavity | OSCC | dephosphorylation | 220/7305 | 417/18723 | 6.33e-09 | 1.34e-07 | 220 |
| GO:000647016 | Oral cavity | LP | protein dephosphorylation | 89/4623 | 281/18723 | 4.60e-03 | 2.93e-02 | 89 |
| GO:000647024 | Skin | cSCC | protein dephosphorylation | 111/4864 | 281/18723 | 4.10e-07 | 7.96e-06 | 111 |
| GO:001631115 | Skin | cSCC | dephosphorylation | 134/4864 | 417/18723 | 2.65e-03 | 1.50e-02 | 134 |
| Page: 1 |
| Pathway ID | Tissue | Disease Stage | Description | Gene Ratio | Bg Ratio | pvalue | p.adjust | qvalue | Count |
| Page: 1 |
Top |
Cell-cell communication analysis |
| Identification of potential cell-cell interactions between two cell types and their ligand-receptor pairs for different disease states |
| Ligand | Receptor | LRpair | Pathway | Tissue | Disease Stage |
| Page: 1 |
Top |
Single-cell gene regulatory network inference analysis |
| Find out the significant the regulons (TFs) and the target genes of each regulon across cell types for different disease states |
| TF | Cell Type | Tissue | Disease Stage | Target Gene | RSS | Regulon Activity |
| ∗The dot plots of a searched regulon are shown for all cell subpopulations in each disease state of each tissue based on the regulon specific score inferred using pySCENIC and by calculating the average expression. |
| Page: 1 |
Top |
Somatic mutation of malignant transformation related genes |
| Annotation of somatic variants for genes involved in malignant transformation |
| Hugo Symbol | Variant Class | Variant Classification | dbSNP RS | HGVSc | HGVSp | HGVSp Short | SWISSPROT | BIOTYPE | SIFT | PolyPhen | Tumor Sample Barcode | Tissue | Histology | Sex | Age | Stage | Therapy Types | Drugs | Outcome |
| DUSP11 | SNV | Missense_Mutation | c.74N>T | p.Gly25Val | p.G25V | O75319 | protein_coding | deleterious_low_confidence(0.01) | benign(0.018) | TCGA-C5-A1MK-01 | Cervix | cervical & endocervical cancer | Female | >=65 | III/IV | Chemotherapy | carboplatin | PD | |
| DUSP11 | SNV | Missense_Mutation | c.55T>C | p.Cys19Arg | p.C19R | O75319 | protein_coding | deleterious_low_confidence(0.04) | benign(0.018) | TCGA-AU-6004-01 | Colorectum | colon adenocarcinoma | Female | >=65 | I/II | Unknown | Unknown | SD | |
| DUSP11 | SNV | Missense_Mutation | novel | c.146N>A | p.Ser49Asn | p.S49N | O75319 | protein_coding | tolerated_low_confidence(0.29) | benign(0.065) | TCGA-CA-6717-01 | Colorectum | colon adenocarcinoma | Male | <65 | I/II | Chemotherapy | oxaliplatin | CR |
| DUSP11 | SNV | Missense_Mutation | novel | c.628A>C | p.Ile210Leu | p.I210L | O75319 | protein_coding | deleterious(0.01) | possibly_damaging(0.756) | TCGA-CM-6163-01 | Colorectum | colon adenocarcinoma | Male | >=65 | I/II | Unknown | Unknown | SD |
| DUSP11 | SNV | Missense_Mutation | novel | c.581N>G | p.Leu194Arg | p.L194R | O75319 | protein_coding | deleterious(0) | probably_damaging(0.997) | TCGA-AG-A002-01 | Colorectum | rectum adenocarcinoma | Male | <65 | I/II | Unknown | Unknown | SD |
| DUSP11 | SNV | Missense_Mutation | c.516N>T | p.Glu172Asp | p.E172D | O75319 | protein_coding | tolerated(1) | benign(0.001) | TCGA-AG-A002-01 | Colorectum | rectum adenocarcinoma | Male | <65 | I/II | Unknown | Unknown | SD | |
| DUSP11 | SNV | Missense_Mutation | c.330N>T | p.Lys110Asn | p.K110N | O75319 | protein_coding | tolerated(0.28) | benign(0.022) | TCGA-A5-A2K5-01 | Endometrium | uterine corpus endometrioid carcinoma | Female | >=65 | I/II | Unknown | Unknown | SD | |
| DUSP11 | SNV | Missense_Mutation | rs754738933 | c.893N>A | p.Arg298Gln | p.R298Q | O75319 | protein_coding | tolerated_low_confidence(0.25) | benign(0.005) | TCGA-AP-A0LM-01 | Endometrium | uterine corpus endometrioid carcinoma | Female | <65 | III/IV | Chemotherapy | cisplatin | SD |
| DUSP11 | SNV | Missense_Mutation | rs770537593 | c.64N>C | p.Ser22Pro | p.S22P | O75319 | protein_coding | tolerated_low_confidence(0.32) | benign(0.003) | TCGA-AP-A1DV-01 | Endometrium | uterine corpus endometrioid carcinoma | Female | <65 | I/II | Unknown | Unknown | SD |
| DUSP11 | SNV | Missense_Mutation | novel | c.938N>C | p.Lys313Thr | p.K313T | O75319 | protein_coding | tolerated_low_confidence(0.07) | benign(0.012) | TCGA-B5-A11N-01 | Endometrium | uterine corpus endometrioid carcinoma | Female | >=65 | I/II | Unknown | Unknown | SD |
| Page: 1 2 3 |
Top |
Related drugs of malignant transformation related genes |
| Identification of chemicals and drugs interact with genes involved in malignant transfromation |
| (DGIdb 4.0) |
| Entrez ID | Symbol | Category | Interaction Types | Drug Claim Name | Drug Name | PMIDs |
| Page: 1 |

Copyright 2023-Present -The University of Texas Health Science Center at Houston |