
|
|||||
|
 | |
| |
| |
| |
| |
| |
|
Gene: DUSP10 |
Gene summary for DUSP10 |
| Gene information | Species | Human | Gene symbol | DUSP10 | Gene ID | 11221 |
| Gene name | dual specificity phosphatase 10 | |
| Gene Alias | MKP-5 | |
| Cytomap | 1q41 | |
| Gene Type | protein-coding | GO ID | GO:0000165 | UniProtAcc | Q9Y6W6 |
Top |
Malignant transformation analysis |
| Identification of the aberrant gene expression in precancerous and cancerous lesions by comparing the gene expression of stem-like cells in diseased tissues with normal stem cells |
| Entrez ID | Symbol | Replicates | Species | Organ | Tissue | Adj P-value | Log2FC | Malignancy |
| 11221 | DUSP10 | LZE4T | Human | Esophagus | ESCC | 9.35e-10 | 5.23e-01 | 0.0811 |
| 11221 | DUSP10 | LZE7T | Human | Esophagus | ESCC | 3.30e-06 | 7.64e-01 | 0.0667 |
| 11221 | DUSP10 | LZE20T | Human | Esophagus | ESCC | 1.92e-04 | 1.30e-01 | 0.0662 |
| 11221 | DUSP10 | LZE24T | Human | Esophagus | ESCC | 1.56e-02 | 2.07e-01 | 0.0596 |
| 11221 | DUSP10 | LZE21T | Human | Esophagus | ESCC | 2.60e-02 | 5.87e-01 | 0.0655 |
| 11221 | DUSP10 | LZE6T | Human | Esophagus | ESCC | 5.83e-03 | 3.31e-01 | 0.0845 |
| 11221 | DUSP10 | P2T-E | Human | Esophagus | ESCC | 1.73e-12 | 4.12e-01 | 0.1177 |
| 11221 | DUSP10 | P5T-E | Human | Esophagus | ESCC | 1.68e-10 | 1.13e-01 | 0.1327 |
| 11221 | DUSP10 | P8T-E | Human | Esophagus | ESCC | 4.51e-13 | 4.61e-01 | 0.0889 |
| 11221 | DUSP10 | P9T-E | Human | Esophagus | ESCC | 1.11e-05 | 2.18e-01 | 0.1131 |
| 11221 | DUSP10 | P10T-E | Human | Esophagus | ESCC | 1.44e-05 | 2.26e-01 | 0.116 |
| 11221 | DUSP10 | P11T-E | Human | Esophagus | ESCC | 2.14e-12 | 1.27e+00 | 0.1426 |
| 11221 | DUSP10 | P12T-E | Human | Esophagus | ESCC | 1.40e-02 | 1.09e-01 | 0.1122 |
| 11221 | DUSP10 | P15T-E | Human | Esophagus | ESCC | 1.45e-04 | 1.59e-01 | 0.1149 |
| 11221 | DUSP10 | P16T-E | Human | Esophagus | ESCC | 1.92e-06 | 1.11e-01 | 0.1153 |
| 11221 | DUSP10 | P20T-E | Human | Esophagus | ESCC | 5.61e-07 | 3.36e-01 | 0.1124 |
| 11221 | DUSP10 | P21T-E | Human | Esophagus | ESCC | 5.00e-19 | 7.05e-01 | 0.1617 |
| 11221 | DUSP10 | P22T-E | Human | Esophagus | ESCC | 1.31e-09 | 1.19e-01 | 0.1236 |
| 11221 | DUSP10 | P23T-E | Human | Esophagus | ESCC | 3.76e-05 | 4.54e-01 | 0.108 |
| 11221 | DUSP10 | P24T-E | Human | Esophagus | ESCC | 3.52e-06 | 2.80e-01 | 0.1287 |
| Page: 1 2 3 4 |
| Tissue | Expression Dynamics | Abbreviation |
| Esophagus | 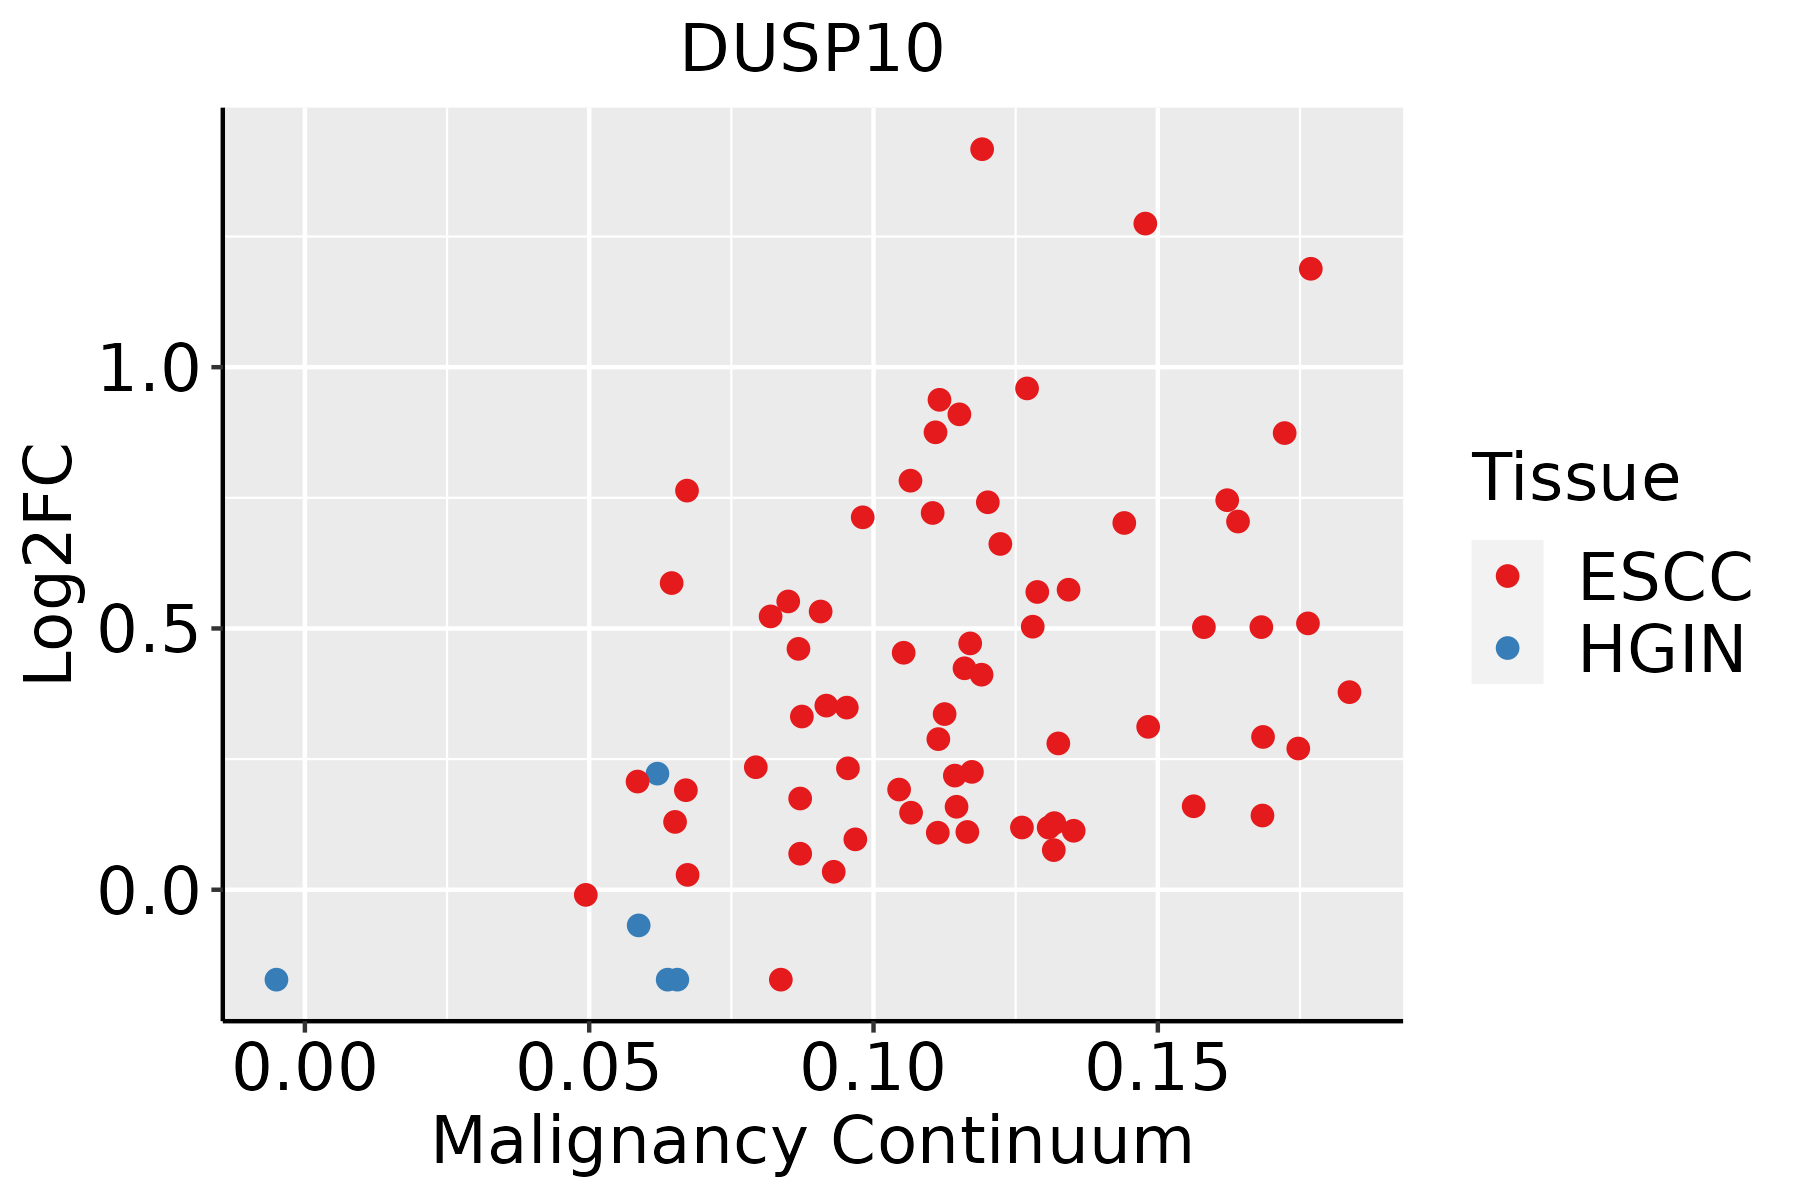 | ESCC: Esophageal squamous cell carcinoma |
| HGIN: High-grade intraepithelial neoplasias | ||
| LGIN: Low-grade intraepithelial neoplasias | ||
| Liver | 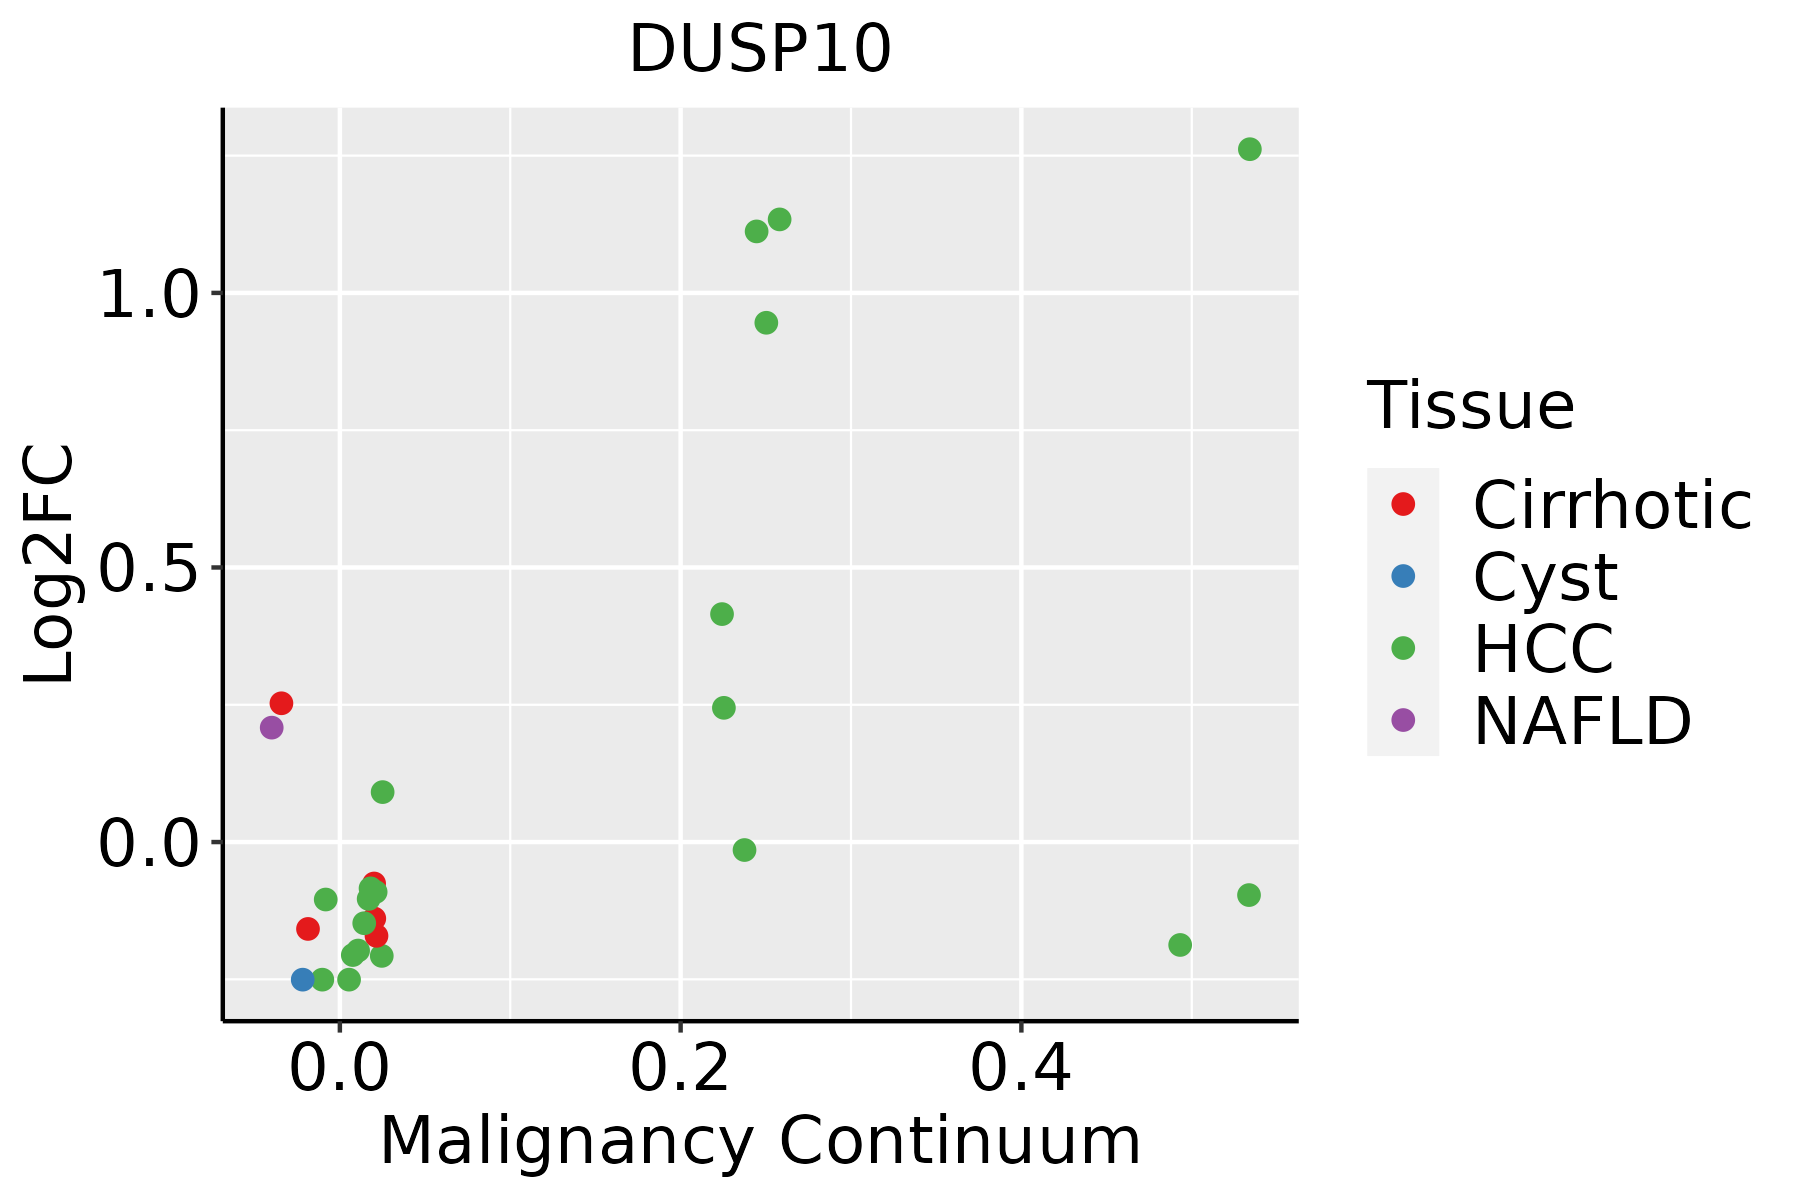 | HCC: Hepatocellular carcinoma |
| NAFLD: Non-alcoholic fatty liver disease | ||
| Oral Cavity | 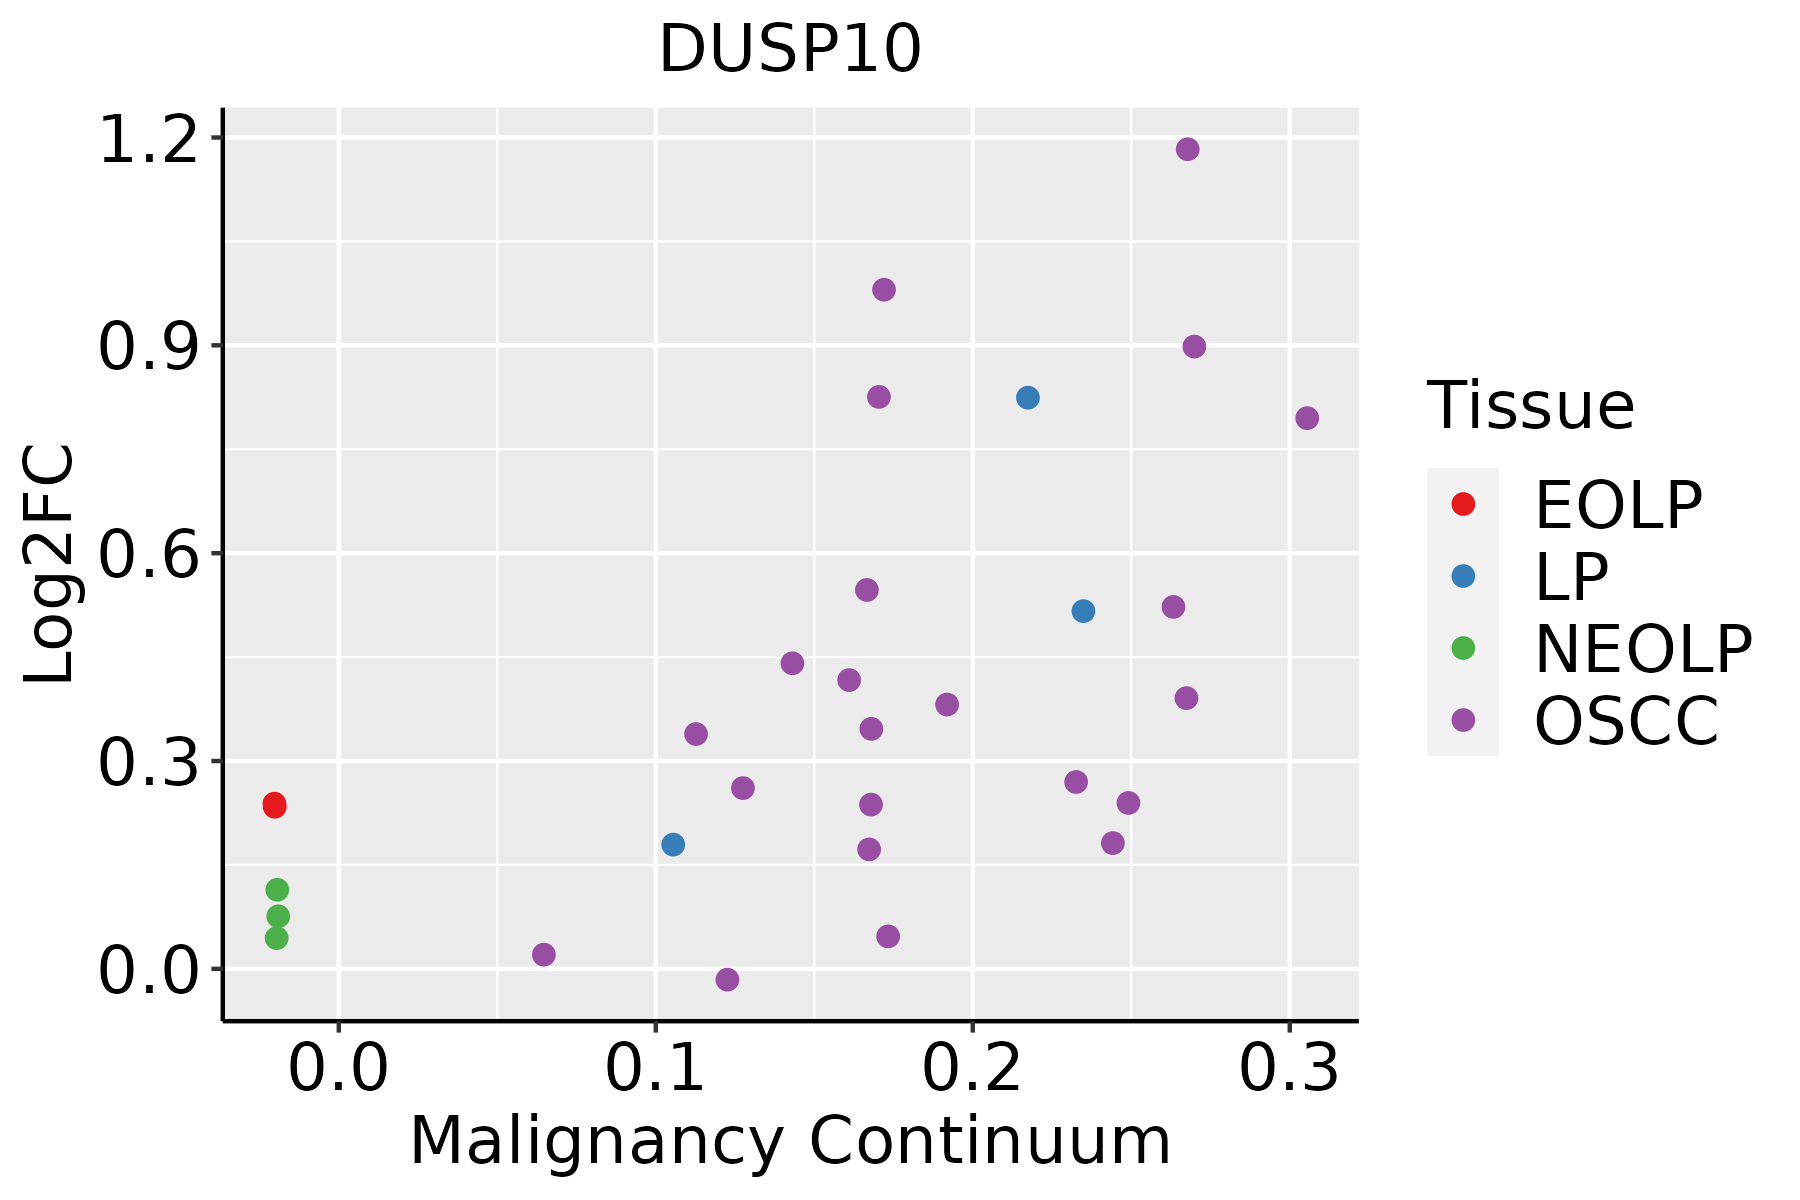 | EOLP: Erosive Oral lichen planus |
| LP: leukoplakia | ||
| NEOLP: Non-erosive oral lichen planus | ||
| OSCC: Oral squamous cell carcinoma |
| ∗log2FC in expression of this searched gene in stem-like cells from each diseased tissue sample relative to stem-like cells in normal samples in each tissue plotted against the malignancy continuum. Samples are colored based on if they are from different disease stage. |
Top |
Malignant transformation related pathway analysis |
| Find out the enriched GO biological processes and KEGG pathways involved in transition from healthy to precancer to cancer |
| Tissue | Disease Stage | Enriched GO biological Processes |
| Colorectum | AD |  |
| Colorectum | SER |  |
| Colorectum | MSS |  |
| Colorectum | MSI-H |  |
| Colorectum | FAP |  |
| ∗Top 15 enriched GO BP terms are showed in the bar plot of each disease state in each tissue. Each row represents a significant GO biological process which is colored according to the -log10(p.adjust). |
| Page: 1 2 3 4 5 6 7 8 9 |
| GO ID | Tissue | Disease Stage | Description | Gene Ratio | Bg Ratio | pvalue | p.adjust | Count |
| GO:0010563111 | Esophagus | ESCC | negative regulation of phosphorus metabolic process | 274/8552 | 442/18723 | 2.32e-12 | 9.41e-11 | 274 |
| GO:0045936111 | Esophagus | ESCC | negative regulation of phosphate metabolic process | 273/8552 | 441/18723 | 3.18e-12 | 1.25e-10 | 273 |
| GO:0051348111 | Esophagus | ESCC | negative regulation of transferase activity | 177/8552 | 268/18723 | 1.08e-11 | 4.00e-10 | 177 |
| GO:007190016 | Esophagus | ESCC | regulation of protein serine/threonine kinase activity | 227/8552 | 359/18723 | 1.12e-11 | 4.10e-10 | 227 |
| GO:0042326111 | Esophagus | ESCC | negative regulation of phosphorylation | 237/8552 | 385/18723 | 1.86e-10 | 5.33e-09 | 237 |
| GO:0001933111 | Esophagus | ESCC | negative regulation of protein phosphorylation | 213/8552 | 342/18723 | 3.54e-10 | 9.76e-09 | 213 |
| GO:001631110 | Esophagus | ESCC | dephosphorylation | 251/8552 | 417/18723 | 1.26e-09 | 2.99e-08 | 251 |
| GO:003367319 | Esophagus | ESCC | negative regulation of kinase activity | 154/8552 | 237/18723 | 1.38e-09 | 3.27e-08 | 154 |
| GO:000646920 | Esophagus | ESCC | negative regulation of protein kinase activity | 140/8552 | 212/18723 | 1.53e-09 | 3.56e-08 | 140 |
| GO:000647018 | Esophagus | ESCC | protein dephosphorylation | 177/8552 | 281/18723 | 3.13e-09 | 6.72e-08 | 177 |
| GO:004578527 | Esophagus | ESCC | positive regulation of cell adhesion | 255/8552 | 437/18723 | 5.07e-08 | 9.11e-07 | 255 |
| GO:003109818 | Esophagus | ESCC | stress-activated protein kinase signaling cascade | 154/8552 | 247/18723 | 8.53e-08 | 1.44e-06 | 154 |
| GO:005140318 | Esophagus | ESCC | stress-activated MAPK cascade | 147/8552 | 239/18723 | 5.43e-07 | 7.18e-06 | 147 |
| GO:00028318 | Esophagus | ESCC | regulation of response to biotic stimulus | 191/8552 | 327/18723 | 2.12e-06 | 2.45e-05 | 191 |
| GO:003109910 | Esophagus | ESCC | regeneration | 122/8552 | 198/18723 | 4.26e-06 | 4.57e-05 | 122 |
| GO:00459267 | Esophagus | ESCC | negative regulation of growth | 148/8552 | 249/18723 | 7.88e-06 | 7.73e-05 | 148 |
| GO:000283212 | Esophagus | ESCC | negative regulation of response to biotic stimulus | 72/8552 | 108/18723 | 8.36e-06 | 8.11e-05 | 72 |
| GO:007030217 | Esophagus | ESCC | regulation of stress-activated protein kinase signaling cascade | 119/8552 | 195/18723 | 1.07e-05 | 1.01e-04 | 119 |
| GO:003287217 | Esophagus | ESCC | regulation of stress-activated MAPK cascade | 116/8552 | 192/18723 | 2.63e-05 | 2.21e-04 | 116 |
| GO:00454449 | Esophagus | ESCC | fat cell differentiation | 135/8552 | 229/18723 | 3.38e-05 | 2.78e-04 | 135 |
| Page: 1 2 3 4 5 6 7 8 9 10 11 12 13 14 15 16 17 |
| Pathway ID | Tissue | Disease Stage | Description | Gene Ratio | Bg Ratio | pvalue | p.adjust | qvalue | Count |
| hsa0401014 | Oral cavity | OSCC | MAPK signaling pathway | 165/3704 | 302/8465 | 7.11e-05 | 2.74e-04 | 1.40e-04 | 165 |
| hsa0401015 | Oral cavity | OSCC | MAPK signaling pathway | 165/3704 | 302/8465 | 7.11e-05 | 2.74e-04 | 1.40e-04 | 165 |
| hsa0401023 | Oral cavity | EOLP | MAPK signaling pathway | 68/1218 | 302/8465 | 7.48e-05 | 3.40e-04 | 2.01e-04 | 68 |
| hsa0401033 | Oral cavity | EOLP | MAPK signaling pathway | 68/1218 | 302/8465 | 7.48e-05 | 3.40e-04 | 2.01e-04 | 68 |
| Page: 1 |
Top |
Cell-cell communication analysis |
| Identification of potential cell-cell interactions between two cell types and their ligand-receptor pairs for different disease states |
| Ligand | Receptor | LRpair | Pathway | Tissue | Disease Stage |
| Page: 1 |
Top |
Single-cell gene regulatory network inference analysis |
| Find out the significant the regulons (TFs) and the target genes of each regulon across cell types for different disease states |
| TF | Cell Type | Tissue | Disease Stage | Target Gene | RSS | Regulon Activity |
| ∗The dot plots of a searched regulon are shown for all cell subpopulations in each disease state of each tissue based on the regulon specific score inferred using pySCENIC and by calculating the average expression. |
| Page: 1 |
Top |
Somatic mutation of malignant transformation related genes |
| Annotation of somatic variants for genes involved in malignant transformation |
| Hugo Symbol | Variant Class | Variant Classification | dbSNP RS | HGVSc | HGVSp | HGVSp Short | SWISSPROT | BIOTYPE | SIFT | PolyPhen | Tumor Sample Barcode | Tissue | Histology | Sex | Age | Stage | Therapy Types | Drugs | Outcome |
| DUSP10 | SNV | Missense_Mutation | c.20N>T | p.Asp7Val | p.D7V | Q9Y6W6 | protein_coding | deleterious_low_confidence(0) | probably_damaging(0.99) | TCGA-A8-A09Z-01 | Breast | breast invasive carcinoma | Female | >=65 | I/II | Unknown | Unknown | SD | |
| DUSP10 | SNV | Missense_Mutation | novel | c.1216A>T | p.Ile406Phe | p.I406F | Q9Y6W6 | protein_coding | deleterious(0) | probably_damaging(0.966) | TCGA-AC-A3W5-01 | Breast | breast invasive carcinoma | Female | >=65 | I/II | Chemotherapy | docetaxel | CR |
| DUSP10 | SNV | Missense_Mutation | rs765000706 | c.497N>C | p.His166Pro | p.H166P | Q9Y6W6 | protein_coding | deleterious(0.02) | benign(0.026) | TCGA-AO-A1KT-01 | Breast | breast invasive carcinoma | Female | >=65 | I/II | Chemotherapy | fluorouracil | SD |
| DUSP10 | SNV | Missense_Mutation | rs765000706 | c.497N>C | p.His166Pro | p.H166P | Q9Y6W6 | protein_coding | deleterious(0.02) | benign(0.026) | TCGA-B6-A0IB-01 | Breast | breast invasive carcinoma | Female | <65 | III/IV | Unknown | Unknown | PD |
| DUSP10 | SNV | Missense_Mutation | c.1001N>G | p.Glu334Gly | p.E334G | Q9Y6W6 | protein_coding | tolerated(0.08) | benign(0.023) | TCGA-BH-A0HA-01 | Breast | breast invasive carcinoma | Female | <65 | I/II | Unknown | Unknown | SD | |
| DUSP10 | SNV | Missense_Mutation | rs765000706 | c.497A>C | p.His166Pro | p.H166P | Q9Y6W6 | protein_coding | deleterious(0.02) | benign(0.026) | TCGA-BH-A0HO-01 | Breast | breast invasive carcinoma | Female | <65 | I/II | Chemotherapy | cyclophosphamide | SD |
| DUSP10 | SNV | Missense_Mutation | rs747708016 | c.722N>G | p.Asn241Ser | p.N241S | Q9Y6W6 | protein_coding | tolerated(0.76) | benign(0) | TCGA-C8-A1HI-01 | Breast | breast invasive carcinoma | Female | <65 | III/IV | Unknown | Unknown | SD |
| DUSP10 | SNV | Missense_Mutation | rs765000706 | c.497N>C | p.His166Pro | p.H166P | Q9Y6W6 | protein_coding | deleterious(0.02) | benign(0.026) | TCGA-C8-A273-01 | Breast | breast invasive carcinoma | Female | <65 | I/II | Hormone Therapy | tamoxiphen | SD |
| DUSP10 | SNV | Missense_Mutation | c.1369N>C | p.Glu457Gln | p.E457Q | Q9Y6W6 | protein_coding | deleterious(0.01) | probably_damaging(0.937) | TCGA-D8-A1JA-01 | Breast | breast invasive carcinoma | Female | <65 | III/IV | Chemotherapy | adriamycin | PD | |
| DUSP10 | SNV | Missense_Mutation | rs765000706 | c.497A>C | p.His166Pro | p.H166P | Q9Y6W6 | protein_coding | deleterious(0.02) | benign(0.026) | TCGA-D8-A1JT-01 | Breast | breast invasive carcinoma | Female | >=65 | I/II | Hormone Therapy | arimidex | SD |
| Page: 1 2 3 4 5 6 7 8 |
Top |
Related drugs of malignant transformation related genes |
| Identification of chemicals and drugs interact with genes involved in malignant transfromation |
| (DGIdb 4.0) |
| Entrez ID | Symbol | Category | Interaction Types | Drug Claim Name | Drug Name | PMIDs |
| Page: 1 |

Copyright 2023-Present -The University of Texas Health Science Center at Houston |