
|
|||||
|
 | |
| |
| |
| |
| |
| |
|
Gene: DUS3L |
Gene summary for DUS3L |
| Gene information | Species | Human | Gene symbol | DUS3L | Gene ID | 56931 |
| Gene name | dihydrouridine synthase 3 like | |
| Gene Alias | DUS3 | |
| Cytomap | 19p13.3 | |
| Gene Type | protein-coding | GO ID | GO:0002943 | UniProtAcc | Q96G46 |
Top |
Malignant transformation analysis |
| Identification of the aberrant gene expression in precancerous and cancerous lesions by comparing the gene expression of stem-like cells in diseased tissues with normal stem cells |
| Entrez ID | Symbol | Replicates | Species | Organ | Tissue | Adj P-value | Log2FC | Malignancy |
| 56931 | DUS3L | LZE2T | Human | Esophagus | ESCC | 1.41e-02 | 2.49e-01 | 0.082 |
| 56931 | DUS3L | LZE7T | Human | Esophagus | ESCC | 4.00e-10 | 4.47e-01 | 0.0667 |
| 56931 | DUS3L | LZE8T | Human | Esophagus | ESCC | 2.79e-03 | 5.06e-02 | 0.067 |
| 56931 | DUS3L | LZE20T | Human | Esophagus | ESCC | 4.14e-05 | 7.17e-02 | 0.0662 |
| 56931 | DUS3L | LZE24T | Human | Esophagus | ESCC | 2.74e-15 | 3.79e-01 | 0.0596 |
| 56931 | DUS3L | LZE21T | Human | Esophagus | ESCC | 3.64e-02 | 1.47e-01 | 0.0655 |
| 56931 | DUS3L | P1T-E | Human | Esophagus | ESCC | 1.04e-11 | 5.11e-01 | 0.0875 |
| 56931 | DUS3L | P2T-E | Human | Esophagus | ESCC | 7.73e-21 | 2.72e-01 | 0.1177 |
| 56931 | DUS3L | P4T-E | Human | Esophagus | ESCC | 1.14e-25 | 3.67e-01 | 0.1323 |
| 56931 | DUS3L | P5T-E | Human | Esophagus | ESCC | 6.68e-19 | 3.14e-01 | 0.1327 |
| 56931 | DUS3L | P8T-E | Human | Esophagus | ESCC | 8.48e-20 | 3.58e-01 | 0.0889 |
| 56931 | DUS3L | P9T-E | Human | Esophagus | ESCC | 7.65e-22 | 4.57e-01 | 0.1131 |
| 56931 | DUS3L | P10T-E | Human | Esophagus | ESCC | 1.68e-17 | 2.93e-01 | 0.116 |
| 56931 | DUS3L | P11T-E | Human | Esophagus | ESCC | 2.18e-19 | 5.03e-01 | 0.1426 |
| 56931 | DUS3L | P12T-E | Human | Esophagus | ESCC | 3.33e-31 | 5.62e-01 | 0.1122 |
| 56931 | DUS3L | P15T-E | Human | Esophagus | ESCC | 1.60e-26 | 3.42e-01 | 0.1149 |
| 56931 | DUS3L | P16T-E | Human | Esophagus | ESCC | 1.88e-27 | 4.29e-01 | 0.1153 |
| 56931 | DUS3L | P17T-E | Human | Esophagus | ESCC | 2.27e-12 | 5.74e-01 | 0.1278 |
| 56931 | DUS3L | P19T-E | Human | Esophagus | ESCC | 4.68e-08 | 4.59e-01 | 0.1662 |
| 56931 | DUS3L | P20T-E | Human | Esophagus | ESCC | 4.91e-17 | 3.53e-01 | 0.1124 |
| Page: 1 2 3 4 5 |
| Tissue | Expression Dynamics | Abbreviation |
| Esophagus | 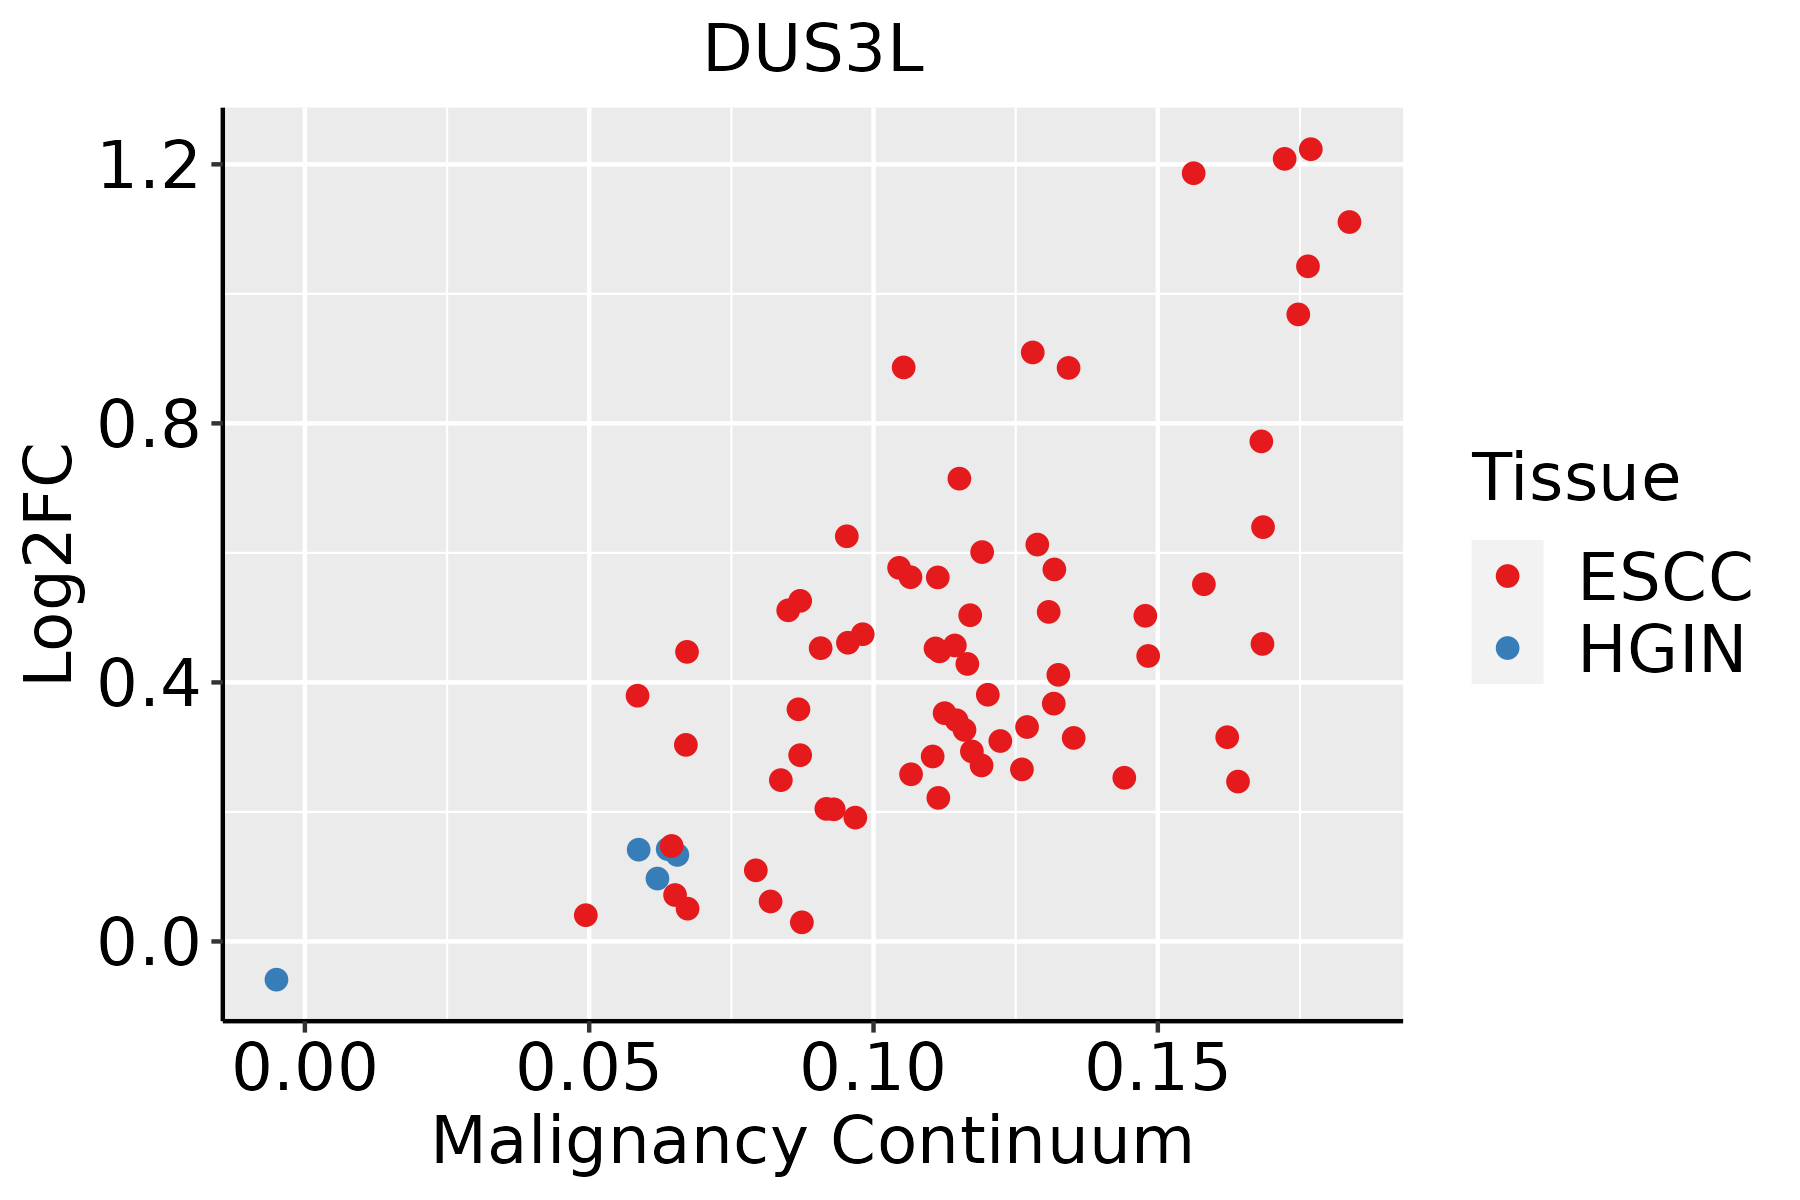 | ESCC: Esophageal squamous cell carcinoma |
| HGIN: High-grade intraepithelial neoplasias | ||
| LGIN: Low-grade intraepithelial neoplasias | ||
| Liver | 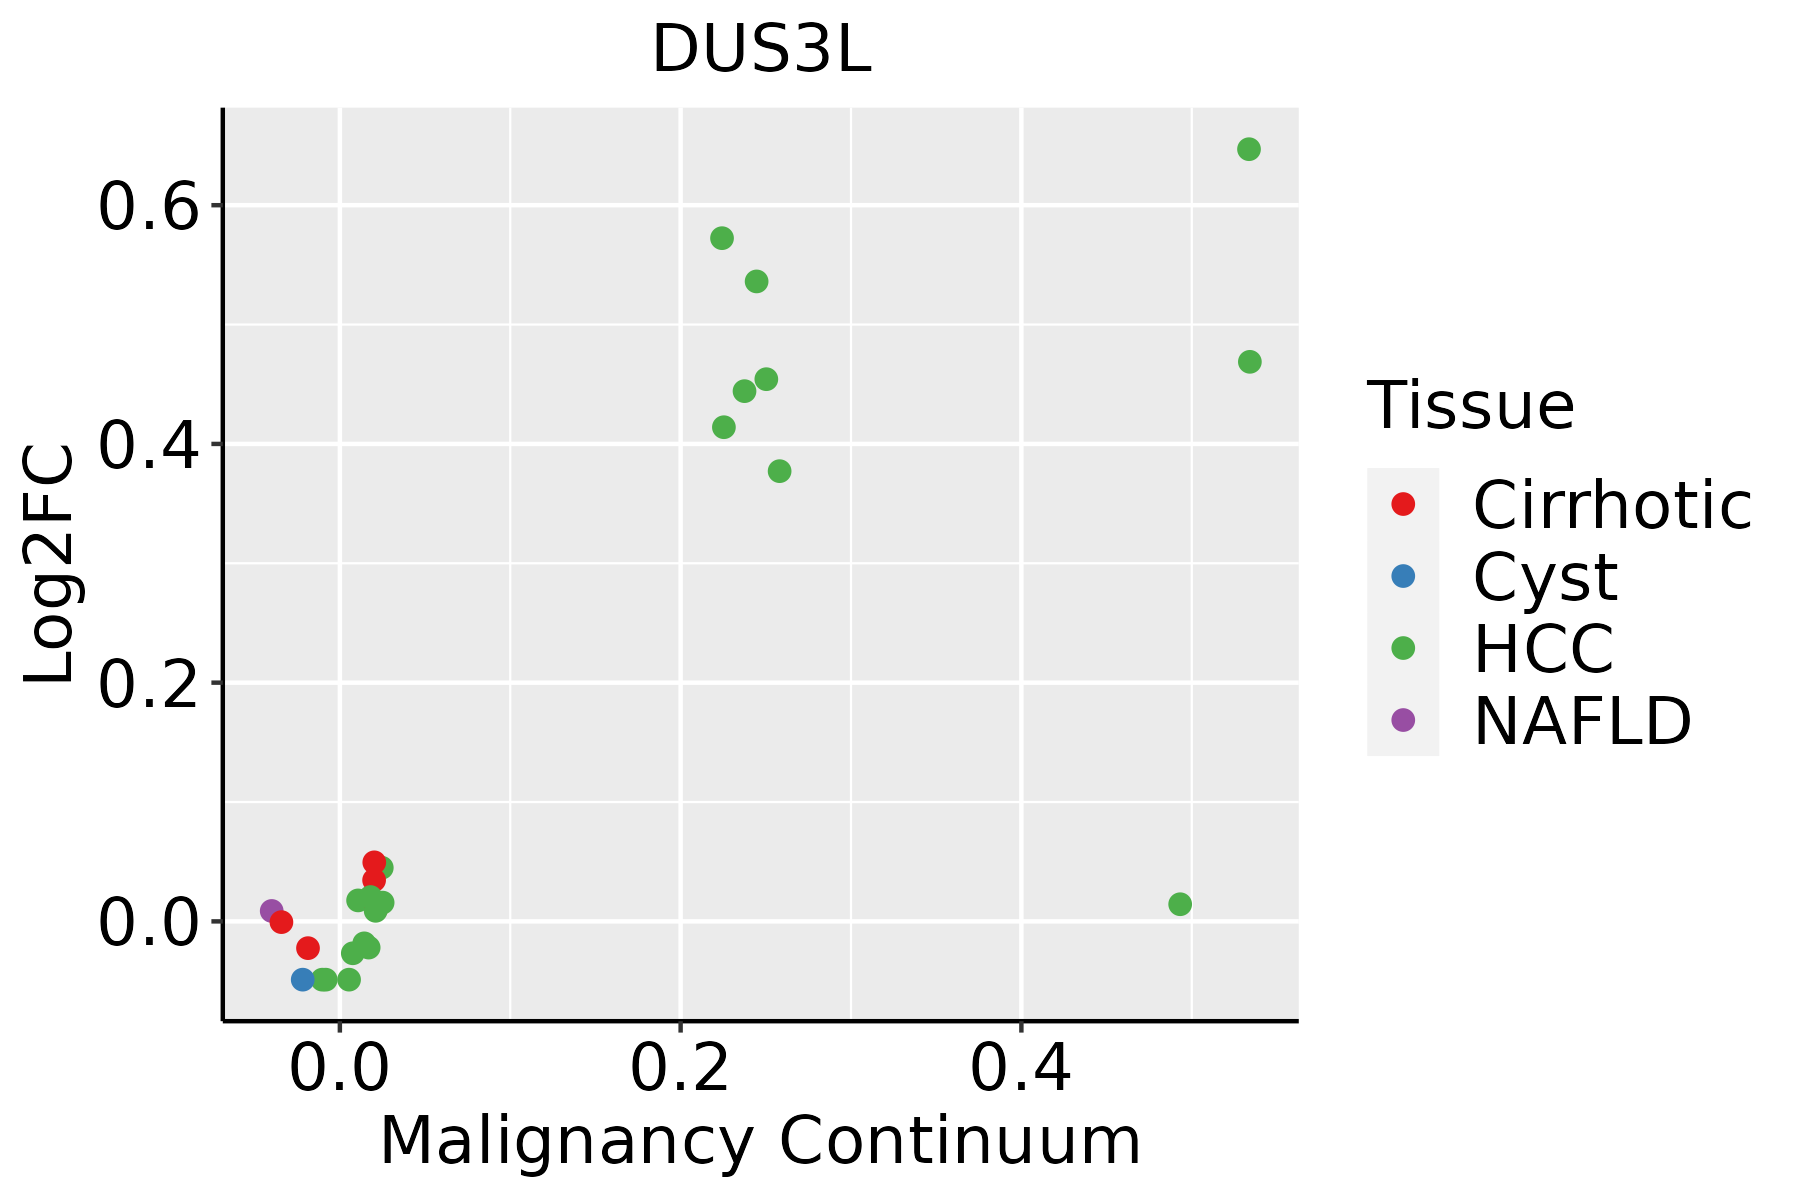 | HCC: Hepatocellular carcinoma |
| NAFLD: Non-alcoholic fatty liver disease | ||
| Oral Cavity | 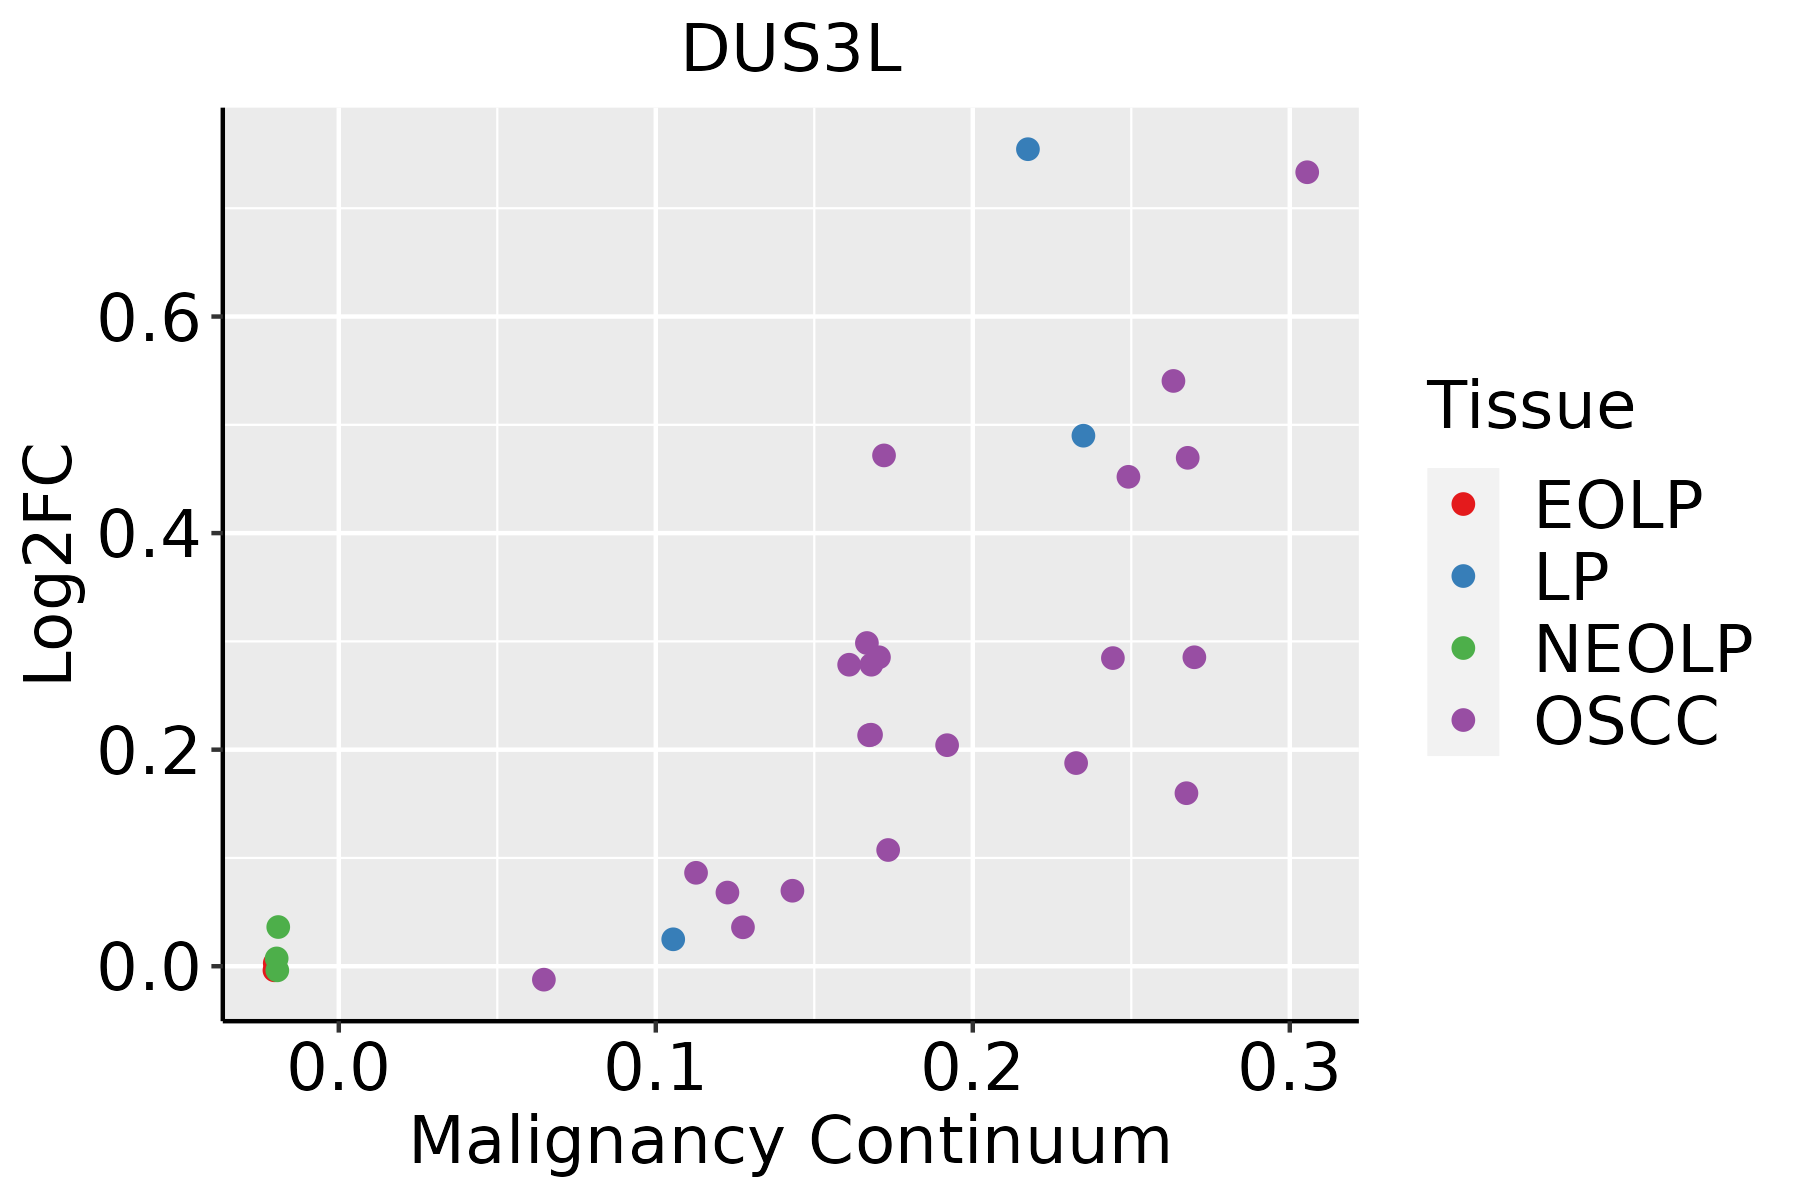 | EOLP: Erosive Oral lichen planus |
| LP: leukoplakia | ||
| NEOLP: Non-erosive oral lichen planus | ||
| OSCC: Oral squamous cell carcinoma | ||
| Skin |  | AK: Actinic keratosis |
| cSCC: Cutaneous squamous cell carcinoma | ||
| SCCIS:squamous cell carcinoma in situ |
| ∗log2FC in expression of this searched gene in stem-like cells from each diseased tissue sample relative to stem-like cells in normal samples in each tissue plotted against the malignancy continuum. Samples are colored based on if they are from different disease stage. |
Top |
Malignant transformation related pathway analysis |
| Find out the enriched GO biological processes and KEGG pathways involved in transition from healthy to precancer to cancer |
| Tissue | Disease Stage | Enriched GO biological Processes |
| Colorectum | AD |  |
| Colorectum | SER |  |
| Colorectum | MSS |  |
| Colorectum | MSI-H |  |
| Colorectum | FAP |  |
| ∗Top 15 enriched GO BP terms are showed in the bar plot of each disease state in each tissue. Each row represents a significant GO biological process which is colored according to the -log10(p.adjust). |
| Page: 1 2 3 4 5 6 7 8 9 |
| GO ID | Tissue | Disease Stage | Description | Gene Ratio | Bg Ratio | pvalue | p.adjust | Count |
| GO:003447015 | Esophagus | ESCC | ncRNA processing | 300/8552 | 395/18723 | 3.09e-35 | 3.26e-32 | 300 |
| GO:003466012 | Esophagus | ESCC | ncRNA metabolic process | 346/8552 | 485/18723 | 4.35e-31 | 2.51e-28 | 346 |
| GO:00080333 | Esophagus | ESCC | tRNA processing | 92/8552 | 127/18723 | 7.83e-10 | 1.93e-08 | 92 |
| GO:00063992 | Esophagus | ESCC | tRNA metabolic process | 122/8552 | 179/18723 | 9.03e-10 | 2.19e-08 | 122 |
| GO:00094512 | Esophagus | ESCC | RNA modification | 114/8552 | 167/18723 | 2.76e-09 | 6.04e-08 | 114 |
| GO:00064002 | Esophagus | ESCC | tRNA modification | 62/8552 | 90/18723 | 7.02e-06 | 7.04e-05 | 62 |
| GO:00344702 | Liver | HCC | ncRNA processing | 293/7958 | 395/18723 | 4.26e-38 | 6.76e-35 | 293 |
| GO:00346601 | Liver | HCC | ncRNA metabolic process | 332/7958 | 485/18723 | 1.48e-31 | 7.80e-29 | 332 |
| GO:0008033 | Liver | HCC | tRNA processing | 87/7958 | 127/18723 | 2.66e-09 | 7.23e-08 | 87 |
| GO:0006399 | Liver | HCC | tRNA metabolic process | 108/7958 | 179/18723 | 1.07e-06 | 1.59e-05 | 108 |
| GO:0009451 | Liver | HCC | RNA modification | 101/7958 | 167/18723 | 2.02e-06 | 2.78e-05 | 101 |
| GO:0006400 | Liver | HCC | tRNA modification | 60/7958 | 90/18723 | 3.09e-06 | 4.09e-05 | 60 |
| GO:00344709 | Oral cavity | OSCC | ncRNA processing | 263/7305 | 395/18723 | 4.38e-29 | 2.78e-26 | 263 |
| GO:00346605 | Oral cavity | OSCC | ncRNA metabolic process | 296/7305 | 485/18723 | 2.94e-23 | 6.65e-21 | 296 |
| GO:00080332 | Oral cavity | OSCC | tRNA processing | 78/7305 | 127/18723 | 2.56e-07 | 4.00e-06 | 78 |
| GO:00063991 | Oral cavity | OSCC | tRNA metabolic process | 101/7305 | 179/18723 | 1.65e-06 | 2.15e-05 | 101 |
| GO:00094511 | Oral cavity | OSCC | RNA modification | 95/7305 | 167/18723 | 2.05e-06 | 2.62e-05 | 95 |
| GO:00064001 | Oral cavity | OSCC | tRNA modification | 53/7305 | 90/18723 | 1.04e-04 | 7.70e-04 | 53 |
| GO:003447014 | Oral cavity | LP | ncRNA processing | 184/4623 | 395/18723 | 1.20e-21 | 3.12e-19 | 184 |
| GO:003466011 | Oral cavity | LP | ncRNA metabolic process | 205/4623 | 485/18723 | 6.46e-18 | 1.09e-15 | 205 |
| Page: 1 2 |
| Pathway ID | Tissue | Disease Stage | Description | Gene Ratio | Bg Ratio | pvalue | p.adjust | qvalue | Count |
| Page: 1 |
Top |
Cell-cell communication analysis |
| Identification of potential cell-cell interactions between two cell types and their ligand-receptor pairs for different disease states |
| Ligand | Receptor | LRpair | Pathway | Tissue | Disease Stage |
| Page: 1 |
Top |
Single-cell gene regulatory network inference analysis |
| Find out the significant the regulons (TFs) and the target genes of each regulon across cell types for different disease states |
| TF | Cell Type | Tissue | Disease Stage | Target Gene | RSS | Regulon Activity |
| DUS3L | GC | Breast | ADJ | CCNE2,DUS2,P2RY6, etc. | 2.61e-02 |  |
| DUS3L | MAST | Breast | DCIS | CCNE2,DUS2,P2RY6, etc. | 1.61e-02 |  |
| DUS3L | CD8TEXINT | Breast | Precancer | CCNE2,DUS2,P2RY6, etc. | 2.76e-02 |  |
| DUS3L | pDC | Breast | Precancer | CCNE2,DUS2,P2RY6, etc. | 1.53e-02 | |
| DUS3L | SURF | Endometrium | AEH | BATF3,SLC35E4,PLPBP, etc. | 2.89e-01 |  |
| ∗The dot plots of a searched regulon are shown for all cell subpopulations in each disease state of each tissue based on the regulon specific score inferred using pySCENIC and by calculating the average expression. |
| Page: 1 |
Top |
Somatic mutation of malignant transformation related genes |
| Annotation of somatic variants for genes involved in malignant transformation |
| Hugo Symbol | Variant Class | Variant Classification | dbSNP RS | HGVSc | HGVSp | HGVSp Short | SWISSPROT | BIOTYPE | SIFT | PolyPhen | Tumor Sample Barcode | Tissue | Histology | Sex | Age | Stage | Therapy Types | Drugs | Outcome |
| DUS3L | SNV | Missense_Mutation | c.1180N>T | p.Val394Phe | p.V394F | Q96G46 | protein_coding | deleterious(0) | benign(0.246) | TCGA-BH-A0DX-01 | Breast | breast invasive carcinoma | Female | <65 | I/II | Chemotherapy | taxotere | CR | |
| DUS3L | deletion | Frame_Shift_Del | novel | c.1928delN | p.Lys643SerfsTer24 | p.K643Sfs*24 | Q96G46 | protein_coding | TCGA-EW-A2FV-01 | Breast | breast invasive carcinoma | Female | <65 | III/IV | Chemotherapy | docetaxel | SD | ||
| DUS3L | deletion | Frame_Shift_Del | novel | c.595delN | p.Arg199AlafsTer87 | p.R199Afs*87 | Q96G46 | protein_coding | TCGA-EW-A2FV-01 | Breast | breast invasive carcinoma | Female | <65 | III/IV | Chemotherapy | docetaxel | SD | ||
| DUS3L | SNV | Missense_Mutation | novel | c.454N>A | p.Glu152Lys | p.E152K | Q96G46 | protein_coding | tolerated(0.69) | benign(0) | TCGA-2W-A8YY-01 | Cervix | cervical & endocervical cancer | Female | <65 | I/II | Chemotherapy | cisplatin | CR |
| DUS3L | SNV | Missense_Mutation | c.965N>A | p.Arg322Gln | p.R322Q | Q96G46 | protein_coding | deleterious(0) | probably_damaging(0.987) | TCGA-EX-A449-01 | Cervix | cervical & endocervical cancer | Female | <65 | I/II | Chemotherapy | cisplatin | CR | |
| DUS3L | SNV | Missense_Mutation | c.1528N>T | p.Met510Leu | p.M510L | Q96G46 | protein_coding | tolerated(0.58) | benign(0) | TCGA-IR-A3LI-01 | Cervix | cervical & endocervical cancer | Female | <65 | I/II | Chemotherapy | cisplatin | CR | |
| DUS3L | SNV | Missense_Mutation | rs758799429 | c.698N>A | p.Arg233His | p.R233H | Q96G46 | protein_coding | deleterious(0.05) | benign(0.009) | TCGA-IR-A3LL-01 | Cervix | cervical & endocervical cancer | Female | <65 | I/II | Chemotherapy | cisplatin | CR |
| DUS3L | SNV | Missense_Mutation | c.1233N>A | p.Met411Ile | p.M411I | Q96G46 | protein_coding | deleterious(0) | benign(0.056) | TCGA-LP-A5U2-01 | Cervix | cervical & endocervical cancer | Female | <65 | III/IV | Unknown | Unknown | SD | |
| DUS3L | SNV | Missense_Mutation | novel | c.1400N>A | p.Arg467His | p.R467H | Q96G46 | protein_coding | deleterious(0) | probably_damaging(1) | TCGA-A6-3809-01 | Colorectum | colon adenocarcinoma | Female | >=65 | I/II | Unknown | Unknown | SD |
| DUS3L | SNV | Missense_Mutation | novel | c.418C>T | p.Arg140Cys | p.R140C | Q96G46 | protein_coding | deleterious(0) | possibly_damaging(0.786) | TCGA-AA-3947-01 | Colorectum | colon adenocarcinoma | Female | <65 | I/II | Unknown | Unknown | SD |
| Page: 1 2 3 4 5 6 7 |
Top |
Related drugs of malignant transformation related genes |
| Identification of chemicals and drugs interact with genes involved in malignant transfromation |
| (DGIdb 4.0) |
| Entrez ID | Symbol | Category | Interaction Types | Drug Claim Name | Drug Name | PMIDs |
| Page: 1 |

Copyright 2023-Present -The University of Texas Health Science Center at Houston |