
|
|||||
|
 | |
| |
| |
| |
| |
| |
|
Gene: DUS1L |
Gene summary for DUS1L |
| Gene information | Species | Human | Gene symbol | DUS1L | Gene ID | 64118 |
| Gene name | dihydrouridine synthase 1 like | |
| Gene Alias | DUS1 | |
| Cytomap | 17q25.3 | |
| Gene Type | protein-coding | GO ID | GO:0002943 | UniProtAcc | Q6P1R4 |
Top |
Malignant transformation analysis |
| Identification of the aberrant gene expression in precancerous and cancerous lesions by comparing the gene expression of stem-like cells in diseased tissues with normal stem cells |
| Entrez ID | Symbol | Replicates | Species | Organ | Tissue | Adj P-value | Log2FC | Malignancy |
| 64118 | DUS1L | HTA11_1938_2000001011 | Human | Colorectum | AD | 3.06e-05 | 4.86e-01 | -0.0811 |
| 64118 | DUS1L | HTA11_347_2000001011 | Human | Colorectum | AD | 4.79e-10 | 5.10e-01 | -0.1954 |
| 64118 | DUS1L | HTA11_696_2000001011 | Human | Colorectum | AD | 4.37e-09 | 4.61e-01 | -0.1464 |
| 64118 | DUS1L | HTA11_866_2000001011 | Human | Colorectum | AD | 2.52e-05 | 3.18e-01 | -0.1001 |
| 64118 | DUS1L | HTA11_1391_2000001011 | Human | Colorectum | AD | 2.37e-15 | 7.91e-01 | -0.059 |
| 64118 | DUS1L | HTA11_2992_2000001011 | Human | Colorectum | SER | 9.36e-04 | 7.00e-01 | -0.1706 |
| 64118 | DUS1L | HTA11_546_2000001011 | Human | Colorectum | AD | 1.12e-03 | 3.99e-01 | -0.0842 |
| 64118 | DUS1L | HTA11_7862_2000001011 | Human | Colorectum | AD | 1.86e-02 | 4.33e-01 | -0.0179 |
| 64118 | DUS1L | HTA11_866_3004761011 | Human | Colorectum | AD | 1.06e-06 | 5.49e-01 | 0.096 |
| 64118 | DUS1L | HTA11_8622_2000001021 | Human | Colorectum | SER | 1.79e-04 | 6.51e-01 | 0.0528 |
| 64118 | DUS1L | HTA11_6801_2000001011 | Human | Colorectum | SER | 8.01e-05 | 9.27e-01 | 0.0171 |
| 64118 | DUS1L | HTA11_10711_2000001011 | Human | Colorectum | AD | 1.60e-03 | 3.87e-01 | 0.0338 |
| 64118 | DUS1L | HTA11_7696_3000711011 | Human | Colorectum | AD | 1.12e-11 | 4.97e-01 | 0.0674 |
| 64118 | DUS1L | HTA11_99999970781_79442 | Human | Colorectum | MSS | 1.99e-09 | 5.20e-01 | 0.294 |
| 64118 | DUS1L | HTA11_99999971662_82457 | Human | Colorectum | MSS | 5.01e-38 | 1.20e+00 | 0.3859 |
| 64118 | DUS1L | HTA11_99999973899_84307 | Human | Colorectum | MSS | 8.09e-05 | 7.18e-01 | 0.2585 |
| 64118 | DUS1L | HTA11_99999974143_84620 | Human | Colorectum | MSS | 6.43e-48 | 1.19e+00 | 0.3005 |
| 64118 | DUS1L | A002-C-116 | Human | Colorectum | FAP | 1.59e-02 | -1.26e-01 | -0.0452 |
| 64118 | DUS1L | LZE7T | Human | Esophagus | ESCC | 1.44e-07 | 3.56e-01 | 0.0667 |
| 64118 | DUS1L | LZE20T | Human | Esophagus | ESCC | 2.59e-05 | 1.44e-01 | 0.0662 |
| Page: 1 2 3 4 5 6 7 |
| Tissue | Expression Dynamics | Abbreviation |
| Colorectum (GSE201348) |  | FAP: Familial adenomatous polyposis |
| CRC: Colorectal cancer | ||
| Colorectum (HTA11) |  | AD: Adenomas |
| SER: Sessile serrated lesions | ||
| MSI-H: Microsatellite-high colorectal cancer | ||
| MSS: Microsatellite stable colorectal cancer | ||
| Esophagus | 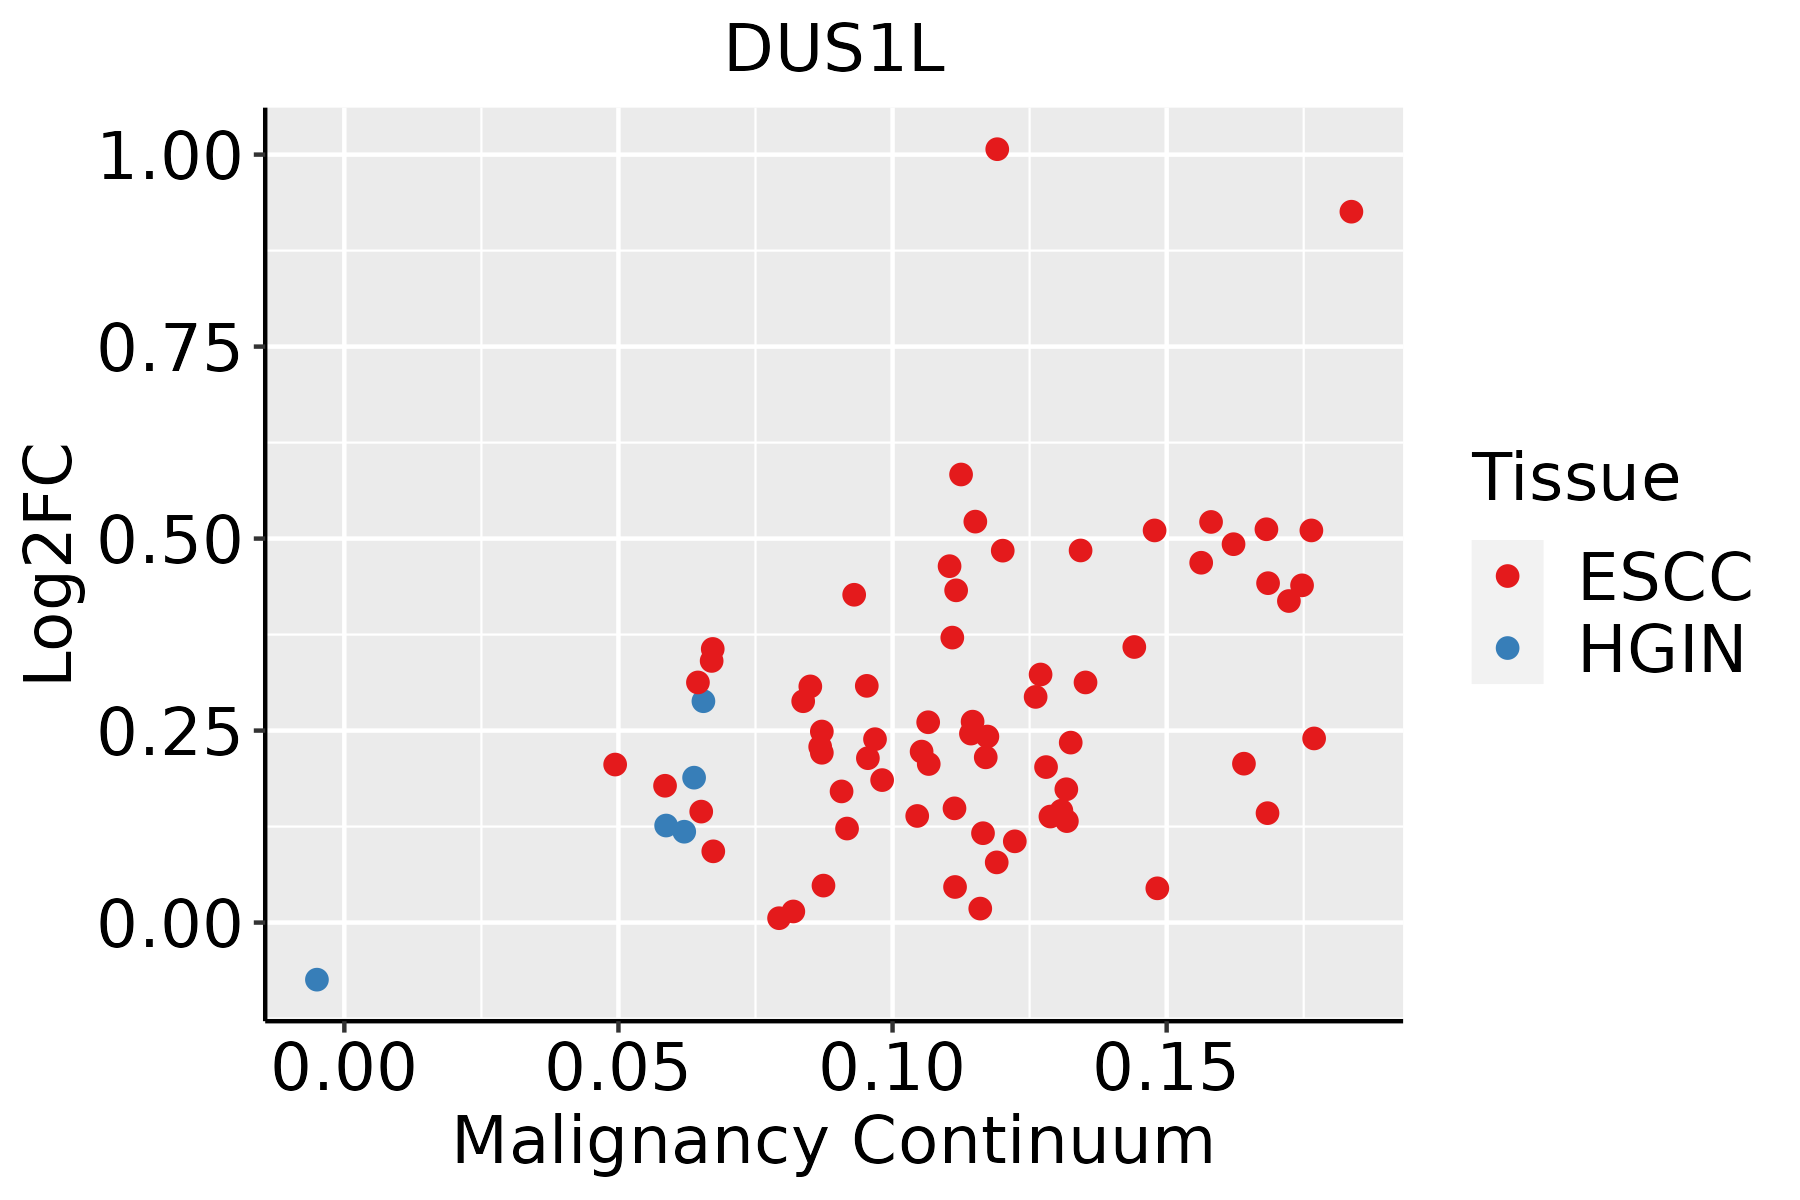 | ESCC: Esophageal squamous cell carcinoma |
| HGIN: High-grade intraepithelial neoplasias | ||
| LGIN: Low-grade intraepithelial neoplasias | ||
| Liver | 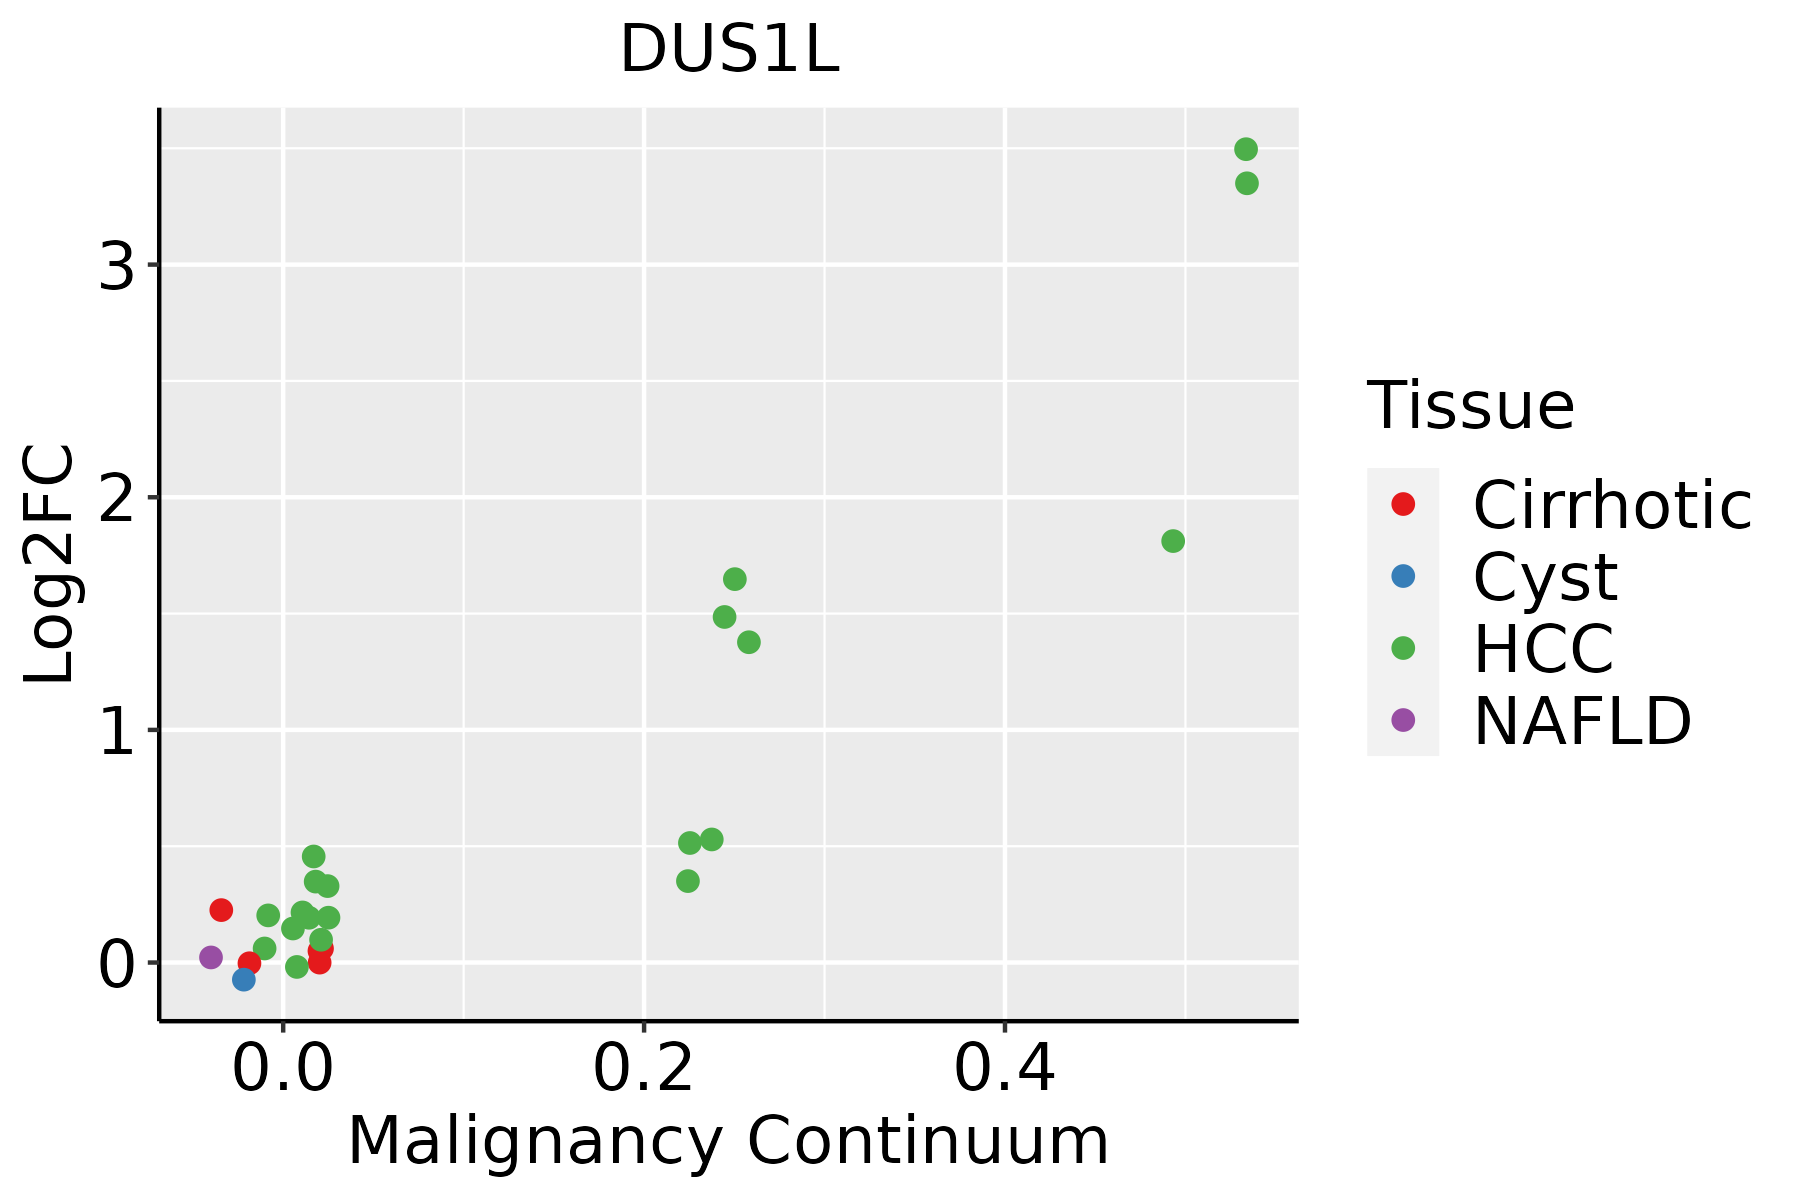 | HCC: Hepatocellular carcinoma |
| NAFLD: Non-alcoholic fatty liver disease | ||
| Oral Cavity | 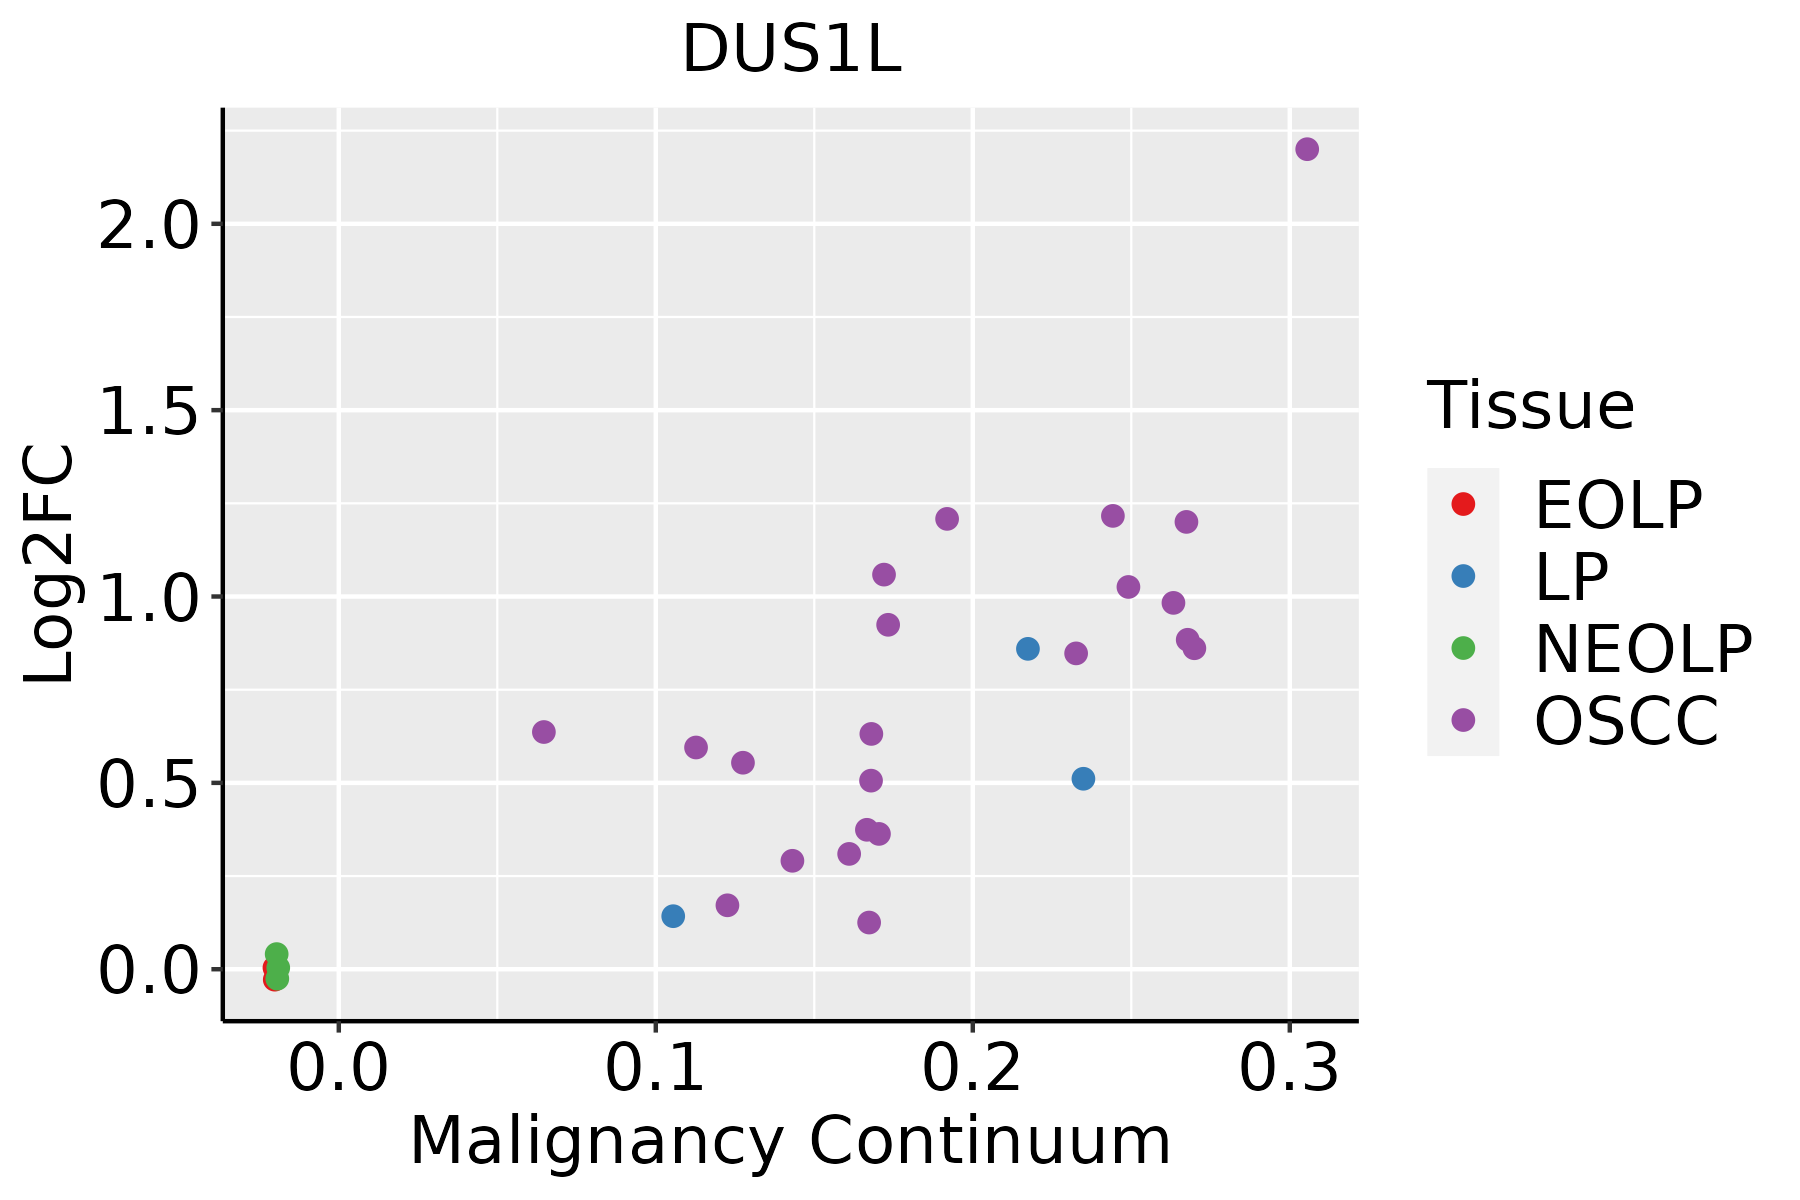 | EOLP: Erosive Oral lichen planus |
| LP: leukoplakia | ||
| NEOLP: Non-erosive oral lichen planus | ||
| OSCC: Oral squamous cell carcinoma | ||
| Prostate | 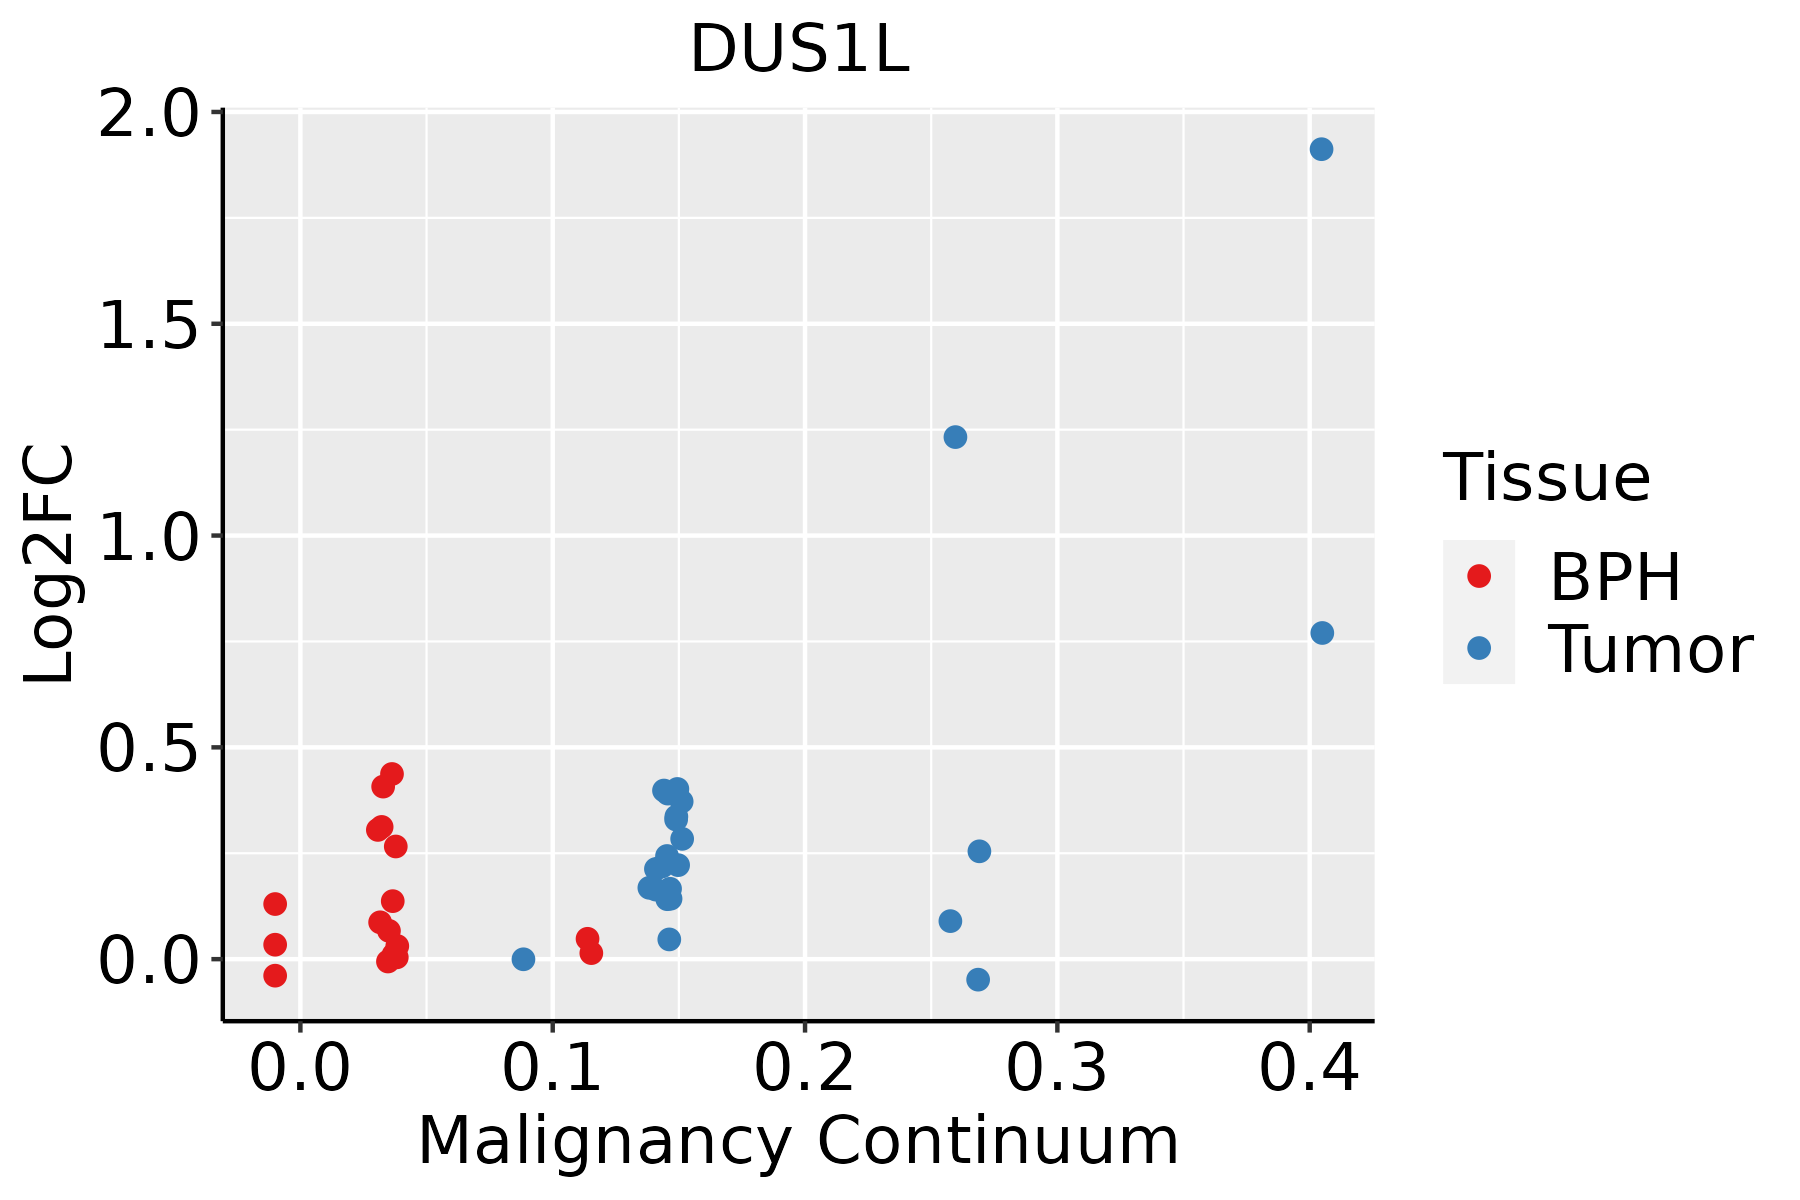 | BPH: Benign Prostatic Hyperplasia |
| Skin | 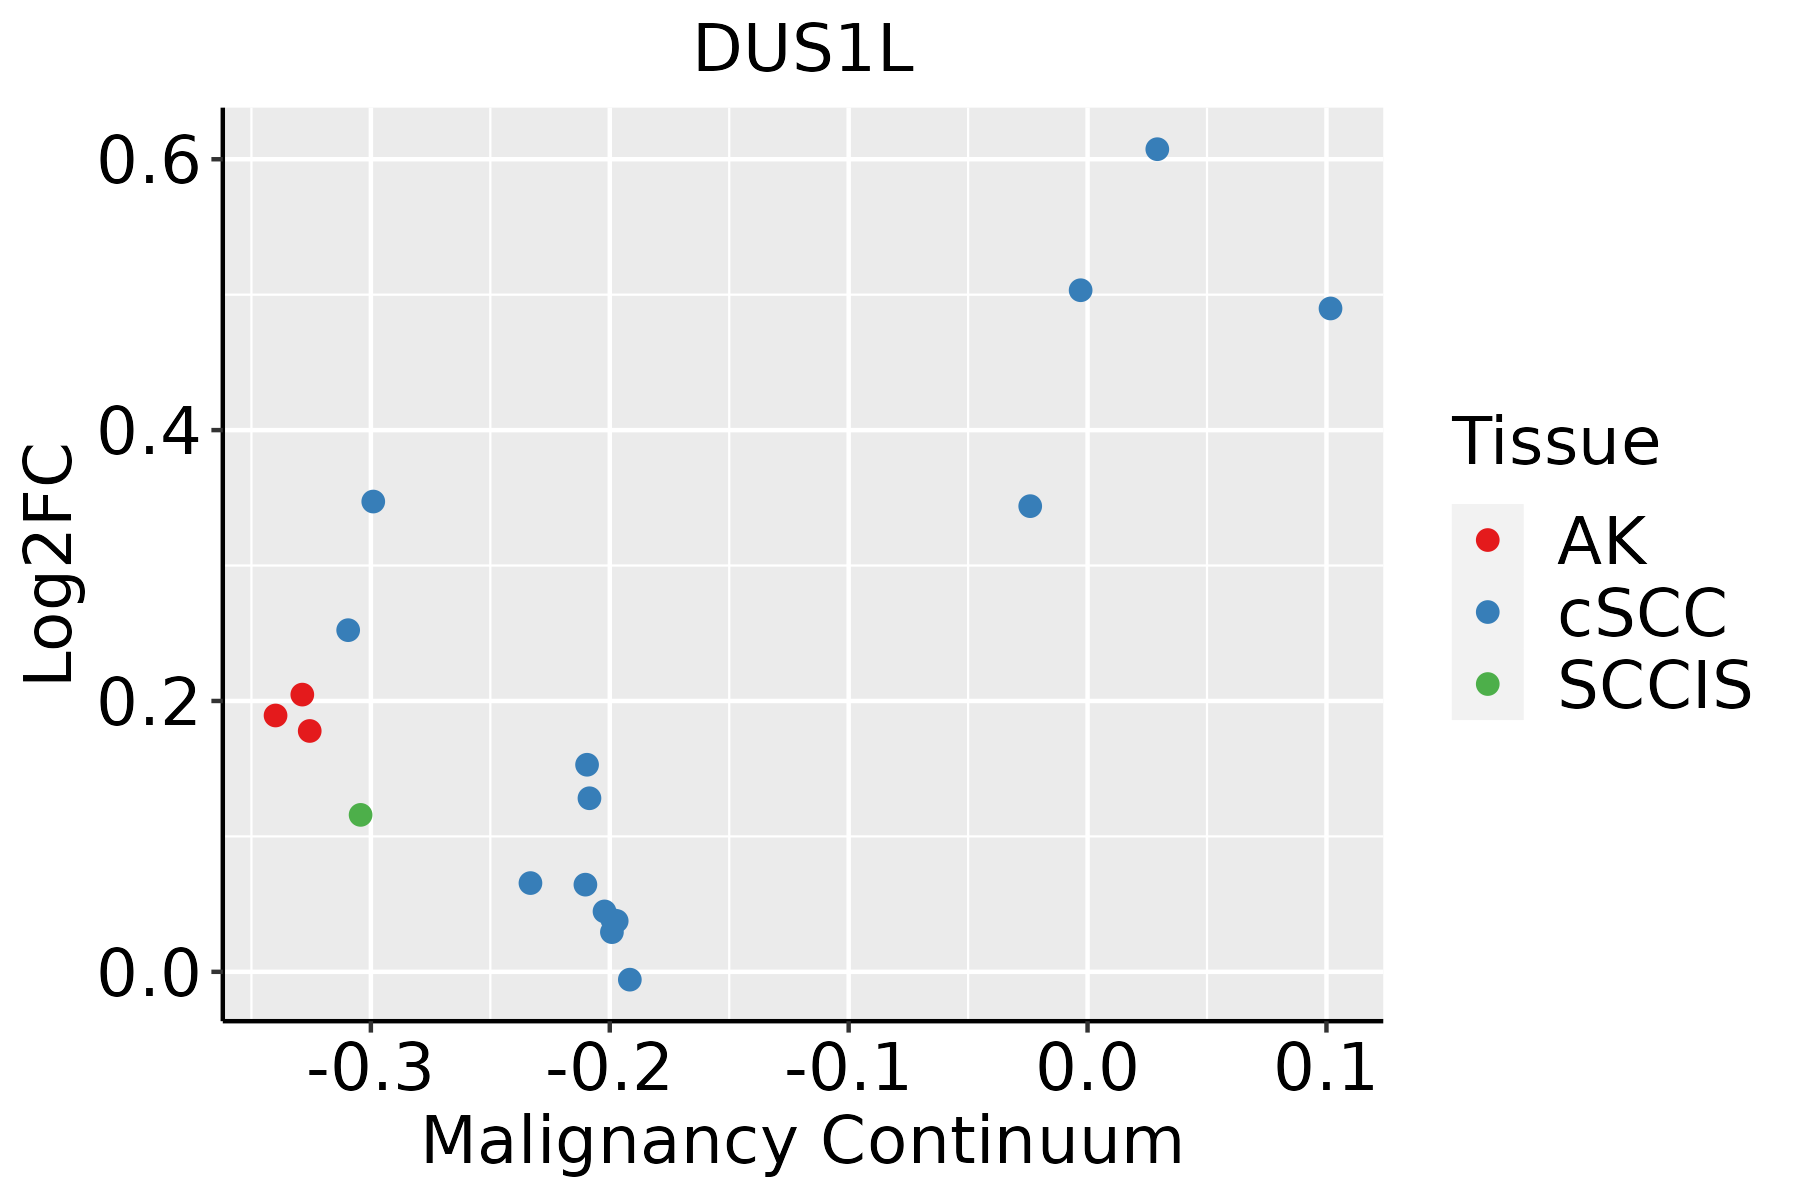 | AK: Actinic keratosis |
| cSCC: Cutaneous squamous cell carcinoma | ||
| SCCIS:squamous cell carcinoma in situ | ||
| Thyroid | 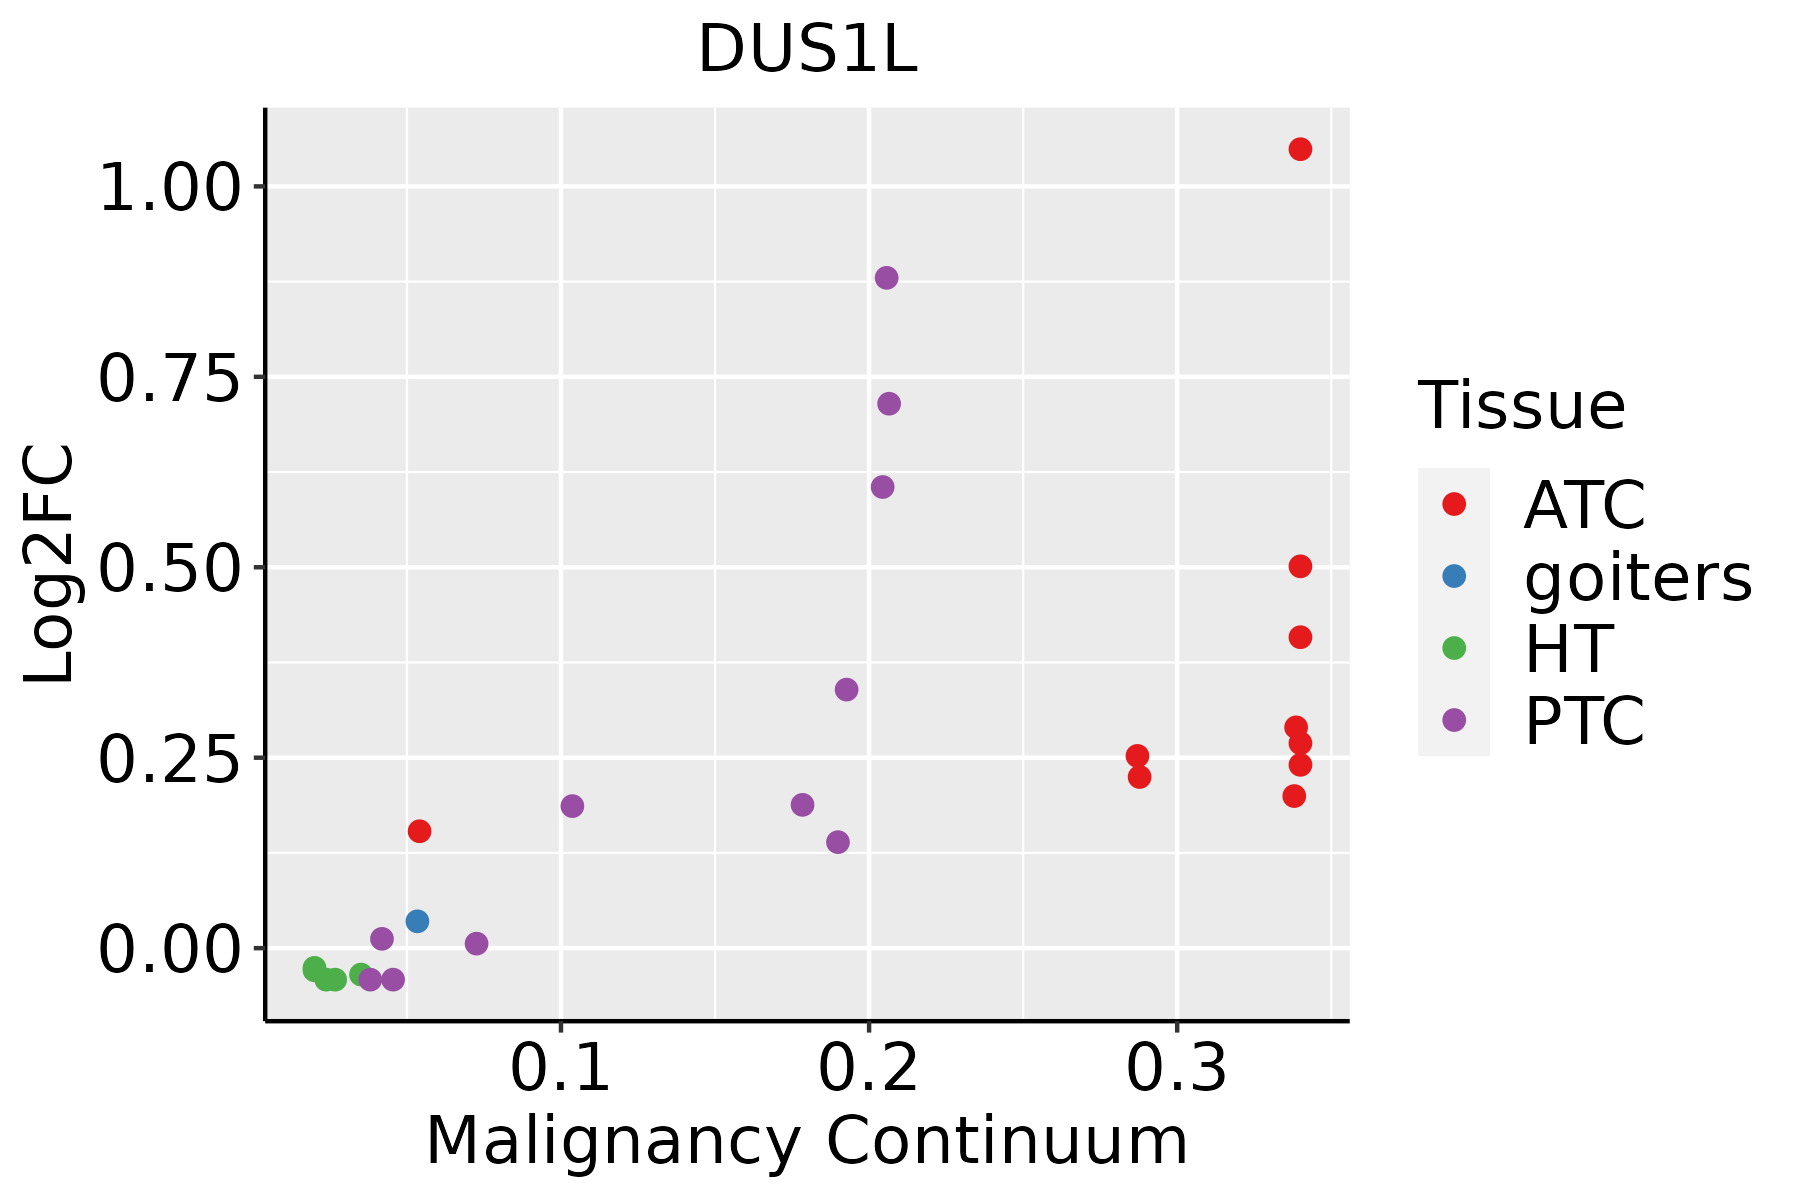 | ATC: Anaplastic thyroid cancer |
| HT: Hashimoto's thyroiditis | ||
| PTC: Papillary thyroid cancer |
| ∗log2FC in expression of this searched gene in stem-like cells from each diseased tissue sample relative to stem-like cells in normal samples in each tissue plotted against the malignancy continuum. Samples are colored based on if they are from different disease stage. |
Top |
Malignant transformation related pathway analysis |
| Find out the enriched GO biological processes and KEGG pathways involved in transition from healthy to precancer to cancer |
| Tissue | Disease Stage | Enriched GO biological Processes |
| Colorectum | AD |  |
| Colorectum | SER |  |
| Colorectum | MSS |  |
| Colorectum | MSI-H |  |
| Colorectum | FAP |  |
| ∗Top 15 enriched GO BP terms are showed in the bar plot of each disease state in each tissue. Each row represents a significant GO biological process which is colored according to the -log10(p.adjust). |
| Page: 1 2 3 4 5 6 7 8 9 |
| GO ID | Tissue | Disease Stage | Description | Gene Ratio | Bg Ratio | pvalue | p.adjust | Count |
| GO:003447010 | Esophagus | HGIN | ncRNA processing | 97/2587 | 395/18723 | 5.92e-09 | 3.90e-07 | 97 |
| GO:00346606 | Esophagus | HGIN | ncRNA metabolic process | 104/2587 | 485/18723 | 2.26e-06 | 8.23e-05 | 104 |
| GO:003447015 | Esophagus | ESCC | ncRNA processing | 300/8552 | 395/18723 | 3.09e-35 | 3.26e-32 | 300 |
| GO:003466012 | Esophagus | ESCC | ncRNA metabolic process | 346/8552 | 485/18723 | 4.35e-31 | 2.51e-28 | 346 |
| GO:00080333 | Esophagus | ESCC | tRNA processing | 92/8552 | 127/18723 | 7.83e-10 | 1.93e-08 | 92 |
| GO:00063992 | Esophagus | ESCC | tRNA metabolic process | 122/8552 | 179/18723 | 9.03e-10 | 2.19e-08 | 122 |
| GO:00094512 | Esophagus | ESCC | RNA modification | 114/8552 | 167/18723 | 2.76e-09 | 6.04e-08 | 114 |
| GO:00064002 | Esophagus | ESCC | tRNA modification | 62/8552 | 90/18723 | 7.02e-06 | 7.04e-05 | 62 |
| GO:00344702 | Liver | HCC | ncRNA processing | 293/7958 | 395/18723 | 4.26e-38 | 6.76e-35 | 293 |
| GO:00346601 | Liver | HCC | ncRNA metabolic process | 332/7958 | 485/18723 | 1.48e-31 | 7.80e-29 | 332 |
| GO:0008033 | Liver | HCC | tRNA processing | 87/7958 | 127/18723 | 2.66e-09 | 7.23e-08 | 87 |
| GO:0006399 | Liver | HCC | tRNA metabolic process | 108/7958 | 179/18723 | 1.07e-06 | 1.59e-05 | 108 |
| GO:0009451 | Liver | HCC | RNA modification | 101/7958 | 167/18723 | 2.02e-06 | 2.78e-05 | 101 |
| GO:0006400 | Liver | HCC | tRNA modification | 60/7958 | 90/18723 | 3.09e-06 | 4.09e-05 | 60 |
| GO:00344709 | Oral cavity | OSCC | ncRNA processing | 263/7305 | 395/18723 | 4.38e-29 | 2.78e-26 | 263 |
| GO:00346605 | Oral cavity | OSCC | ncRNA metabolic process | 296/7305 | 485/18723 | 2.94e-23 | 6.65e-21 | 296 |
| GO:00080332 | Oral cavity | OSCC | tRNA processing | 78/7305 | 127/18723 | 2.56e-07 | 4.00e-06 | 78 |
| GO:00063991 | Oral cavity | OSCC | tRNA metabolic process | 101/7305 | 179/18723 | 1.65e-06 | 2.15e-05 | 101 |
| GO:00094511 | Oral cavity | OSCC | RNA modification | 95/7305 | 167/18723 | 2.05e-06 | 2.62e-05 | 95 |
| GO:00064001 | Oral cavity | OSCC | tRNA modification | 53/7305 | 90/18723 | 1.04e-04 | 7.70e-04 | 53 |
| Page: 1 2 |
| Pathway ID | Tissue | Disease Stage | Description | Gene Ratio | Bg Ratio | pvalue | p.adjust | qvalue | Count |
| Page: 1 |
Top |
Cell-cell communication analysis |
| Identification of potential cell-cell interactions between two cell types and their ligand-receptor pairs for different disease states |
| Ligand | Receptor | LRpair | Pathway | Tissue | Disease Stage |
| Page: 1 |
Top |
Single-cell gene regulatory network inference analysis |
| Find out the significant the regulons (TFs) and the target genes of each regulon across cell types for different disease states |
| TF | Cell Type | Tissue | Disease Stage | Target Gene | RSS | Regulon Activity |
| ∗The dot plots of a searched regulon are shown for all cell subpopulations in each disease state of each tissue based on the regulon specific score inferred using pySCENIC and by calculating the average expression. |
| Page: 1 |
Top |
Somatic mutation of malignant transformation related genes |
| Annotation of somatic variants for genes involved in malignant transformation |
| Hugo Symbol | Variant Class | Variant Classification | dbSNP RS | HGVSc | HGVSp | HGVSp Short | SWISSPROT | BIOTYPE | SIFT | PolyPhen | Tumor Sample Barcode | Tissue | Histology | Sex | Age | Stage | Therapy Types | Drugs | Outcome |
| DUS1L | SNV | Missense_Mutation | novel | c.468G>C | p.Lys156Asn | p.K156N | Q6P1R4 | protein_coding | deleterious(0) | possibly_damaging(0.821) | TCGA-AC-A8OP-01 | Breast | breast invasive carcinoma | Female | >=65 | I/II | Unknown | Unknown | SD |
| DUS1L | SNV | Missense_Mutation | c.1063N>G | p.Lys355Glu | p.K355E | Q6P1R4 | protein_coding | deleterious(0.04) | possibly_damaging(0.718) | TCGA-BH-A0HA-01 | Breast | breast invasive carcinoma | Female | <65 | I/II | Unknown | Unknown | SD | |
| DUS1L | SNV | Missense_Mutation | c.859N>A | p.Glu287Lys | p.E287K | Q6P1R4 | protein_coding | tolerated(0.11) | benign(0.038) | TCGA-BH-A1FN-01 | Breast | breast invasive carcinoma | Female | <65 | I/II | Unknown | Unknown | PD | |
| DUS1L | deletion | Frame_Shift_Del | novel | c.1320delN | p.Leu441TrpfsTer107 | p.L441Wfs*107 | Q6P1R4 | protein_coding | TCGA-D8-A27V-01 | Breast | breast invasive carcinoma | Female | <65 | I/II | Hormone Therapy | tamoxiphen | SD | ||
| DUS1L | deletion | Frame_Shift_Del | novel | c.490delC | p.Leu164TrpfsTer9 | p.L164Wfs*9 | Q6P1R4 | protein_coding | TCGA-EW-A2FV-01 | Breast | breast invasive carcinoma | Female | <65 | III/IV | Chemotherapy | docetaxel | SD | ||
| DUS1L | SNV | Missense_Mutation | novel | c.301N>A | p.Ala101Thr | p.A101T | Q6P1R4 | protein_coding | deleterious(0) | probably_damaging(0.997) | TCGA-2W-A8YY-01 | Cervix | cervical & endocervical cancer | Female | <65 | I/II | Chemotherapy | cisplatin | CR |
| DUS1L | SNV | Missense_Mutation | rs751958468 | c.434N>T | p.Thr145Met | p.T145M | Q6P1R4 | protein_coding | deleterious(0) | probably_damaging(0.952) | TCGA-AZ-6601-01 | Colorectum | colon adenocarcinoma | Male | >=65 | I/II | Unknown | Unknown | PD |
| DUS1L | SNV | Missense_Mutation | rs114350519 | c.694G>A | p.Ala232Thr | p.A232T | Q6P1R4 | protein_coding | deleterious(0.01) | probably_damaging(0.996) | TCGA-CI-6620-01 | Colorectum | rectum adenocarcinoma | Female | <65 | I/II | Ancillary | leucovorin | PD |
| DUS1L | SNV | Missense_Mutation | novel | c.535N>G | p.Lys179Glu | p.K179E | Q6P1R4 | protein_coding | deleterious(0.01) | probably_damaging(0.933) | TCGA-A5-A0G1-01 | Endometrium | uterine corpus endometrioid carcinoma | Female | >=65 | I/II | Unknown | Unknown | SD |
| DUS1L | SNV | Missense_Mutation | novel | c.737N>A | p.Ser246Asn | p.S246N | Q6P1R4 | protein_coding | tolerated(0.84) | benign(0.003) | TCGA-AP-A059-01 | Endometrium | uterine corpus endometrioid carcinoma | Female | >=65 | I/II | Unknown | Unknown | SD |
| Page: 1 2 3 |
Top |
Related drugs of malignant transformation related genes |
| Identification of chemicals and drugs interact with genes involved in malignant transfromation |
| (DGIdb 4.0) |
| Entrez ID | Symbol | Category | Interaction Types | Drug Claim Name | Drug Name | PMIDs |
| Page: 1 |

Copyright 2023-Present -The University of Texas Health Science Center at Houston |