
|
|||||
|
 | |
| |
| |
| |
| |
| |
|
Gene: DUOXA2 |
Gene summary for DUOXA2 |
| Gene information | Species | Human | Gene symbol | DUOXA2 | Gene ID | 405753 |
| Gene name | dual oxidase maturation factor 2 | |
| Gene Alias | SIMNIPHOM | |
| Cytomap | 15q21.1 | |
| Gene Type | protein-coding | GO ID | GO:0006575 | UniProtAcc | Q1HG44 |
Top |
Malignant transformation analysis |
| Identification of the aberrant gene expression in precancerous and cancerous lesions by comparing the gene expression of stem-like cells in diseased tissues with normal stem cells |
| Entrez ID | Symbol | Replicates | Species | Organ | Tissue | Adj P-value | Log2FC | Malignancy |
| 405753 | DUOXA2 | CCII_1 | Human | Cervix | CC | 6.81e-14 | 3.95e-01 | 0.3249 |
| 405753 | DUOXA2 | Tumor | Human | Cervix | CC | 1.37e-12 | 3.85e-01 | 0.1241 |
| 405753 | DUOXA2 | sample3 | Human | Cervix | CC | 1.26e-22 | 5.76e-01 | 0.1387 |
| 405753 | DUOXA2 | H2 | Human | Cervix | HSIL_HPV | 2.54e-15 | 5.98e-01 | 0.0632 |
| 405753 | DUOXA2 | T3 | Human | Cervix | CC | 7.96e-25 | 5.69e-01 | 0.1389 |
| 405753 | DUOXA2 | LZE20T | Human | Esophagus | ESCC | 9.98e-09 | 5.43e-01 | 0.0662 |
| 405753 | DUOXA2 | LZE24T | Human | Esophagus | ESCC | 2.08e-11 | 1.13e+00 | 0.0596 |
| 405753 | DUOXA2 | Pat10-B | Human | Stomach | GC | 1.20e-02 | 5.08e-01 | 0.084 |
| 405753 | DUOXA2 | Pat11-B | Human | Stomach | GC | 1.56e-03 | 2.79e-01 | -0.182 |
| 405753 | DUOXA2 | Pat12-B | Human | Stomach | GC | 3.59e-12 | 4.93e-01 | 0.0325 |
| 405753 | DUOXA2 | Pat15-B | Human | Stomach | GC | 5.63e-11 | 4.76e-01 | -0.0778 |
| 405753 | DUOXA2 | Pat19-B | Human | Stomach | GC | 5.66e-05 | 4.10e-01 | 0.0826 |
| 405753 | DUOXA2 | Pat24-B | Human | Stomach | GC | 2.61e-13 | 6.52e-01 | -0.1184 |
| 405753 | DUOXA2 | Pat28-A | Human | Stomach | CSG | 2.15e-03 | 2.46e-01 | -0.2594 |
| 405753 | DUOXA2 | Pat29-A | Human | Stomach | CAG with IM | 7.77e-08 | 5.44e-01 | -0.2769 |
| 405753 | DUOXA2 | male-WTA | Human | Thyroid | PTC | 3.08e-23 | 2.70e-01 | 0.1037 |
| 405753 | DUOXA2 | PTC01 | Human | Thyroid | PTC | 1.07e-09 | 2.81e-01 | 0.1899 |
| 405753 | DUOXA2 | PTC05 | Human | Thyroid | PTC | 1.80e-02 | 3.85e-01 | 0.2065 |
| 405753 | DUOXA2 | PTC06 | Human | Thyroid | PTC | 9.16e-07 | 3.58e-01 | 0.2057 |
| 405753 | DUOXA2 | PTC07 | Human | Thyroid | PTC | 2.02e-22 | 5.64e-01 | 0.2044 |
| Page: 1 |
| Tissue | Expression Dynamics | Abbreviation |
| Cervix | 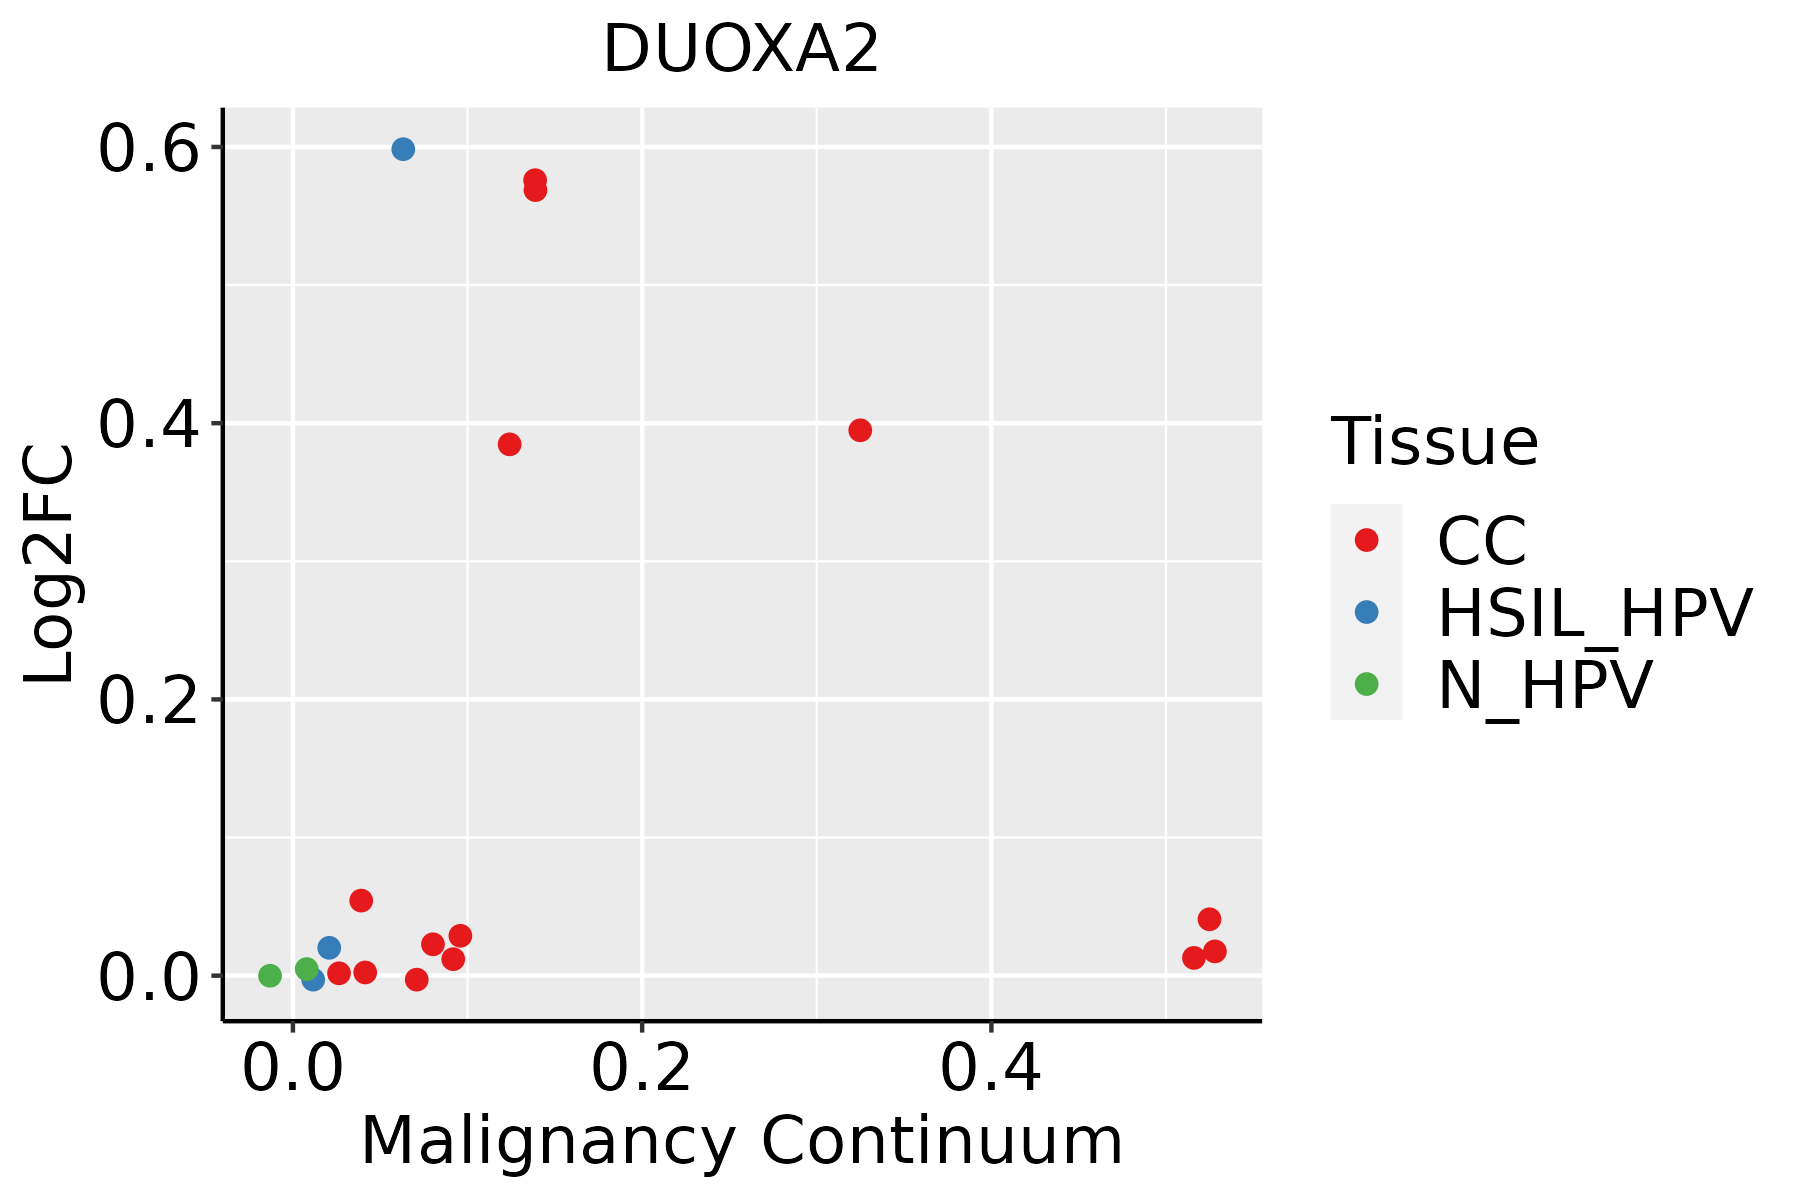 | CC: Cervix cancer |
| HSIL_HPV: HPV-infected high-grade squamous intraepithelial lesions | ||
| N_HPV: HPV-infected normal cervix | ||
| Esophagus | 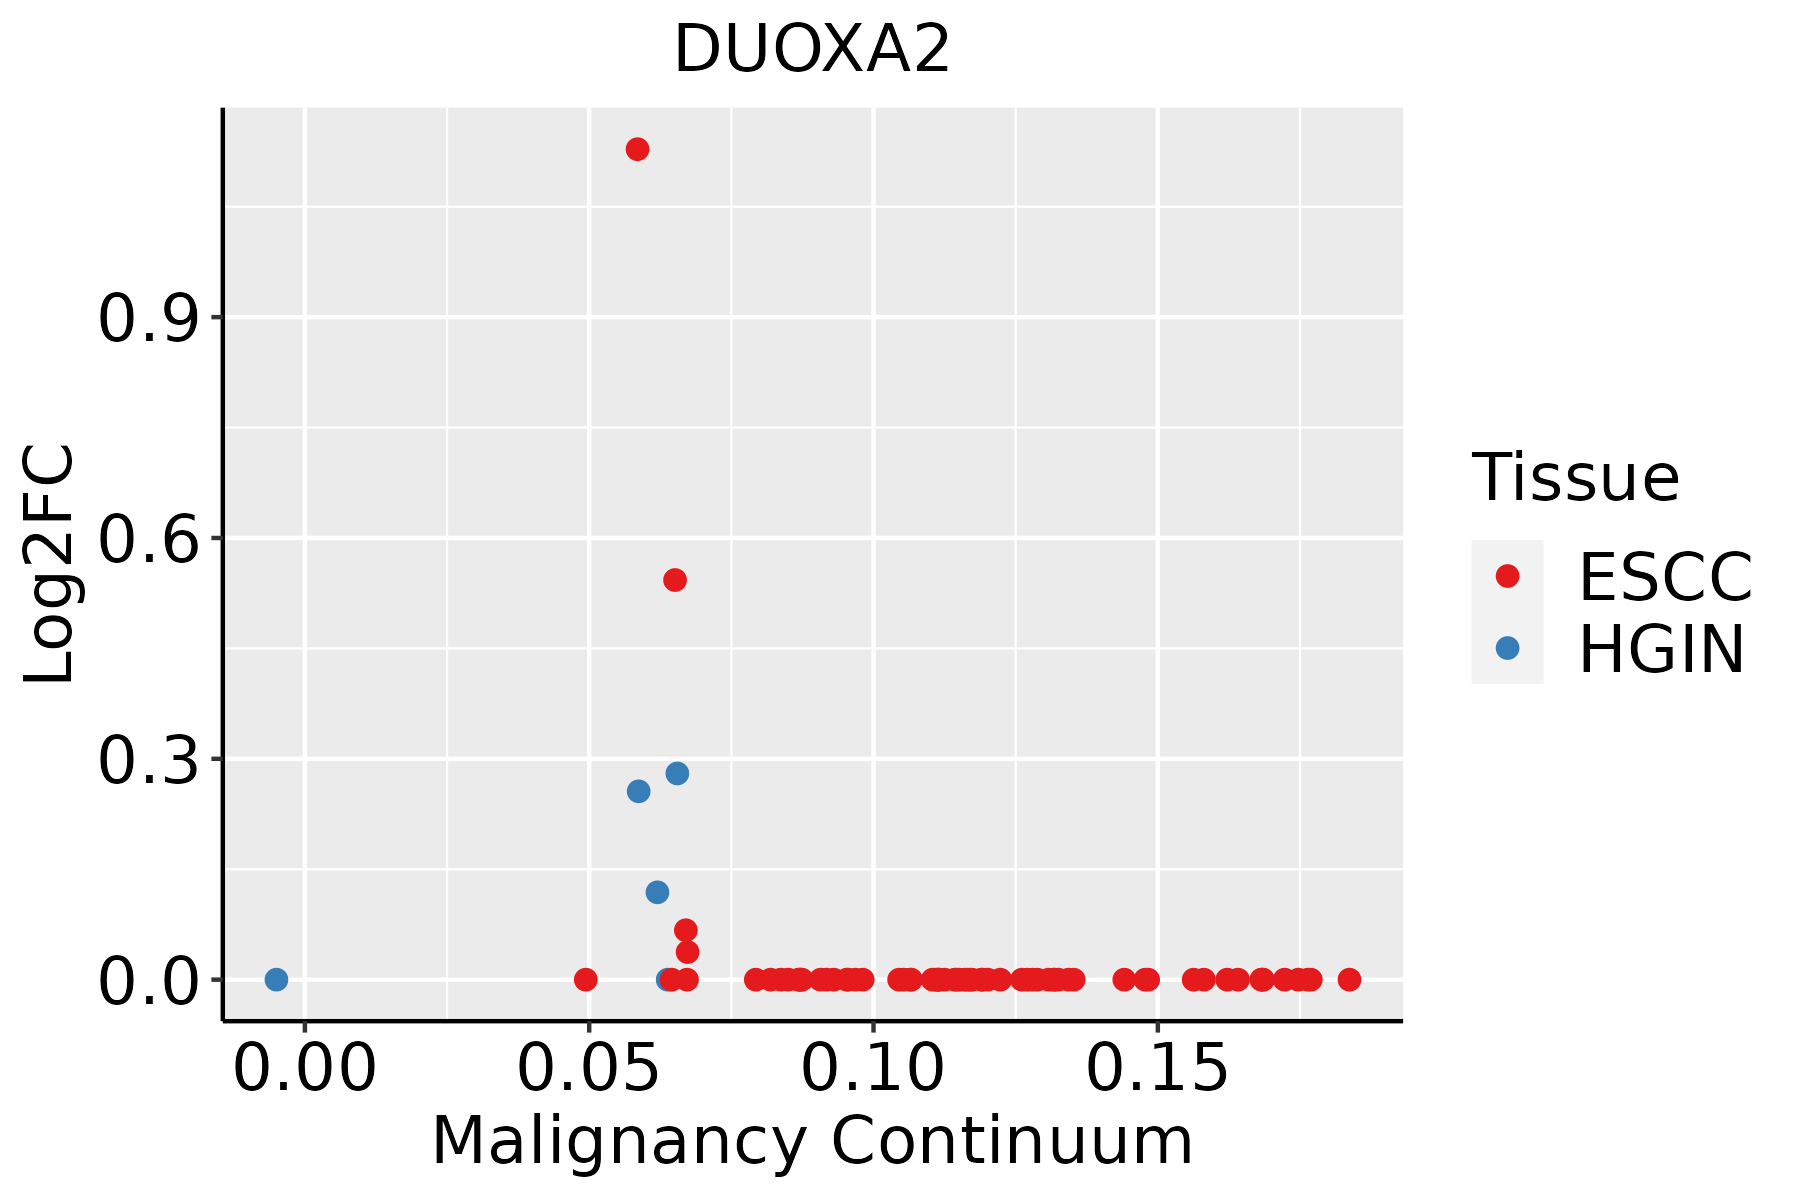 | ESCC: Esophageal squamous cell carcinoma |
| HGIN: High-grade intraepithelial neoplasias | ||
| LGIN: Low-grade intraepithelial neoplasias | ||
| GC |  | CAG: Chronic atrophic gastritis |
| CAG with IM: Chronic atrophic gastritis with intestinal metaplasia | ||
| CSG: Chronic superficial gastritis | ||
| GC: Gastric cancer | ||
| SIM: Severe intestinal metaplasia | ||
| WIM: Wild intestinal metaplasia | ||
| Thyroid | 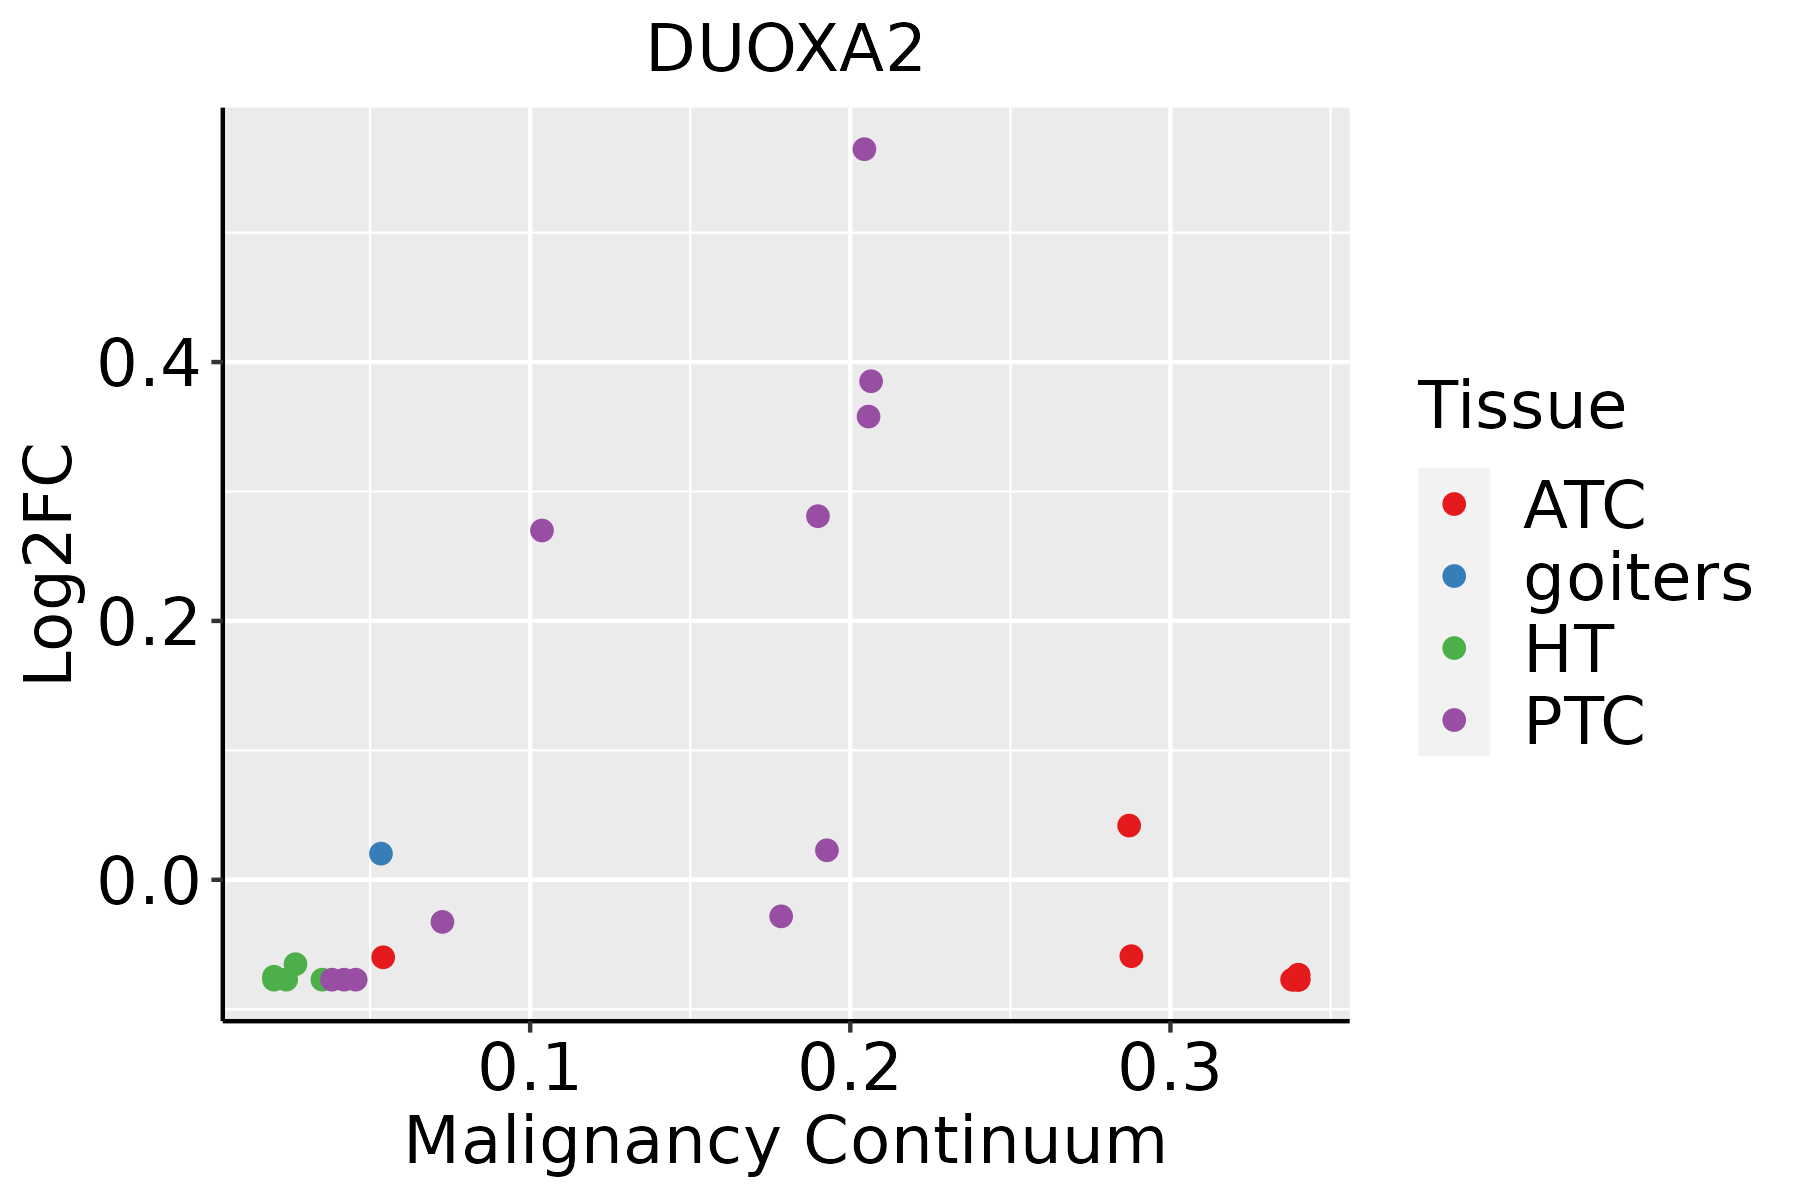 | ATC: Anaplastic thyroid cancer |
| HT: Hashimoto's thyroiditis | ||
| PTC: Papillary thyroid cancer |
| ∗log2FC in expression of this searched gene in stem-like cells from each diseased tissue sample relative to stem-like cells in normal samples in each tissue plotted against the malignancy continuum. Samples are colored based on if they are from different disease stage. |
Top |
Malignant transformation related pathway analysis |
| Find out the enriched GO biological processes and KEGG pathways involved in transition from healthy to precancer to cancer |
| Tissue | Disease Stage | Enriched GO biological Processes |
| Colorectum | AD |  |
| Colorectum | SER |  |
| Colorectum | MSS |  |
| Colorectum | MSI-H |  |
| Colorectum | FAP |  |
| ∗Top 15 enriched GO BP terms are showed in the bar plot of each disease state in each tissue. Each row represents a significant GO biological process which is colored according to the -log10(p.adjust). |
| Page: 1 2 3 4 5 6 7 8 9 |
| GO ID | Tissue | Disease Stage | Description | Gene Ratio | Bg Ratio | pvalue | p.adjust | Count |
| GO:00507273 | Cervix | CC | regulation of inflammatory response | 75/2311 | 386/18723 | 3.95e-05 | 6.18e-04 | 75 |
| GO:00516048 | Cervix | CC | protein maturation | 56/2311 | 294/18723 | 5.90e-04 | 5.59e-03 | 56 |
| GO:20003799 | Cervix | CC | positive regulation of reactive oxygen species metabolic process | 20/2311 | 76/18723 | 7.02e-04 | 6.40e-03 | 20 |
| GO:00725939 | Cervix | CC | reactive oxygen species metabolic process | 47/2311 | 239/18723 | 7.74e-04 | 6.87e-03 | 47 |
| GO:20003779 | Cervix | CC | regulation of reactive oxygen species metabolic process | 32/2311 | 157/18723 | 2.78e-03 | 1.87e-02 | 32 |
| GO:00427438 | Cervix | CC | hydrogen peroxide metabolic process | 14/2311 | 58/18723 | 9.57e-03 | 4.73e-02 | 14 |
| GO:19034095 | Cervix | CC | reactive oxygen species biosynthetic process | 15/2311 | 64/18723 | 9.89e-03 | 4.85e-02 | 15 |
| GO:005072711 | Cervix | HSIL_HPV | regulation of inflammatory response | 41/737 | 386/18723 | 8.30e-09 | 1.03e-06 | 41 |
| GO:200037914 | Cervix | HSIL_HPV | positive regulation of reactive oxygen species metabolic process | 11/737 | 76/18723 | 1.81e-04 | 3.43e-03 | 11 |
| GO:0050665 | Cervix | HSIL_HPV | hydrogen peroxide biosynthetic process | 5/737 | 18/18723 | 5.21e-04 | 7.47e-03 | 5 |
| GO:190340911 | Cervix | HSIL_HPV | reactive oxygen species biosynthetic process | 9/737 | 64/18723 | 8.56e-04 | 1.10e-02 | 9 |
| GO:0018958 | Cervix | HSIL_HPV | phenol-containing compound metabolic process | 12/737 | 110/18723 | 1.31e-03 | 1.50e-02 | 12 |
| GO:200037714 | Cervix | HSIL_HPV | regulation of reactive oxygen species metabolic process | 15/737 | 157/18723 | 1.37e-03 | 1.56e-02 | 15 |
| GO:004274312 | Cervix | HSIL_HPV | hydrogen peroxide metabolic process | 8/737 | 58/18723 | 1.87e-03 | 1.97e-02 | 8 |
| GO:19034285 | Cervix | HSIL_HPV | positive regulation of reactive oxygen species biosynthetic process | 5/737 | 24/18723 | 2.12e-03 | 2.17e-02 | 5 |
| GO:007259314 | Cervix | HSIL_HPV | reactive oxygen species metabolic process | 19/737 | 239/18723 | 2.99e-03 | 2.76e-02 | 19 |
| GO:00065755 | Cervix | HSIL_HPV | cellular modified amino acid metabolic process | 16/737 | 188/18723 | 3.18e-03 | 2.89e-02 | 16 |
| GO:19034263 | Cervix | HSIL_HPV | regulation of reactive oxygen species biosynthetic process | 7/737 | 52/18723 | 4.07e-03 | 3.49e-02 | 7 |
| GO:005160418 | Esophagus | ESCC | protein maturation | 189/8552 | 294/18723 | 7.64e-11 | 2.39e-09 | 189 |
| GO:200037718 | Esophagus | ESCC | regulation of reactive oxygen species metabolic process | 100/8552 | 157/18723 | 3.87e-06 | 4.17e-05 | 100 |
| Page: 1 2 3 |
| Pathway ID | Tissue | Disease Stage | Description | Gene Ratio | Bg Ratio | pvalue | p.adjust | qvalue | Count |
| Page: 1 |
Top |
Cell-cell communication analysis |
| Identification of potential cell-cell interactions between two cell types and their ligand-receptor pairs for different disease states |
| Ligand | Receptor | LRpair | Pathway | Tissue | Disease Stage |
| Page: 1 |
Top |
Single-cell gene regulatory network inference analysis |
| Find out the significant the regulons (TFs) and the target genes of each regulon across cell types for different disease states |
| TF | Cell Type | Tissue | Disease Stage | Target Gene | RSS | Regulon Activity |
| ∗The dot plots of a searched regulon are shown for all cell subpopulations in each disease state of each tissue based on the regulon specific score inferred using pySCENIC and by calculating the average expression. |
| Page: 1 |
Top |
Somatic mutation of malignant transformation related genes |
| Annotation of somatic variants for genes involved in malignant transformation |
| Hugo Symbol | Variant Class | Variant Classification | dbSNP RS | HGVSc | HGVSp | HGVSp Short | SWISSPROT | BIOTYPE | SIFT | PolyPhen | Tumor Sample Barcode | Tissue | Histology | Sex | Age | Stage | Therapy Types | Drugs | Outcome |
| DUOXA2 | SNV | Missense_Mutation | rs746342250 | c.925N>A | p.Ala309Thr | p.A309T | Q1HG44 | protein_coding | tolerated(0.47) | benign(0) | TCGA-A8-A08X-01 | Breast | breast invasive carcinoma | Female | <65 | III/IV | Chemotherapy | doxorubicin | PD |
| DUOXA2 | deletion | Frame_Shift_Del | novel | c.108delN | p.Ser37AlafsTer19 | p.S37Afs*19 | Q1HG44 | protein_coding | TCGA-EW-A2FV-01 | Breast | breast invasive carcinoma | Female | <65 | III/IV | Chemotherapy | docetaxel | SD | ||
| DUOXA2 | SNV | Missense_Mutation | novel | c.548N>T | p.Thr183Met | p.T183M | Q1HG44 | protein_coding | tolerated(0.26) | benign(0.146) | TCGA-DS-A1OD-01 | Cervix | cervical & endocervical cancer | Female | <65 | I/II | Chemotherapy | cisplatin | SD |
| DUOXA2 | SNV | Missense_Mutation | novel | c.586G>A | p.Val196Met | p.V196M | Q1HG44 | protein_coding | tolerated(0.45) | benign(0.018) | TCGA-A6-2686-01 | Colorectum | colon adenocarcinoma | Female | >=65 | I/II | Unknown | Unknown | SD |
| DUOXA2 | SNV | Missense_Mutation | novel | c.548N>T | p.Thr183Met | p.T183M | Q1HG44 | protein_coding | tolerated(0.26) | benign(0.146) | TCGA-AA-3695-01 | Colorectum | colon adenocarcinoma | Female | <65 | III/IV | Unknown | Unknown | SD |
| DUOXA2 | SNV | Missense_Mutation | c.418N>A | p.Ala140Thr | p.A140T | Q1HG44 | protein_coding | tolerated(0.21) | benign(0.09) | TCGA-AA-3833-01 | Colorectum | colon adenocarcinoma | Female | <65 | I/II | Unknown | Unknown | SD | |
| DUOXA2 | SNV | Missense_Mutation | rs753835283 | c.193G>A | p.Ala65Thr | p.A65T | Q1HG44 | protein_coding | deleterious(0.04) | benign(0.141) | TCGA-AA-3977-01 | Colorectum | colon adenocarcinoma | Male | >=65 | I/II | Unknown | Unknown | SD |
| DUOXA2 | SNV | Missense_Mutation | novel | c.175N>A | p.Leu59Ile | p.L59I | Q1HG44 | protein_coding | tolerated(0.22) | benign(0.076) | TCGA-CA-6717-01 | Colorectum | colon adenocarcinoma | Male | <65 | I/II | Chemotherapy | oxaliplatin | CR |
| DUOXA2 | SNV | Missense_Mutation | c.68N>T | p.Pro23Leu | p.P23L | Q1HG44 | protein_coding | tolerated(0.35) | possibly_damaging(0.815) | TCGA-WS-AB45-01 | Colorectum | colon adenocarcinoma | Female | <65 | I/II | Unknown | Unknown | SD | |
| DUOXA2 | SNV | Missense_Mutation | novel | c.71N>C | p.Leu24Pro | p.L24P | Q1HG44 | protein_coding | deleterious(0.04) | probably_damaging(0.972) | TCGA-A5-A0G1-01 | Endometrium | uterine corpus endometrioid carcinoma | Female | >=65 | I/II | Unknown | Unknown | SD |
| Page: 1 2 3 4 |
Top |
Related drugs of malignant transformation related genes |
| Identification of chemicals and drugs interact with genes involved in malignant transfromation |
| (DGIdb 4.0) |
| Entrez ID | Symbol | Category | Interaction Types | Drug Claim Name | Drug Name | PMIDs |
| Page: 1 |

Copyright 2023-Present -The University of Texas Health Science Center at Houston |