Schematic overview of the cellular and molecular mechanisms involved in the cancer progression, including the proposed cellular and molecular mechanisms in cancer cells trajectory. AT1: alveolar type 1 cells; AT2: alveolar type 2 cells; AAH: atypical adenomatous hyperplasia; AIS: adenocarcinoma in situ; MIA: minimally invasive adenocarcinoma; IA: invasive adenocarcinoma; EMT: epithelial-mesenchymal transition

Home

Download

Statistics

Help

Contact

Center for Computational Systems Medicine
leaf

Gene summary

leaf

Malignant transformation analysis

leaf

Malignant transformation related pathway analysis

leaf

Cell-cell communication analysis

leaf

Single-cell gene regulatory network inference analysis

leaf

Somatic mutation of malignant transformation related genes

leaf

Related drugs of malignant transformation related genes

Gene: DUOXA1

Gene summary for DUOXA1

check button Gene summary.

Gene informationSpeciesHuman
Gene symbol

DUOXA1

Gene ID

90527

Gene namedual oxidase maturation factor 1
Gene AliasNIP
Cytomap15q21.1
Gene Typeprotein-coding
GO ID

GO:0006575

UniProtAcc

A8K9Q6


Top

Malignant transformation analysis

check button Identification of the aberrant gene expression in precancerous and cancerous lesions by comparing the gene expression of stem-like cells in diseased tissues with normal stem cells
check button Malignant transformation involving gene list.
Entrez IDSymbolReplicatesSpeciesOrganTissueAdj P-valueLog2FCMalignancy
90527DUOXA1LZE4THumanEsophagusESCC3.37e-041.60e-010.0811
90527DUOXA1LZE8THumanEsophagusESCC3.81e-082.34e-010.067
90527DUOXA1LZE20THumanEsophagusESCC2.00e-041.02e-010.0662
90527DUOXA1LZE24THumanEsophagusESCC1.17e-202.30e-010.0596
90527DUOXA1P1T-EHumanEsophagusESCC3.46e-074.79e-010.0875
90527DUOXA1P2T-EHumanEsophagusESCC8.48e-111.17e-010.1177
90527DUOXA1P4T-EHumanEsophagusESCC4.40e-101.73e-010.1323
90527DUOXA1P5T-EHumanEsophagusESCC1.10e-123.14e-010.1327
90527DUOXA1P8T-EHumanEsophagusESCC1.23e-073.27e-020.0889
90527DUOXA1P9T-EHumanEsophagusESCC4.51e-092.28e-010.1131
90527DUOXA1P10T-EHumanEsophagusESCC7.73e-173.68e-010.116
90527DUOXA1P11T-EHumanEsophagusESCC1.01e-026.93e-020.1426
90527DUOXA1P12T-EHumanEsophagusESCC3.39e-112.41e-010.1122
90527DUOXA1P16T-EHumanEsophagusESCC4.07e-181.25e-010.1153
90527DUOXA1P20T-EHumanEsophagusESCC1.90e-122.46e-010.1124
90527DUOXA1P21T-EHumanEsophagusESCC5.15e-163.63e-010.1617
90527DUOXA1P22T-EHumanEsophagusESCC4.50e-151.20e-010.1236
90527DUOXA1P23T-EHumanEsophagusESCC1.24e-083.13e-010.108
90527DUOXA1P24T-EHumanEsophagusESCC9.39e-128.09e-020.1287
90527DUOXA1P26T-EHumanEsophagusESCC6.12e-171.54e-010.1276
Page: 1 2 3 4 

check button Transcriptomic changes along malignancy continuum.
TissueExpression DynamicsAbbreviation
EsophagusThe image shows the transcriptomic changes along malignancy continuum.log2FC in expression of this searched gene in stem-like cells from each diseased tissue sample relative to stem-like cells in normal samples in each tissue plotted against the malignancy continuum. Samples are colored based on if they are from different disease stage.
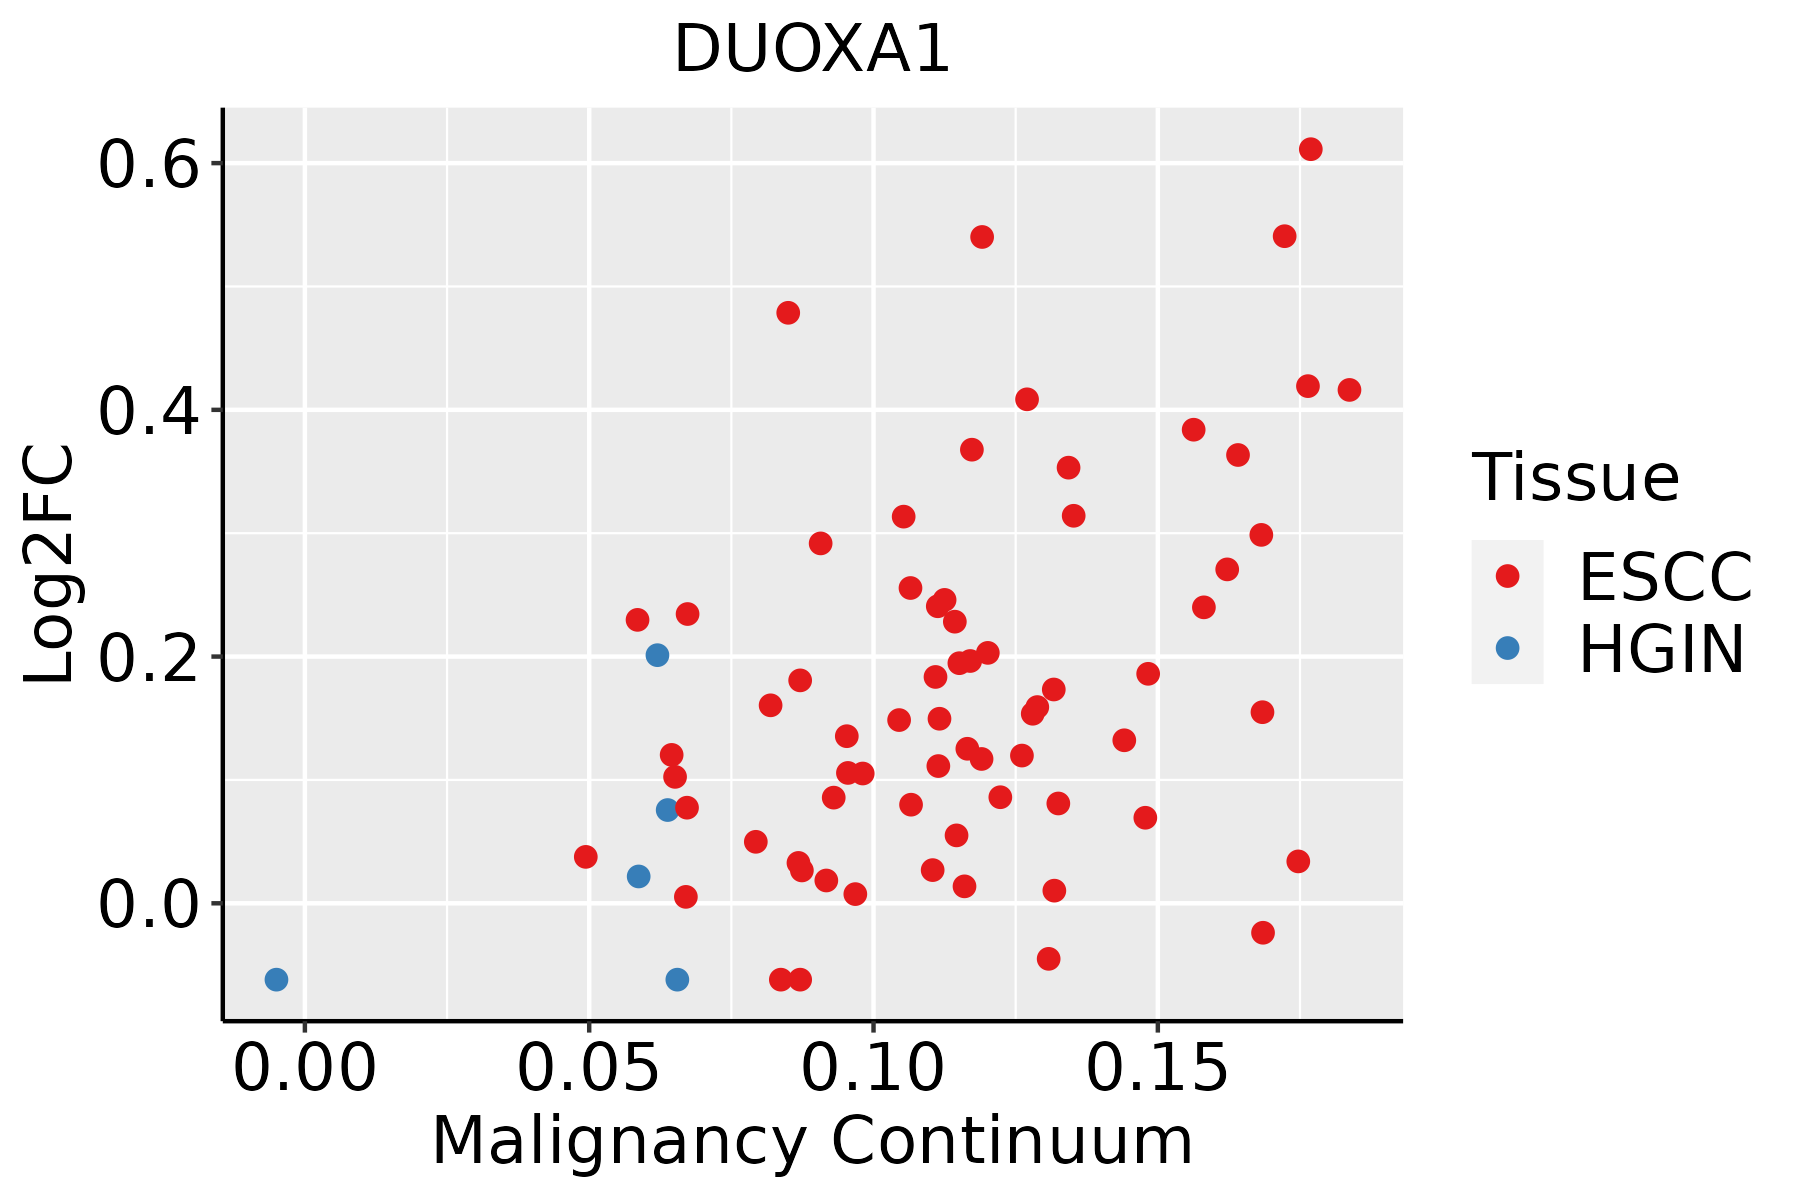
ESCC: Esophageal squamous cell carcinoma
HGIN: High-grade intraepithelial neoplasias
LGIN: Low-grade intraepithelial neoplasias
Oral CavityThe image shows the transcriptomic changes along malignancy continuum.log2FC in expression of this searched gene in stem-like cells from each diseased tissue sample relative to stem-like cells in normal samples in each tissue plotted against the malignancy continuum. Samples are colored based on if they are from different disease stage.
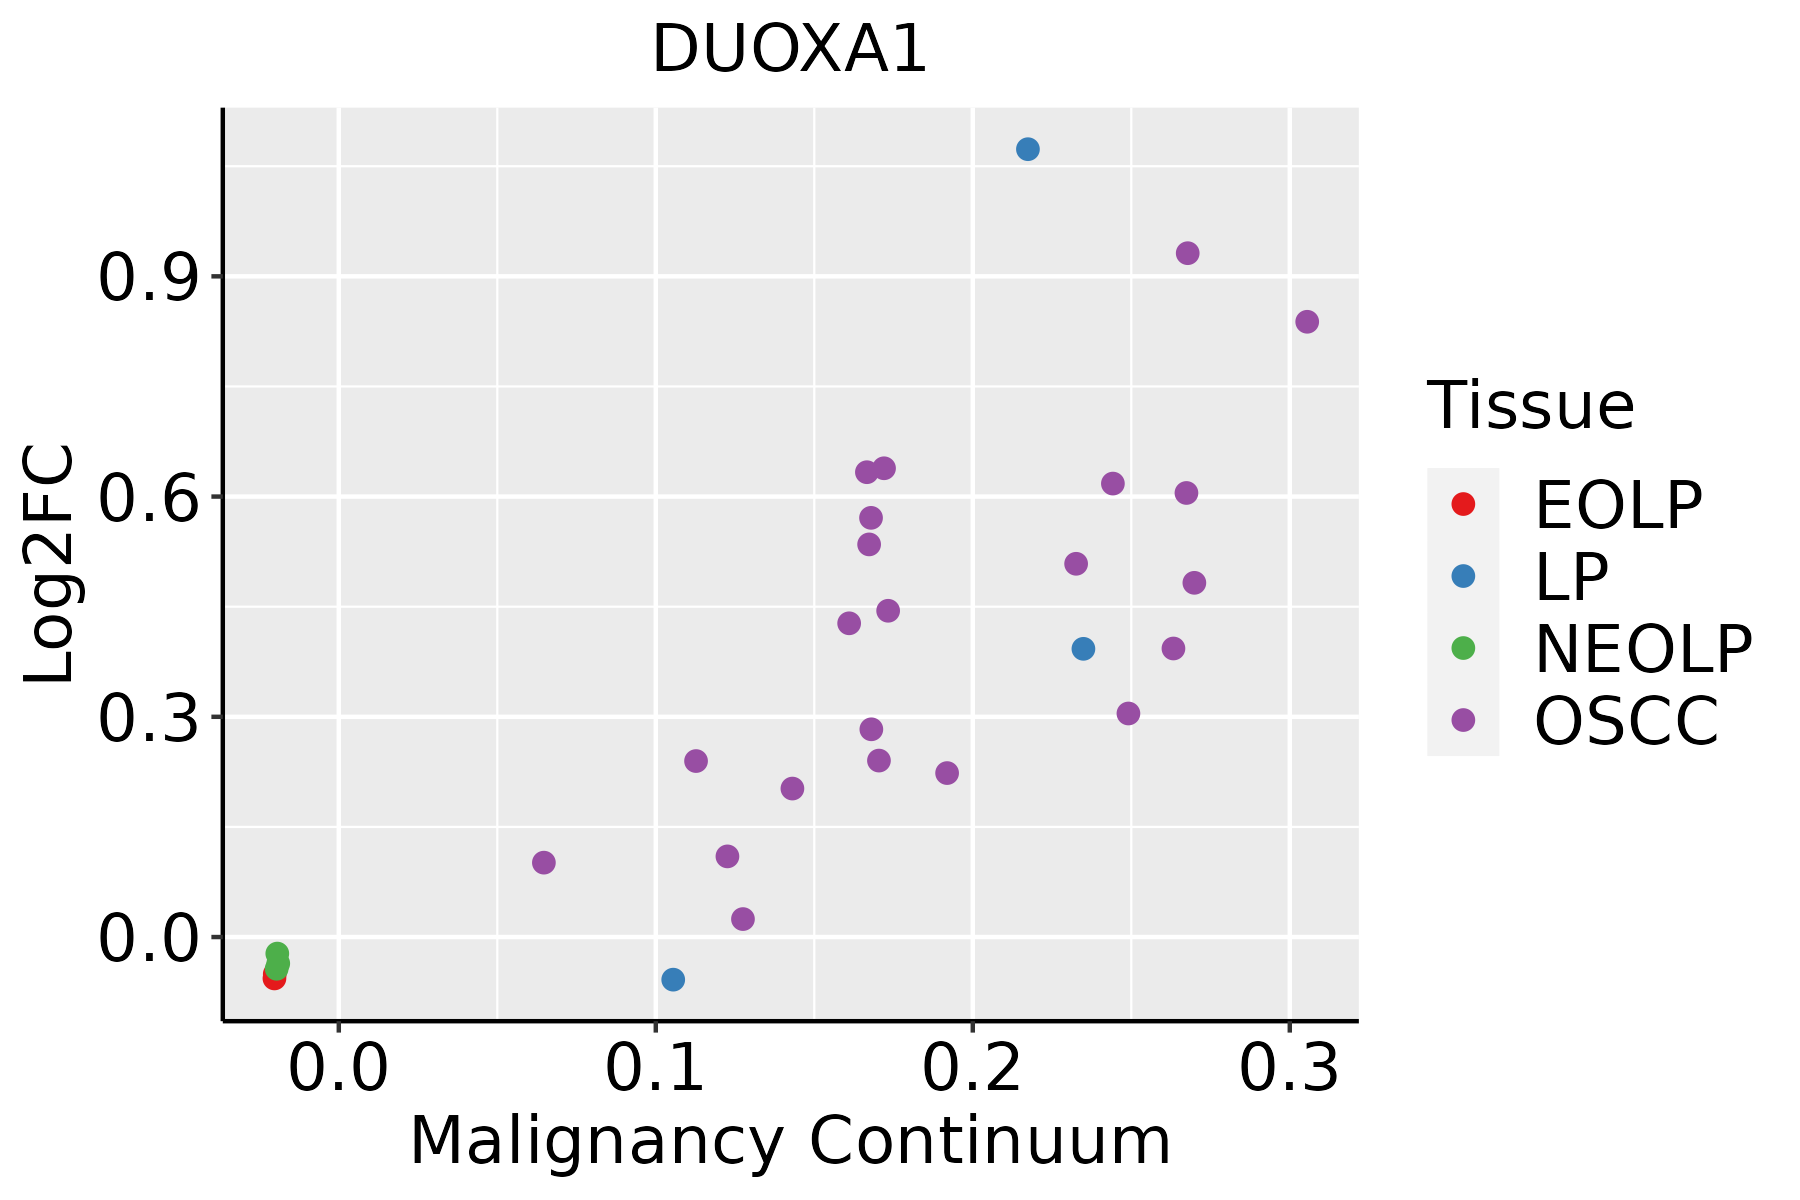
EOLP: Erosive Oral lichen planus
LP: leukoplakia
NEOLP: Non-erosive oral lichen planus
OSCC: Oral squamous cell carcinoma
SkinThe image shows the transcriptomic changes along malignancy continuum.log2FC in expression of this searched gene in stem-like cells from each diseased tissue sample relative to stem-like cells in normal samples in each tissue plotted against the malignancy continuum. Samples are colored based on if they are from different disease stage.
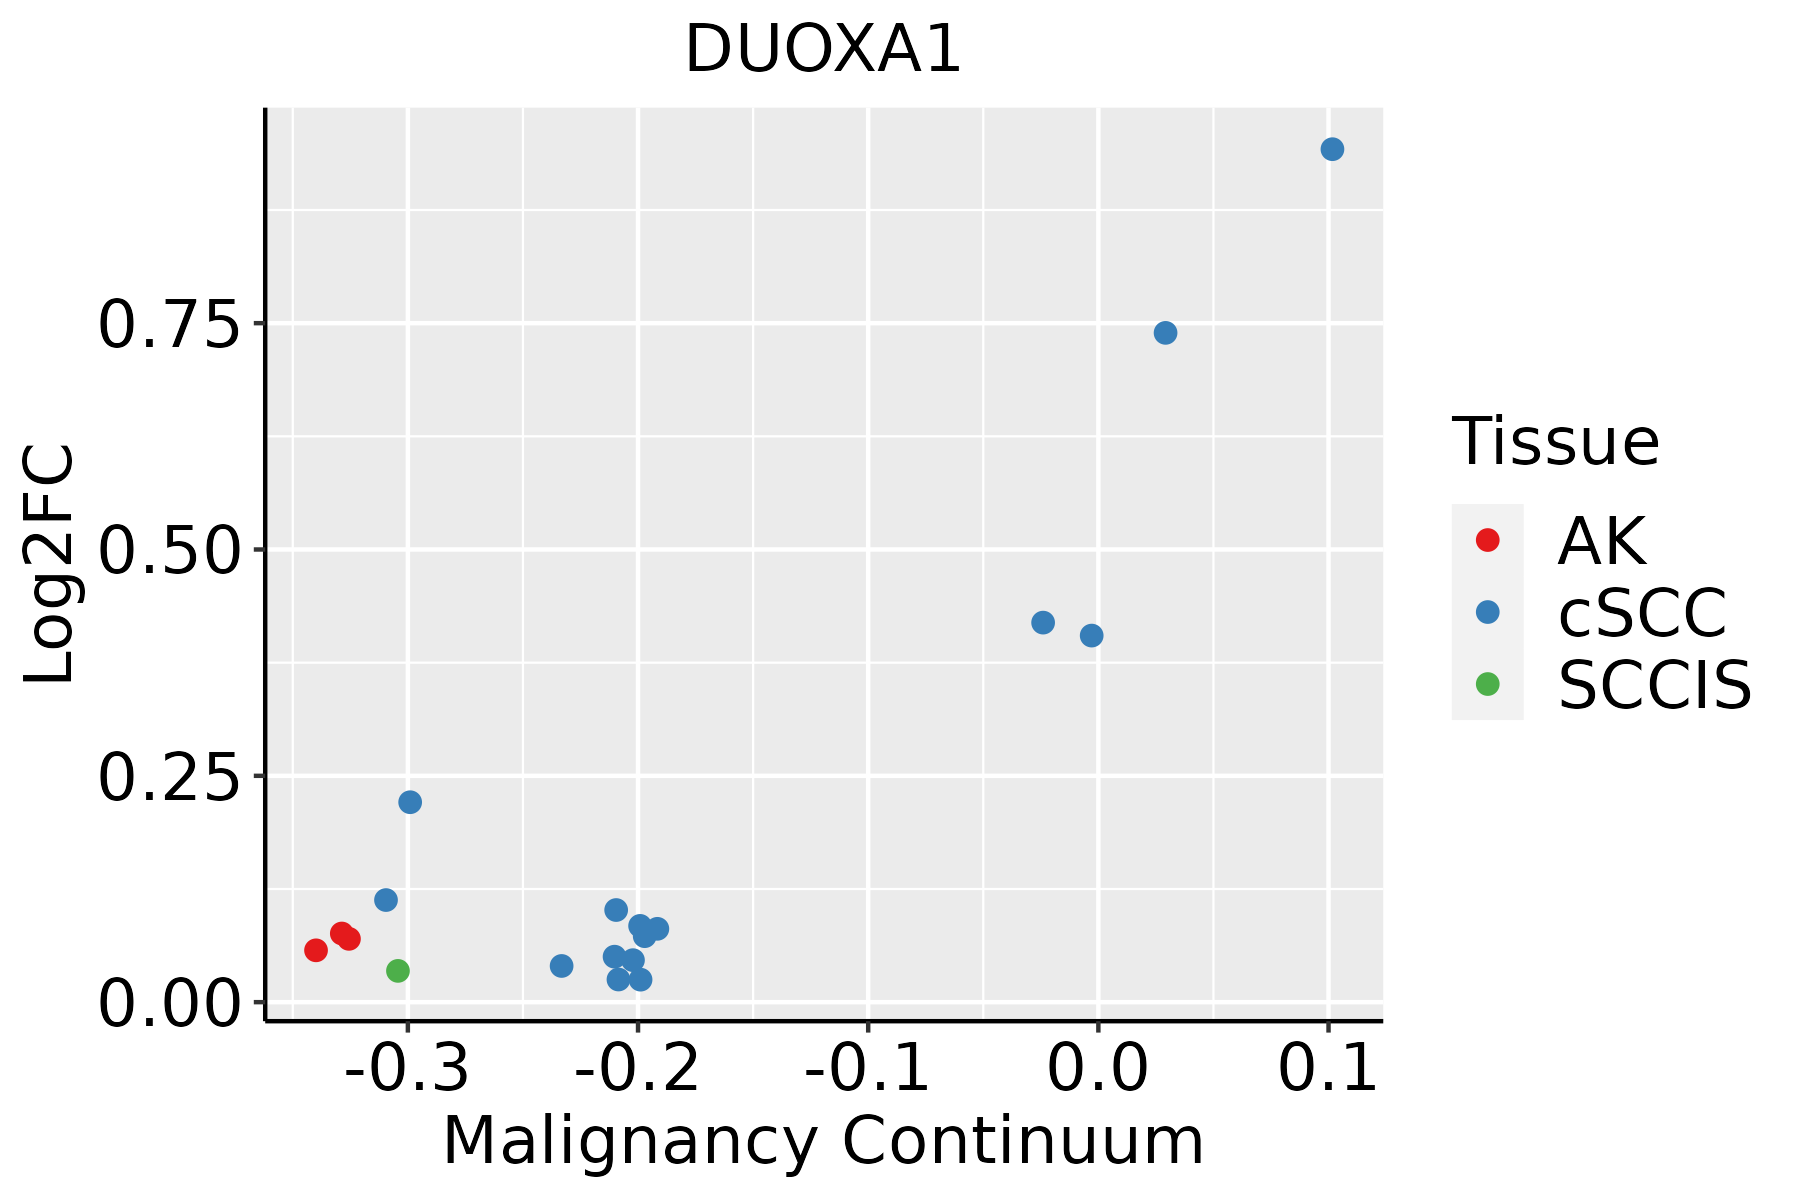
AK: Actinic keratosis
cSCC: Cutaneous squamous cell carcinoma
SCCIS:squamous cell carcinoma in situ
ThyroidThe image shows the transcriptomic changes along malignancy continuum.log2FC in expression of this searched gene in stem-like cells from each diseased tissue sample relative to stem-like cells in normal samples in each tissue plotted against the malignancy continuum. Samples are colored based on if they are from different disease stage.
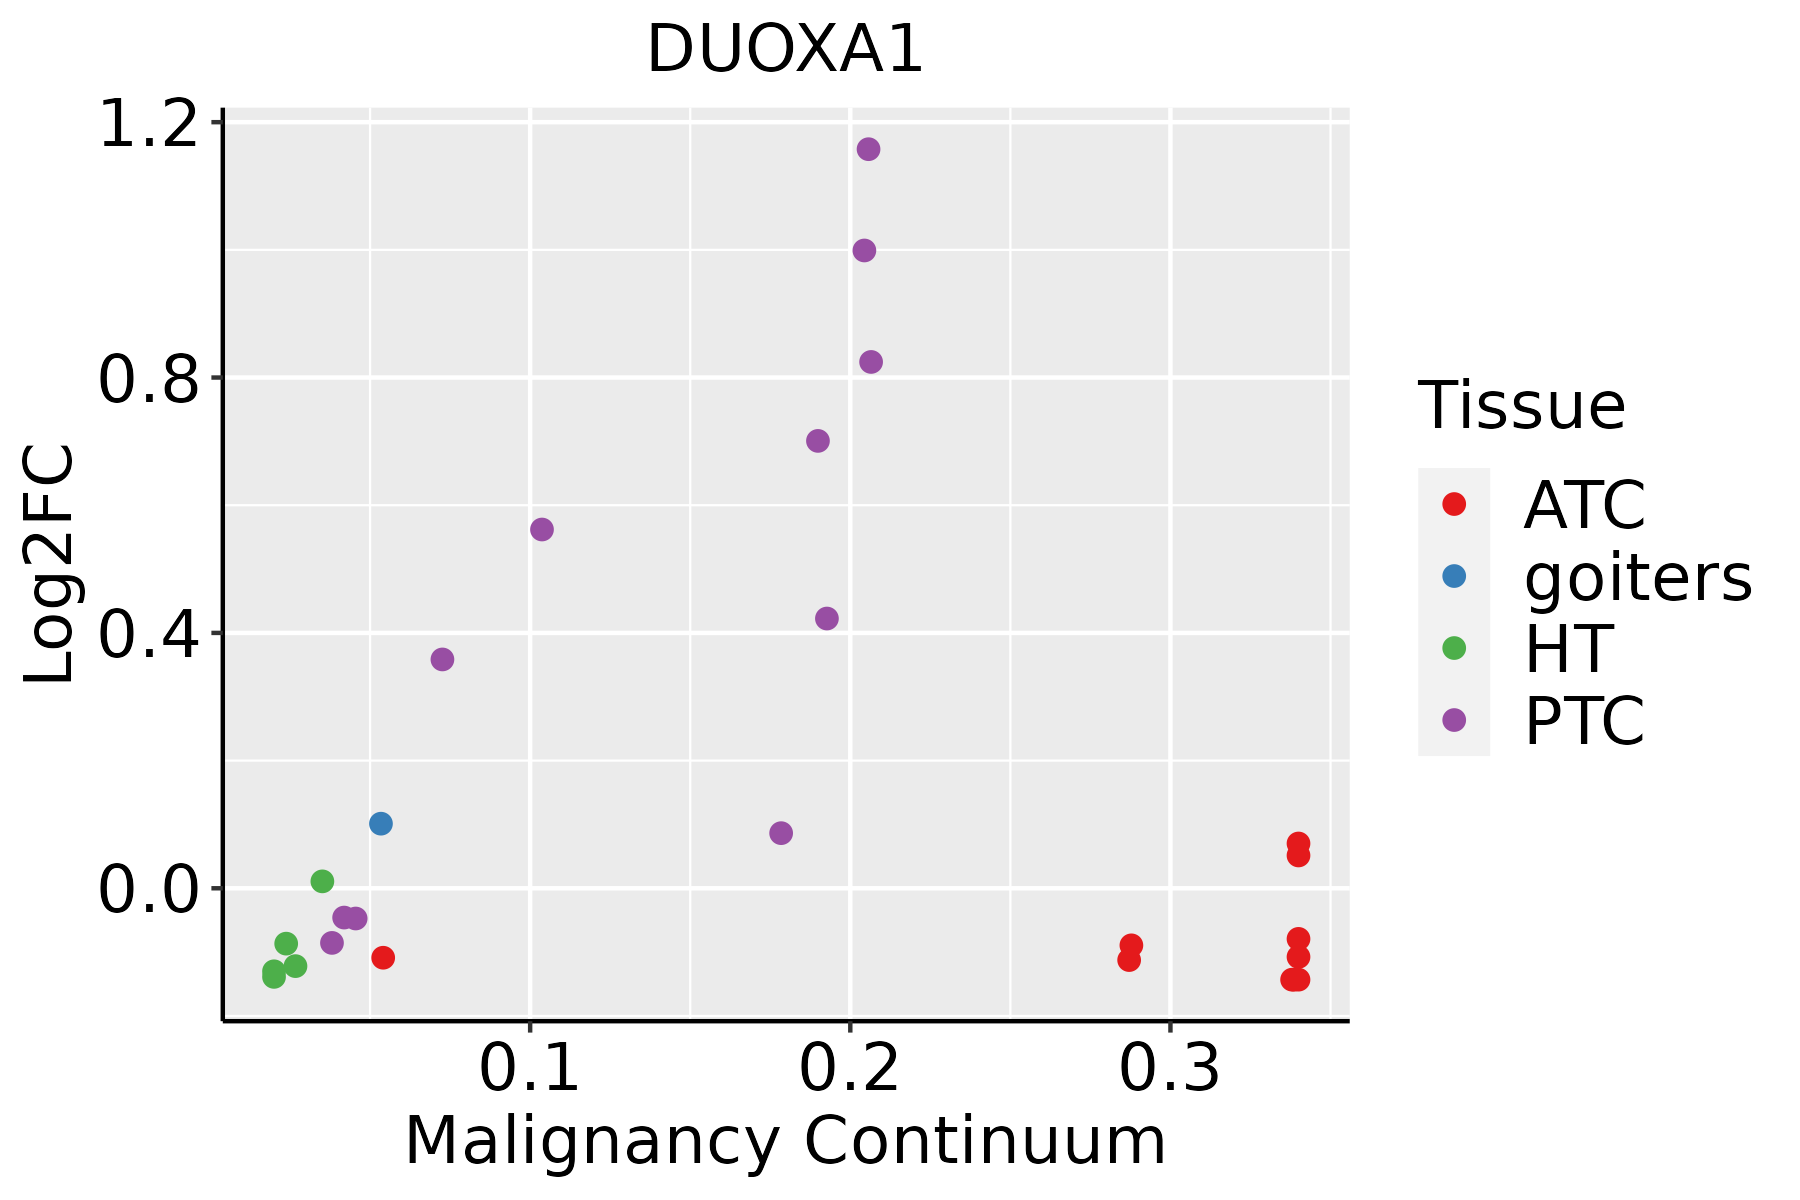
ATC: Anaplastic thyroid cancer
HT: Hashimoto's thyroiditis
PTC: Papillary thyroid cancer
∗log2FC in expression of this searched gene in stem-like cells from each diseased tissue sample relative to stem-like cells in normal samples in each tissue plotted against the malignancy continuum. Samples are colored based on if they are from different disease stage.

Top

Malignant transformation related pathway analysis

check buttonFind out the enriched GO biological processes and KEGG pathways involved in transition from healthy to precancer to cancer
check button Figure of enriched GO biological processes.
TissueDisease StageEnriched GO biological Processes
ColorectumADGO analysis - Figure of enriched GO biological processes: Top 15 enriched GO BP terms are showed in the bar plot of each disease state in each tissue. Each row represents a significant GO biological process which is colored according to the -log10(p.adjust).
ColorectumSERGO analysis - Figure of enriched GO biological processes: Top 15 enriched GO BP terms are showed in the bar plot of each disease state in each tissue. Each row represents a significant GO biological process which is colored according to the -log10(p.adjust).
ColorectumMSSGO analysis - Figure of enriched GO biological processes: Top 15 enriched GO BP terms are showed in the bar plot of each disease state in each tissue. Each row represents a significant GO biological process which is colored according to the -log10(p.adjust).
ColorectumMSI-HGO analysis - Figure of enriched GO biological processes: Top 15 enriched GO BP terms are showed in the bar plot of each disease state in each tissue. Each row represents a significant GO biological process which is colored according to the -log10(p.adjust).
ColorectumFAPGO analysis - Figure of enriched GO biological processes: Top 15 enriched GO BP terms are showed in the bar plot of each disease state in each tissue. Each row represents a significant GO biological process which is colored according to the -log10(p.adjust).
∗Top 15 enriched GO BP terms are showed in the bar plot of each disease state in each tissue. Each row represents a significant GO biological process which is colored according to the -log10(p.adjust).
Page: 1 2 3 4 5 6 7 8 9 

check button Enriched GO biological processes.
GO IDTissueDisease StageDescriptionGene RatioBg Ratiopvaluep.adjustCount
GO:200037718EsophagusESCCregulation of reactive oxygen species metabolic process100/8552157/187233.87e-064.17e-05100
GO:00065757EsophagusESCCcellular modified amino acid metabolic process112/8552188/187238.31e-056.06e-04112
GO:007259318EsophagusESCCreactive oxygen species metabolic process137/8552239/187231.82e-041.16e-03137
GO:00103101EsophagusESCCregulation of hydrogen peroxide metabolic process16/855222/187239.46e-033.28e-0216
GO:200037918EsophagusESCCpositive regulation of reactive oxygen species metabolic process45/855276/187231.21e-024.04e-0245
GO:200037716Oral cavityOSCCregulation of reactive oxygen species metabolic process92/7305157/187234.96e-077.27e-0692
GO:007259316Oral cavityOSCCreactive oxygen species metabolic process122/7305239/187239.73e-057.34e-04122
GO:200037916Oral cavityOSCCpositive regulation of reactive oxygen species metabolic process43/730576/187231.41e-036.84e-0343
GO:00065756Oral cavityOSCCcellular modified amino acid metabolic process91/7305188/187235.33e-032.07e-0291
GO:200037717Oral cavityLPregulation of reactive oxygen species metabolic process67/4623157/187235.54e-071.51e-0567
GO:200037917Oral cavityLPpositive regulation of reactive oxygen species metabolic process35/462376/187234.04e-055.90e-0435
GO:007259317Oral cavityLPreactive oxygen species metabolic process85/4623239/187231.04e-041.26e-0385
GO:000657512Oral cavityLPcellular modified amino acid metabolic process64/4623188/187232.43e-031.73e-0264
GO:00065758SkincSCCcellular modified amino acid metabolic process73/4864188/187237.11e-056.85e-0473
GO:200037719SkincSCCregulation of reactive oxygen species metabolic process58/4864157/187231.55e-039.60e-0358
GO:007259319SkincSCCreactive oxygen species metabolic process81/4864239/187233.80e-032.03e-0281
GO:00323502SkincSCCregulation of hormone metabolic process16/486435/187239.09e-034.16e-0216
GO:0072593110ThyroidPTCreactive oxygen species metabolic process108/5968239/187231.02e-051.13e-04108
GO:000657513ThyroidPTCcellular modified amino acid metabolic process85/5968188/187238.29e-057.01e-0485
GO:2000377110ThyroidPTCregulation of reactive oxygen species metabolic process71/5968157/187233.03e-042.12e-0371
Page: 1 2 

check button Enriched KEGG pathways.
Pathway IDTissueDisease StageDescriptionGene RatioBg Ratiopvaluep.adjustqvalueCount
Page: 1 

Top

Cell-cell communication analysis

check buttonIdentification of potential cell-cell interactions between two cell types and their ligand-receptor pairs for different disease states
LigandReceptorLRpairPathwayTissueDisease Stage
Page: 1 

Top

Single-cell gene regulatory network inference analysis

check buttonFind out the significant the regulons (TFs) and the target genes of each regulon across cell types for different disease states
TFCell TypeTissueDisease StageTarget GeneRSSRegulon Activity
∗The dot plots of a searched regulon are shown for all cell subpopulations in each disease state of each tissue based on the regulon specific score inferred using pySCENIC and by calculating the average expression.
Page: 1 

Top

Somatic mutation of malignant transformation related genes

check buttonAnnotation of somatic variants for genes involved in malignant transformation
Hugo SymbolVariant ClassVariant ClassificationdbSNP RSHGVScHGVSpHGVSp ShortSWISSPROTBIOTYPESIFTPolyPhenTumor Sample BarcodeTissueHistologySexAgeStageTherapy TypesDrugsOutcome
DUOXA1SNVMissense_Mutationc.1222C>Tp.Arg408Trpp.R408WQ1HG43protein_codingdeleterious_low_confidence(0.01)benign(0.249)TCGA-BH-A0HF-01Breastbreast invasive carcinomaFemale>=65I/IIHormone TherapyarimidexSD
DUOXA1deletionFrame_Shift_Delnovelc.140delNp.Gly47GlufsTer12p.G47Efs*12Q1HG43protein_codingTCGA-D8-A27V-01Breastbreast invasive carcinomaFemale<65I/IIHormone TherapytamoxiphenSD
DUOXA1SNVMissense_Mutationnovelc.1220C>Ap.Pro407Glnp.P407QQ1HG43protein_codingdeleterious_low_confidence(0)possibly_damaging(0.694)TCGA-FU-A2QG-01Cervixcervical & endocervical cancerFemale<65I/IIUnknownUnknownSD
DUOXA1SNVMissense_Mutationc.128N>Gp.Pro43Argp.P43RQ1HG43protein_codingdeleterious(0)probably_damaging(1)TCGA-JW-A5VG-01Cervixcervical & endocervical cancerFemale<65I/IIChemotherapycisplatinSD
DUOXA1deletionIn_Frame_Delnovelc.1014_1037delNNNNNNNNNNNNNNNNNNNNNNNNp.Val339_Leu346delp.V339_L346delQ1HG43protein_codingTCGA-VS-A8EJ-01Cervixcervical & endocervical cancerFemale<65I/IIChemotherapycisplatinPD
DUOXA1SNVMissense_Mutationc.680C>Tp.Ala227Valp.A227VQ1HG43protein_codingtolerated(0.17)benign(0.03)TCGA-AA-3864-01Colorectumcolon adenocarcinomaMale>=65I/IIUnknownUnknownSD
DUOXA1SNVMissense_Mutationc.1379N>Ap.Arg460Hisp.R460HQ1HG43protein_codingdeleterious_low_confidence(0)benign(0.046)TCGA-AA-3947-01Colorectumcolon adenocarcinomaFemale<65I/IIUnknownUnknownSD
DUOXA1SNVMissense_Mutationc.1379N>Ap.Arg460Hisp.R460HQ1HG43protein_codingdeleterious_low_confidence(0)benign(0.046)TCGA-AD-6895-01Colorectumcolon adenocarcinomaMale>=65III/IVUnknownUnknownSD
DUOXA1SNVMissense_Mutationrs777729115c.169N>Ap.Val57Metp.V57MQ1HG43protein_codingdeleterious(0.01)probably_damaging(0.992)TCGA-AZ-6599-01Colorectumcolon adenocarcinomaMale>=65I/IIUnknownUnknownSD
DUOXA1SNVMissense_Mutationrs755140602c.1328G>Ap.Gly443Aspp.G443DQ1HG43protein_codingdeleterious_low_confidence(0)benign(0)TCGA-G4-6628-01Colorectumcolon adenocarcinomaMale>=65I/IIUnknownUnknownSD
Page: 1 2 3 4 5 

Top

Related drugs of malignant transformation related genes

check buttonIdentification of chemicals and drugs interact with genes involved in malignant transfromation
(DGIdb 4.0)
Entrez IDSymbolCategoryInteraction TypesDrug Claim NameDrug NamePMIDs
Page: 1