
|
|||||
|
 | |
| |
| |
| |
| |
| |
|
Gene: DUOX2 |
Gene summary for DUOX2 |
| Gene information | Species | Human | Gene symbol | DUOX2 | Gene ID | 50506 |
| Gene name | dual oxidase 2 | |
| Gene Alias | LNOX2 | |
| Cytomap | 15q21.1 | |
| Gene Type | protein-coding | GO ID | GO:0006575 | UniProtAcc | Q9NRD8 |
Top |
Malignant transformation analysis |
| Identification of the aberrant gene expression in precancerous and cancerous lesions by comparing the gene expression of stem-like cells in diseased tissues with normal stem cells |
| Entrez ID | Symbol | Replicates | Species | Organ | Tissue | Adj P-value | Log2FC | Malignancy |
| 50506 | DUOX2 | CCII_1 | Human | Cervix | CC | 3.08e-20 | 6.00e-01 | 0.3249 |
| 50506 | DUOX2 | Tumor | Human | Cervix | CC | 1.59e-22 | 5.63e-01 | 0.1241 |
| 50506 | DUOX2 | sample3 | Human | Cervix | CC | 3.26e-47 | 8.19e-01 | 0.1387 |
| 50506 | DUOX2 | H2 | Human | Cervix | HSIL_HPV | 4.82e-25 | 7.35e-01 | 0.0632 |
| 50506 | DUOX2 | T3 | Human | Cervix | CC | 1.65e-49 | 8.42e-01 | 0.1389 |
| 50506 | DUOX2 | HTA11_1938_2000001011 | Human | Colorectum | AD | 4.75e-16 | 5.71e-01 | -0.0811 |
| 50506 | DUOX2 | HTA11_411_2000001011 | Human | Colorectum | SER | 5.01e-10 | 2.52e+00 | -0.2602 |
| 50506 | DUOX2 | HTA11_1391_2000001011 | Human | Colorectum | AD | 5.64e-25 | 1.27e+00 | -0.059 |
| 50506 | DUOX2 | HTA11_866_3004761011 | Human | Colorectum | AD | 8.37e-11 | 6.16e-01 | 0.096 |
| 50506 | DUOX2 | HTA11_7696_3000711011 | Human | Colorectum | AD | 1.21e-04 | 2.98e-01 | 0.0674 |
| 50506 | DUOX2 | HTA11_6818_2000001011 | Human | Colorectum | AD | 3.01e-06 | 5.39e-01 | 0.0112 |
| 50506 | DUOX2 | HTA11_6818_2000001021 | Human | Colorectum | AD | 1.77e-20 | 9.12e-01 | 0.0588 |
| 50506 | DUOX2 | HTA11_99999973899_84307 | Human | Colorectum | MSS | 5.67e-07 | 5.32e-01 | 0.2585 |
| 50506 | DUOX2 | A002-C-010 | Human | Colorectum | FAP | 7.88e-04 | 3.46e-01 | 0.242 |
| 50506 | DUOX2 | A001-C-207 | Human | Colorectum | FAP | 1.17e-02 | 3.10e-01 | 0.1278 |
| 50506 | DUOX2 | A002-C-201 | Human | Colorectum | FAP | 3.68e-20 | 7.45e-01 | 0.0324 |
| 50506 | DUOX2 | A002-C-203 | Human | Colorectum | FAP | 9.53e-13 | 5.40e-01 | 0.2786 |
| 50506 | DUOX2 | A001-C-108 | Human | Colorectum | FAP | 4.25e-02 | 3.15e-01 | -0.0272 |
| 50506 | DUOX2 | A002-C-021 | Human | Colorectum | FAP | 5.09e-15 | 4.69e-01 | 0.1171 |
| 50506 | DUOX2 | A015-C-005 | Human | Colorectum | FAP | 5.56e-04 | 3.17e-01 | -0.0336 |
| Page: 1 2 3 4 |
| Tissue | Expression Dynamics | Abbreviation |
| Cervix |  | CC: Cervix cancer |
| HSIL_HPV: HPV-infected high-grade squamous intraepithelial lesions | ||
| N_HPV: HPV-infected normal cervix | ||
| Colorectum (GSE201348) |  | FAP: Familial adenomatous polyposis |
| CRC: Colorectal cancer | ||
| Colorectum (HTA11) |  | AD: Adenomas |
| SER: Sessile serrated lesions | ||
| MSI-H: Microsatellite-high colorectal cancer | ||
| MSS: Microsatellite stable colorectal cancer | ||
| Esophagus | 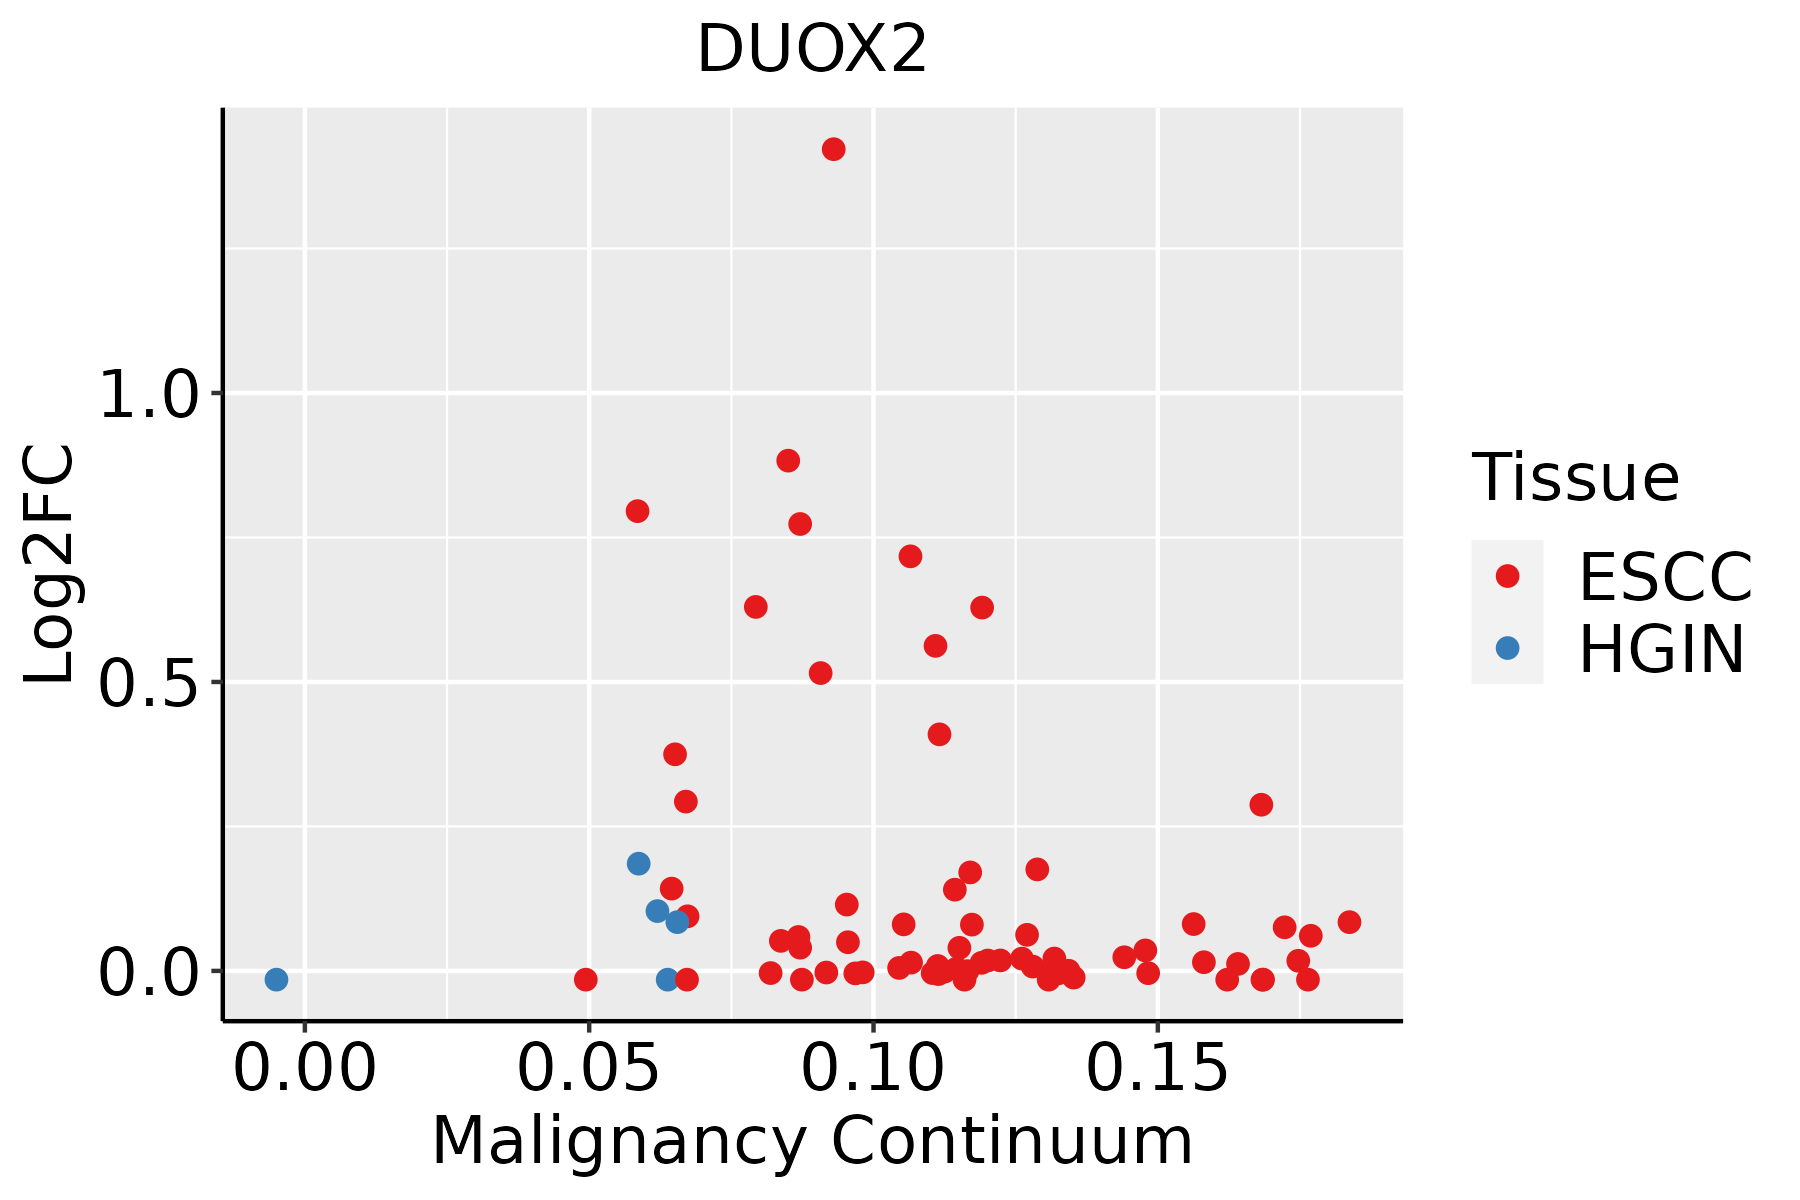 | ESCC: Esophageal squamous cell carcinoma |
| HGIN: High-grade intraepithelial neoplasias | ||
| LGIN: Low-grade intraepithelial neoplasias | ||
| GC | 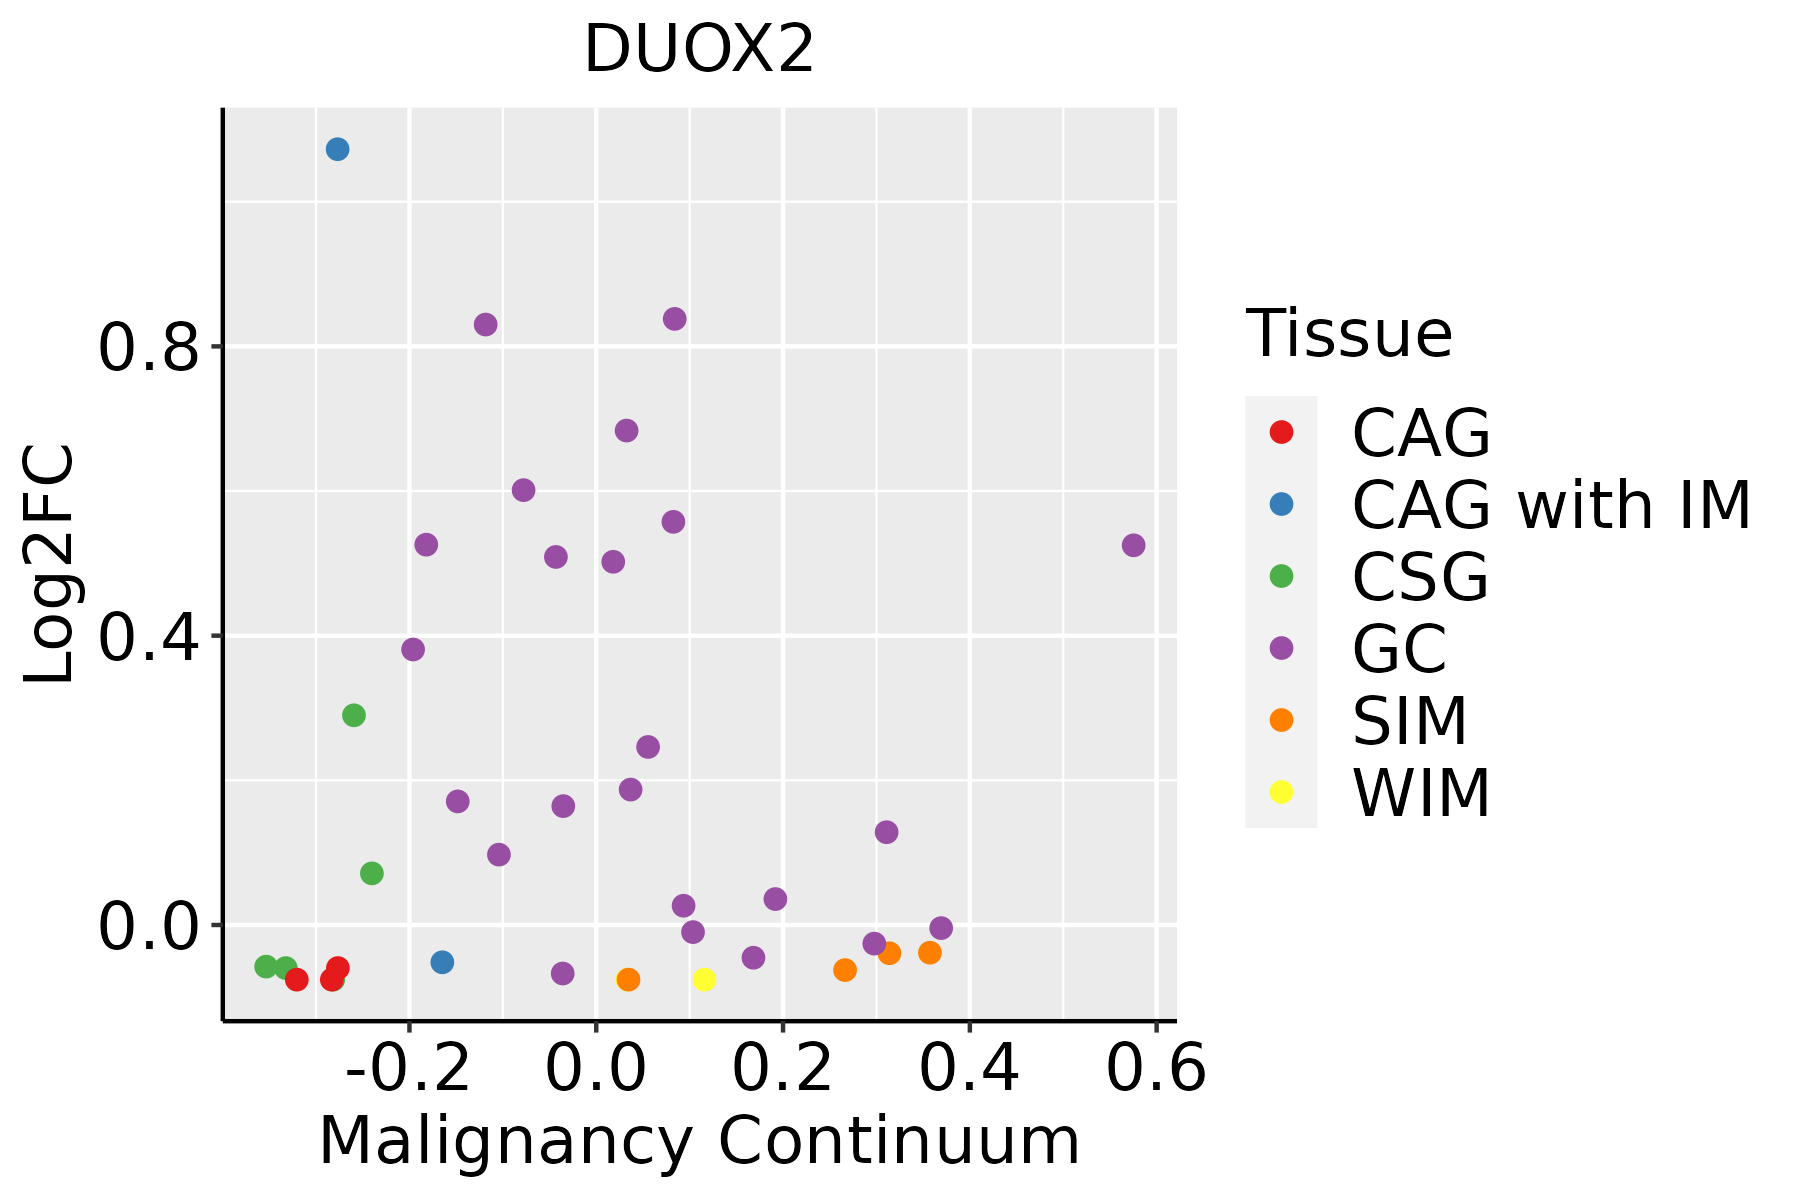 | CAG: Chronic atrophic gastritis |
| CAG with IM: Chronic atrophic gastritis with intestinal metaplasia | ||
| CSG: Chronic superficial gastritis | ||
| GC: Gastric cancer | ||
| SIM: Severe intestinal metaplasia | ||
| WIM: Wild intestinal metaplasia | ||
| Thyroid | 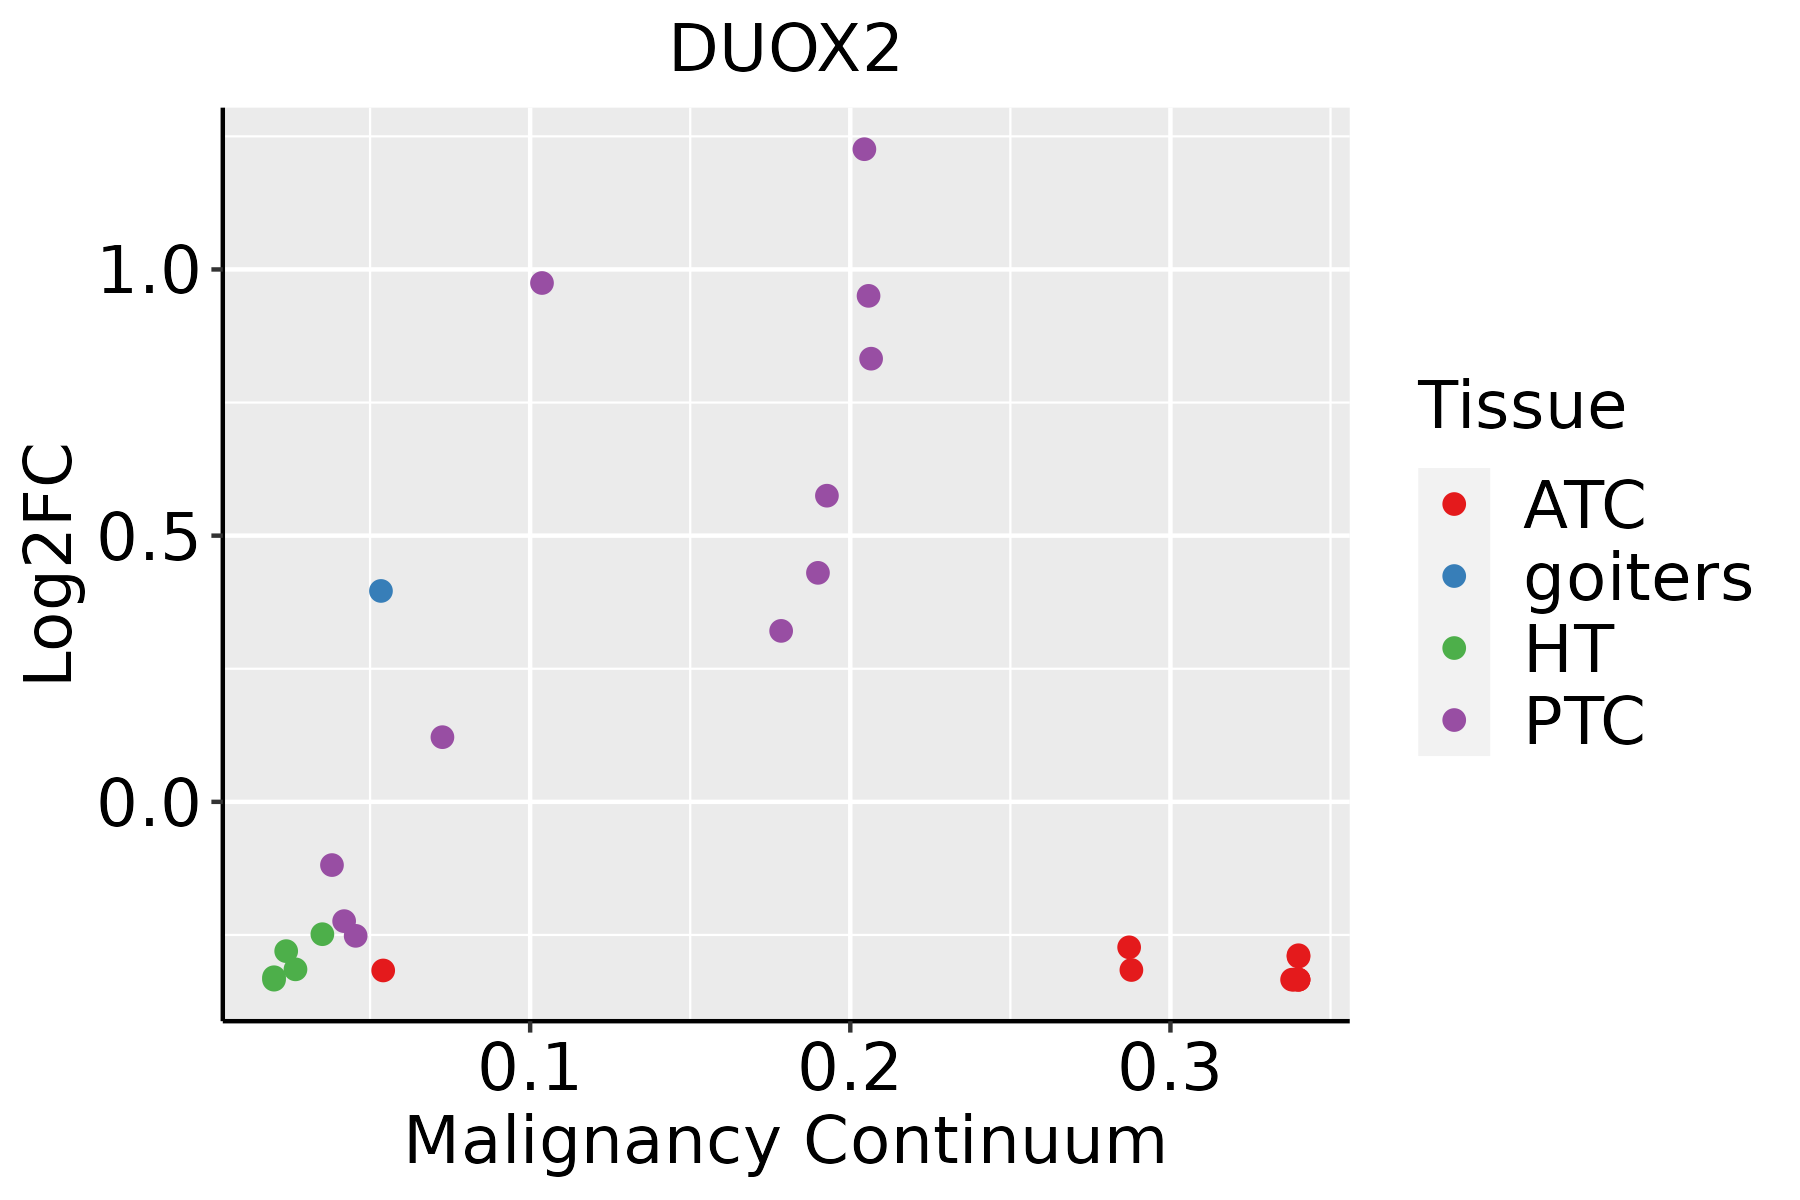 | ATC: Anaplastic thyroid cancer |
| HT: Hashimoto's thyroiditis | ||
| PTC: Papillary thyroid cancer |
| ∗log2FC in expression of this searched gene in stem-like cells from each diseased tissue sample relative to stem-like cells in normal samples in each tissue plotted against the malignancy continuum. Samples are colored based on if they are from different disease stage. |
Top |
Malignant transformation related pathway analysis |
| Find out the enriched GO biological processes and KEGG pathways involved in transition from healthy to precancer to cancer |
| Tissue | Disease Stage | Enriched GO biological Processes |
| Colorectum | AD |  |
| Colorectum | SER |  |
| Colorectum | MSS |  |
| Colorectum | MSI-H |  |
| Colorectum | FAP |  |
| ∗Top 15 enriched GO BP terms are showed in the bar plot of each disease state in each tissue. Each row represents a significant GO biological process which is colored according to the -log10(p.adjust). |
| Page: 1 2 3 4 5 6 7 8 9 |
| GO ID | Tissue | Disease Stage | Description | Gene Ratio | Bg Ratio | pvalue | p.adjust | Count |
| GO:004206010 | Cervix | CC | wound healing | 109/2311 | 422/18723 | 1.84e-14 | 1.57e-11 | 109 |
| GO:000697910 | Cervix | CC | response to oxidative stress | 102/2311 | 446/18723 | 2.99e-10 | 4.36e-08 | 102 |
| GO:19030349 | Cervix | CC | regulation of response to wounding | 44/2311 | 167/18723 | 6.33e-07 | 2.31e-05 | 44 |
| GO:00988699 | Cervix | CC | cellular oxidant detoxification | 30/2311 | 101/18723 | 2.72e-06 | 7.93e-05 | 30 |
| GO:00096158 | Cervix | CC | response to virus | 73/2311 | 367/18723 | 2.22e-05 | 3.95e-04 | 73 |
| GO:00610418 | Cervix | CC | regulation of wound healing | 34/2311 | 134/18723 | 2.70e-05 | 4.52e-04 | 34 |
| GO:19907489 | Cervix | CC | cellular detoxification | 30/2311 | 116/18723 | 5.34e-05 | 7.94e-04 | 30 |
| GO:00972379 | Cervix | CC | cellular response to toxic substance | 31/2311 | 124/18723 | 8.09e-05 | 1.10e-03 | 31 |
| GO:19030368 | Cervix | CC | positive regulation of response to wounding | 21/2311 | 72/18723 | 1.10e-04 | 1.39e-03 | 21 |
| GO:00903037 | Cervix | CC | positive regulation of wound healing | 18/2311 | 59/18723 | 1.78e-04 | 2.09e-03 | 18 |
| GO:00192213 | Cervix | CC | cytokine-mediated signaling pathway | 84/2311 | 472/18723 | 3.25e-04 | 3.44e-03 | 84 |
| GO:00096369 | Cervix | CC | response to toxic substance | 52/2311 | 262/18723 | 3.34e-04 | 3.52e-03 | 52 |
| GO:00725939 | Cervix | CC | reactive oxygen species metabolic process | 47/2311 | 239/18723 | 7.74e-04 | 6.87e-03 | 47 |
| GO:00987549 | Cervix | CC | detoxification | 33/2311 | 152/18723 | 7.97e-04 | 7.00e-03 | 33 |
| GO:005159110 | Cervix | CC | response to cAMP | 21/2311 | 93/18723 | 4.10e-03 | 2.54e-02 | 21 |
| GO:0006801 | Cervix | CC | superoxide metabolic process | 17/2311 | 74/18723 | 7.73e-03 | 4.10e-02 | 17 |
| GO:00427438 | Cervix | CC | hydrogen peroxide metabolic process | 14/2311 | 58/18723 | 9.57e-03 | 4.73e-02 | 14 |
| GO:19034095 | Cervix | CC | reactive oxygen species biosynthetic process | 15/2311 | 64/18723 | 9.89e-03 | 4.85e-02 | 15 |
| GO:000697915 | Cervix | HSIL_HPV | response to oxidative stress | 48/737 | 446/18723 | 2.76e-10 | 7.02e-08 | 48 |
| GO:004206015 | Cervix | HSIL_HPV | wound healing | 40/737 | 422/18723 | 2.80e-07 | 1.61e-05 | 40 |
| Page: 1 2 3 4 5 6 7 8 9 10 11 |
| Pathway ID | Tissue | Disease Stage | Description | Gene Ratio | Bg Ratio | pvalue | p.adjust | qvalue | Count |
| Page: 1 |
Top |
Cell-cell communication analysis |
| Identification of potential cell-cell interactions between two cell types and their ligand-receptor pairs for different disease states |
| Ligand | Receptor | LRpair | Pathway | Tissue | Disease Stage |
| Page: 1 |
Top |
Single-cell gene regulatory network inference analysis |
| Find out the significant the regulons (TFs) and the target genes of each regulon across cell types for different disease states |
| TF | Cell Type | Tissue | Disease Stage | Target Gene | RSS | Regulon Activity |
| ∗The dot plots of a searched regulon are shown for all cell subpopulations in each disease state of each tissue based on the regulon specific score inferred using pySCENIC and by calculating the average expression. |
| Page: 1 |
Top |
Somatic mutation of malignant transformation related genes |
| Annotation of somatic variants for genes involved in malignant transformation |
| Hugo Symbol | Variant Class | Variant Classification | dbSNP RS | HGVSc | HGVSp | HGVSp Short | SWISSPROT | BIOTYPE | SIFT | PolyPhen | Tumor Sample Barcode | Tissue | Histology | Sex | Age | Stage | Therapy Types | Drugs | Outcome |
| DUOX2 | SNV | Missense_Mutation | rs764655103 | c.1636G>A | p.Ala546Thr | p.A546T | Q9NRD8 | protein_coding | tolerated(0.1) | benign(0.052) | TCGA-A8-A09Z-01 | Breast | breast invasive carcinoma | Female | >=65 | I/II | Unknown | Unknown | SD |
| DUOX2 | SNV | Missense_Mutation | novel | c.1900C>T | p.Leu634Phe | p.L634F | Q9NRD8 | protein_coding | tolerated(0.07) | benign(0.003) | TCGA-AN-A046-01 | Breast | breast invasive carcinoma | Female | >=65 | I/II | Unknown | Unknown | SD |
| DUOX2 | SNV | Missense_Mutation | c.4105N>A | p.Glu1369Lys | p.E1369K | Q9NRD8 | protein_coding | deleterious(0) | possibly_damaging(0.861) | TCGA-D8-A1JA-01 | Breast | breast invasive carcinoma | Female | <65 | III/IV | Chemotherapy | adriamycin | PD | |
| DUOX2 | SNV | Missense_Mutation | c.1951N>A | p.Glu651Lys | p.E651K | Q9NRD8 | protein_coding | deleterious(0) | possibly_damaging(0.463) | TCGA-D8-A1JN-01 | Breast | breast invasive carcinoma | Female | >=65 | III/IV | Hormone Therapy | anastrozolum | SD | |
| DUOX2 | SNV | Missense_Mutation | c.4391N>G | p.Met1464Arg | p.M1464R | Q9NRD8 | protein_coding | deleterious(0) | probably_damaging(0.94) | TCGA-E9-A1NC-01 | Breast | breast invasive carcinoma | Female | <65 | I/II | Chemotherapy | doxorubicin | CR | |
| DUOX2 | SNV | Missense_Mutation | rs778481365 | c.2960C>A | p.Ala987Asp | p.A987D | Q9NRD8 | protein_coding | tolerated(0.67) | benign(0.039) | TCGA-GM-A2DH-01 | Breast | breast invasive carcinoma | Female | <65 | I/II | Chemotherapy | taxol | CR |
| DUOX2 | SNV | Missense_Mutation | rs758697659 | c.4613G>A | p.Arg1538Gln | p.R1538Q | Q9NRD8 | protein_coding | tolerated(1) | benign(0) | TCGA-PE-A5DE-01 | Breast | breast invasive carcinoma | Female | <65 | I/II | Chemotherapy | taxotere | CR |
| DUOX2 | SNV | Missense_Mutation | rs368488511 | c.3329G>A | p.Arg1110Gln | p.R1110Q | Q9NRD8 | protein_coding | deleterious(0.02) | possibly_damaging(0.906) | TCGA-PE-A5DE-01 | Breast | breast invasive carcinoma | Female | <65 | I/II | Chemotherapy | taxotere | CR |
| DUOX2 | insertion | Frame_Shift_Ins | novel | c.2897_2898insGGCTCTCTCCCTGCTGCTCCAGGCCAGAATC | p.Phe966LeufsTer166 | p.F966Lfs*166 | Q9NRD8 | protein_coding | TCGA-AN-A0FX-01 | Breast | breast invasive carcinoma | Female | <65 | I/II | Unknown | Unknown | SD | ||
| DUOX2 | insertion | Frame_Shift_Ins | novel | c.2895_2896insGATGC | p.Phe966AspfsTer32 | p.F966Dfs*32 | Q9NRD8 | protein_coding | TCGA-AN-A0FX-01 | Breast | breast invasive carcinoma | Female | <65 | I/II | Unknown | Unknown | SD |
| Page: 1 2 3 4 5 6 7 8 9 10 11 12 13 14 15 16 17 18 |
Top |
Related drugs of malignant transformation related genes |
| Identification of chemicals and drugs interact with genes involved in malignant transfromation |
| (DGIdb 4.0) |
| Entrez ID | Symbol | Category | Interaction Types | Drug Claim Name | Drug Name | PMIDs |
| 50506 | DUOX2 | TRANSPORTER, ENZYME, DRUGGABLE GENOME, CELL SURFACE | inhibitor | 363894227 |
| Page: 1 |

Copyright 2023-Present -The University of Texas Health Science Center at Houston |