
|
|||||
|
 | |
| |
| |
| |
| |
| |
|
Gene: DUOX1 |
Gene summary for DUOX1 |
| Gene information | Species | Human | Gene symbol | DUOX1 | Gene ID | 53905 |
| Gene name | dual oxidase 1 | |
| Gene Alias | LNOX1 | |
| Cytomap | 15q21.1 | |
| Gene Type | protein-coding | GO ID | GO:0006575 | UniProtAcc | Q9NRD9 |
Top |
Malignant transformation analysis |
| Identification of the aberrant gene expression in precancerous and cancerous lesions by comparing the gene expression of stem-like cells in diseased tissues with normal stem cells |
| Entrez ID | Symbol | Replicates | Species | Organ | Tissue | Adj P-value | Log2FC | Malignancy |
| 53905 | DUOX1 | RNA-P25T1-P25T1-1 | Human | Lung | AIS | 3.89e-15 | 7.11e-01 | -0.2116 |
| 53905 | DUOX1 | RNA-P25T1-P25T1-2 | Human | Lung | AIS | 5.74e-03 | 4.75e-01 | -0.1941 |
| 53905 | DUOX1 | RNA-P25T1-P25T1-3 | Human | Lung | AIS | 1.99e-05 | 5.79e-01 | -0.2107 |
| 53905 | DUOX1 | RNA-P25T1-P25T1-4 | Human | Lung | AIS | 1.80e-09 | 6.56e-01 | -0.2119 |
| 53905 | DUOX1 | C04 | Human | Oral cavity | OSCC | 5.46e-07 | 3.18e-01 | 0.2633 |
| 53905 | DUOX1 | C21 | Human | Oral cavity | OSCC | 1.41e-21 | 4.88e-01 | 0.2678 |
| 53905 | DUOX1 | C30 | Human | Oral cavity | OSCC | 1.16e-18 | 6.72e-01 | 0.3055 |
| 53905 | DUOX1 | C38 | Human | Oral cavity | OSCC | 2.68e-12 | 7.77e-01 | 0.172 |
| 53905 | DUOX1 | C43 | Human | Oral cavity | OSCC | 1.09e-08 | 2.54e-01 | 0.1704 |
| 53905 | DUOX1 | C46 | Human | Oral cavity | OSCC | 2.33e-21 | 4.63e-01 | 0.1673 |
| 53905 | DUOX1 | C51 | Human | Oral cavity | OSCC | 1.08e-17 | 6.35e-01 | 0.2674 |
| 53905 | DUOX1 | C57 | Human | Oral cavity | OSCC | 5.94e-08 | 3.32e-01 | 0.1679 |
| 53905 | DUOX1 | C06 | Human | Oral cavity | OSCC | 2.92e-05 | 5.20e-01 | 0.2699 |
| 53905 | DUOX1 | C08 | Human | Oral cavity | OSCC | 2.18e-03 | 1.72e-01 | 0.1919 |
| 53905 | DUOX1 | C09 | Human | Oral cavity | OSCC | 2.55e-15 | 4.27e-01 | 0.1431 |
| 53905 | DUOX1 | LN22 | Human | Oral cavity | OSCC | 2.05e-07 | 9.05e-01 | 0.1733 |
| 53905 | DUOX1 | LN46 | Human | Oral cavity | OSCC | 4.35e-13 | 4.24e-01 | 0.1666 |
| 53905 | DUOX1 | LP15 | Human | Oral cavity | LP | 1.56e-04 | 7.12e-01 | 0.2174 |
| 53905 | DUOX1 | SYSMH1 | Human | Oral cavity | OSCC | 6.68e-07 | 2.88e-01 | 0.1127 |
| 53905 | DUOX1 | SYSMH2 | Human | Oral cavity | OSCC | 1.98e-07 | 3.58e-01 | 0.2326 |
| Page: 1 2 |
| Tissue | Expression Dynamics | Abbreviation |
| Lung | 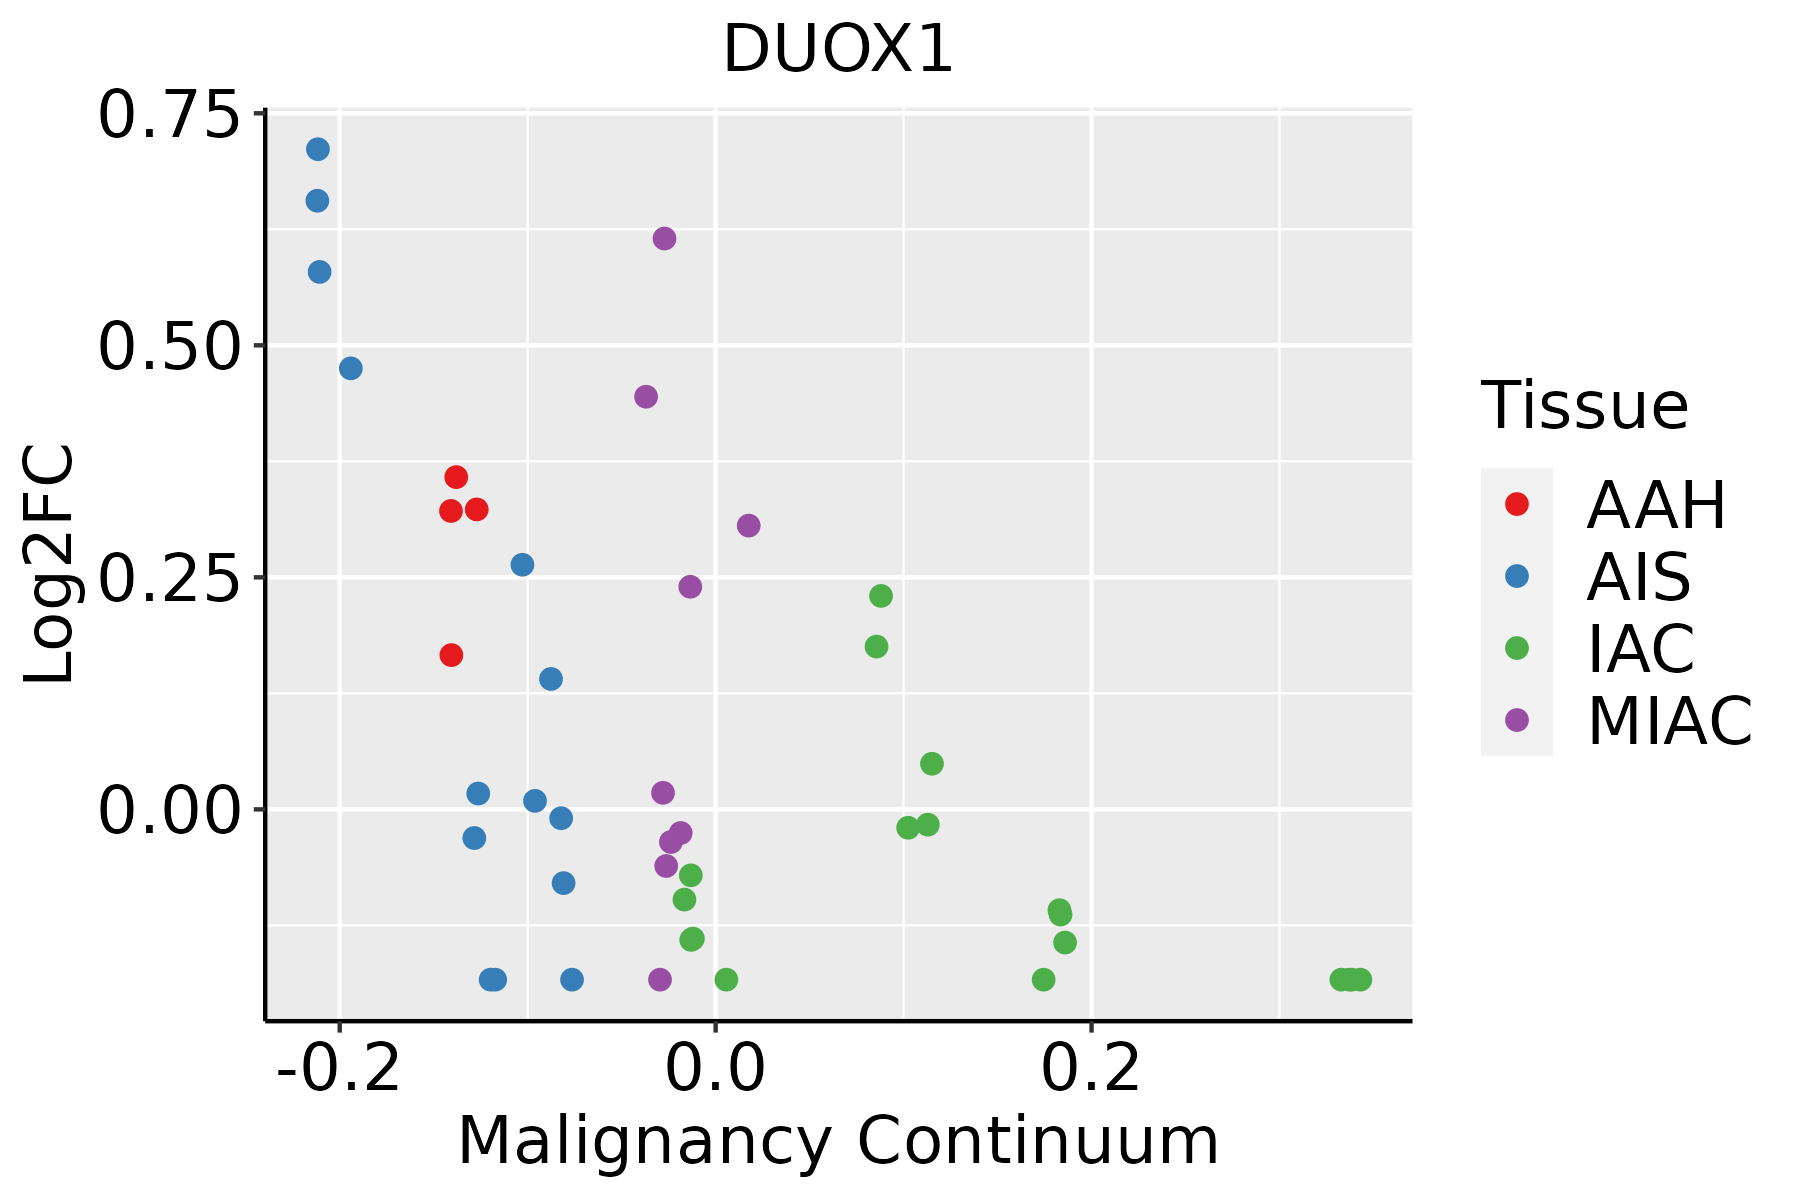 | AAH: Atypical adenomatous hyperplasia |
| AIS: Adenocarcinoma in situ | ||
| IAC: Invasive lung adenocarcinoma | ||
| MIA: Minimally invasive adenocarcinoma | ||
| Oral Cavity | 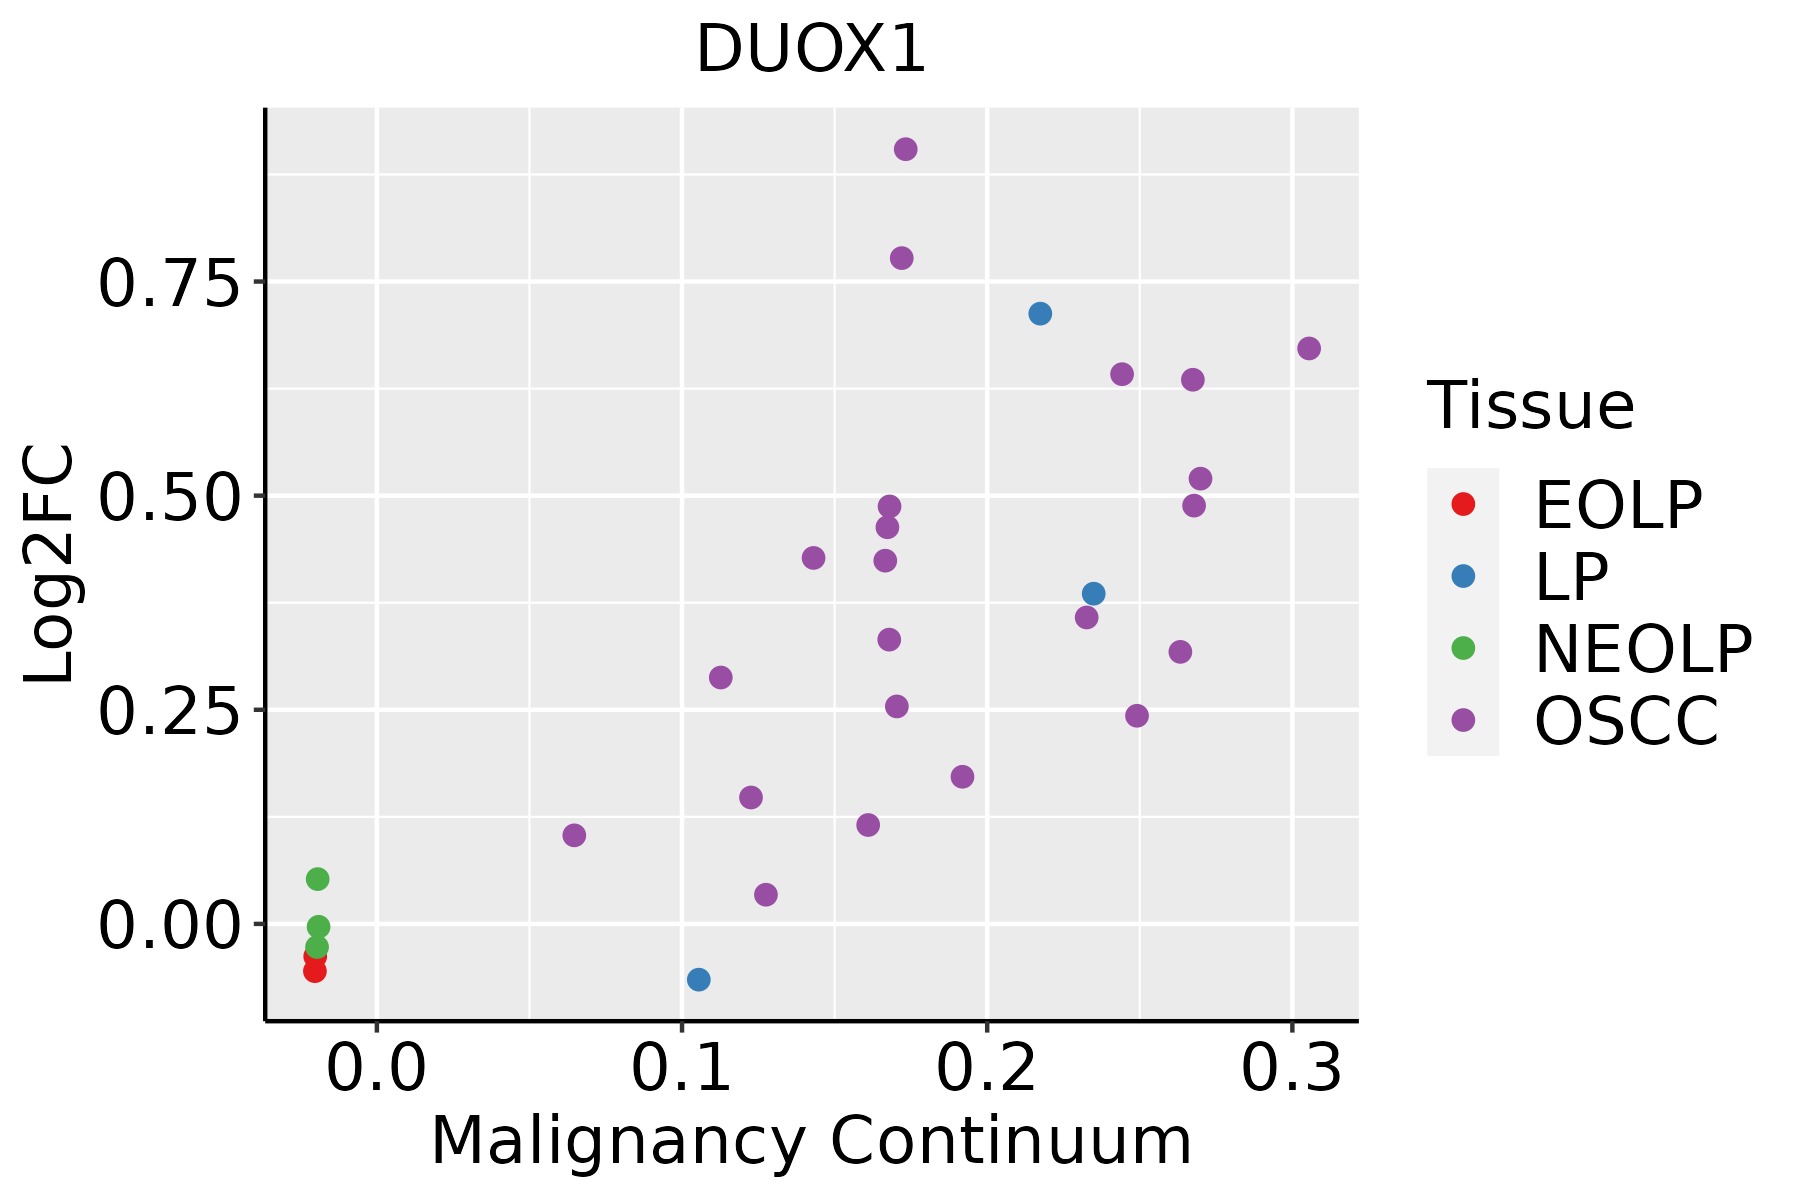 | EOLP: Erosive Oral lichen planus |
| LP: leukoplakia | ||
| NEOLP: Non-erosive oral lichen planus | ||
| OSCC: Oral squamous cell carcinoma | ||
| Skin | 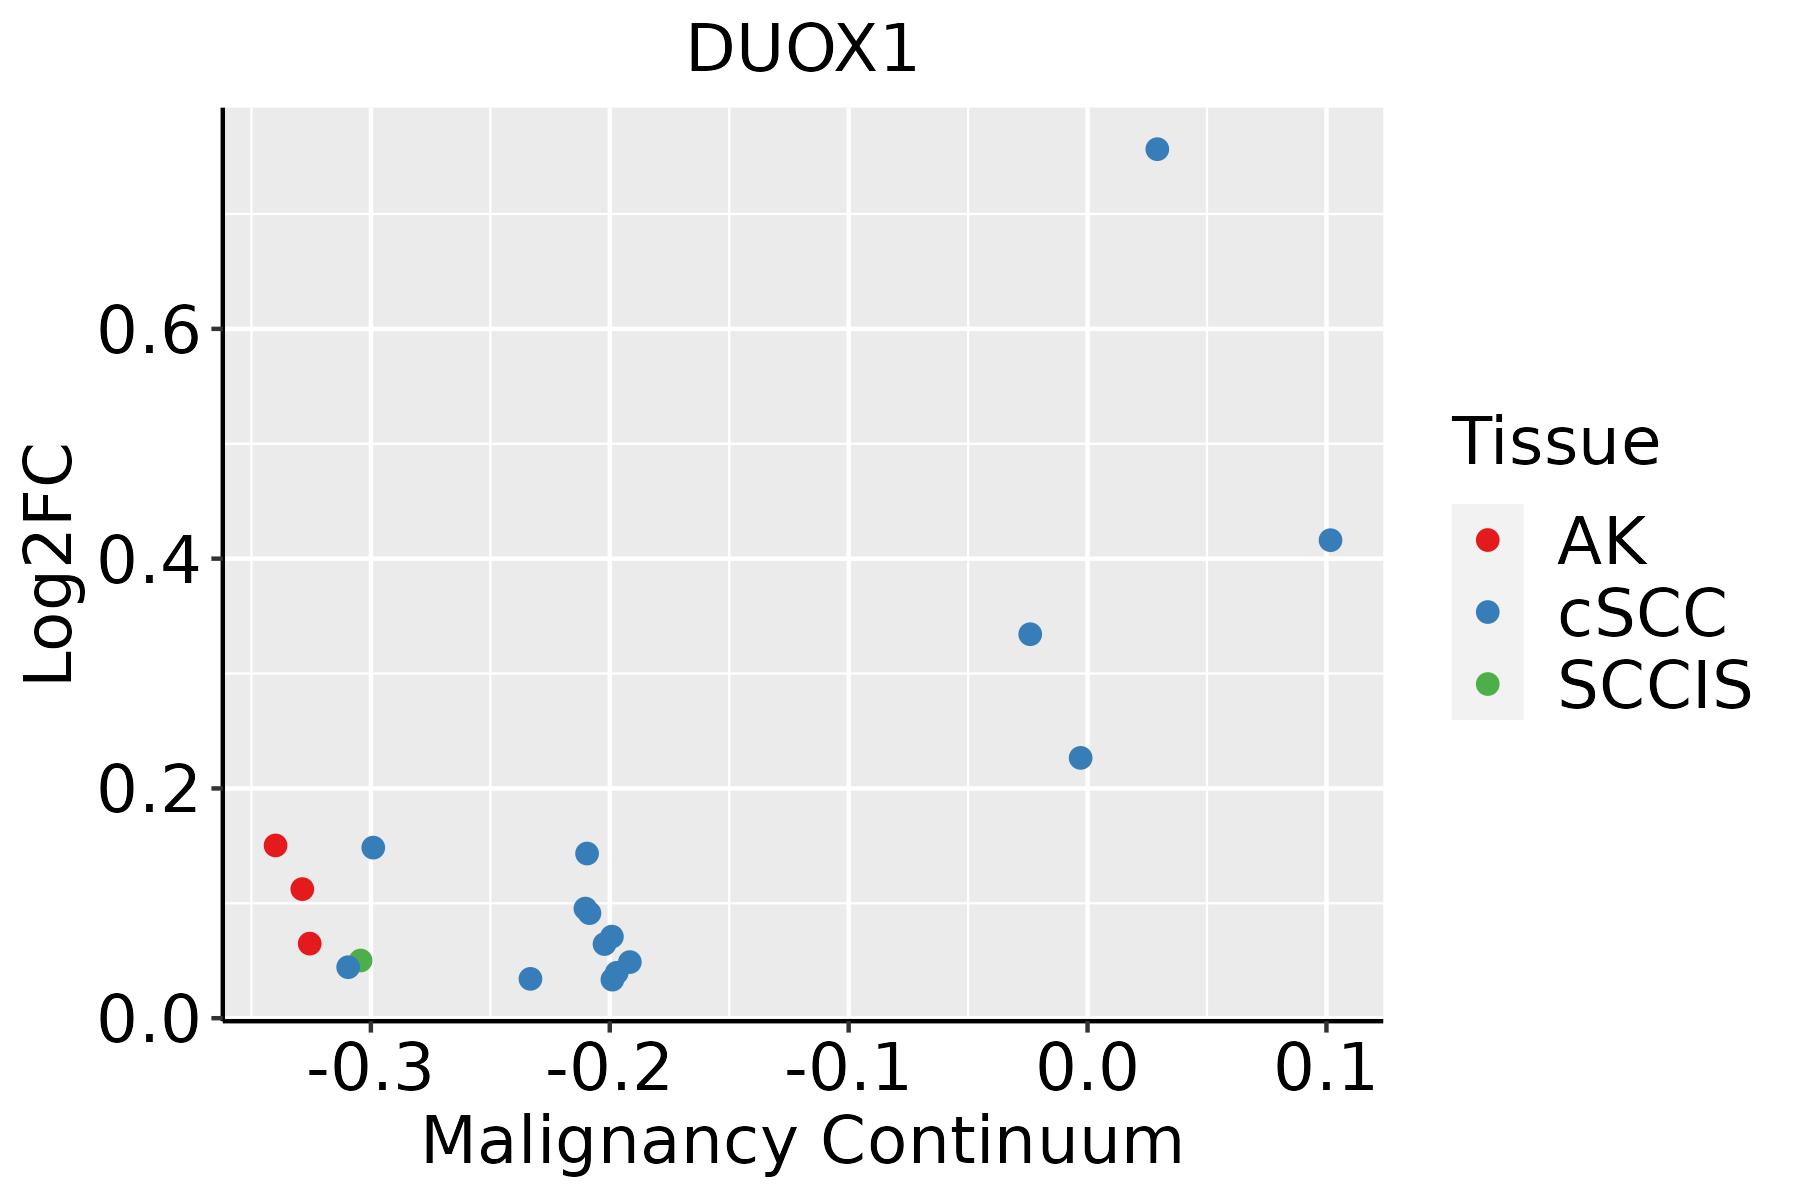 | AK: Actinic keratosis |
| cSCC: Cutaneous squamous cell carcinoma | ||
| SCCIS:squamous cell carcinoma in situ | ||
| Thyroid | 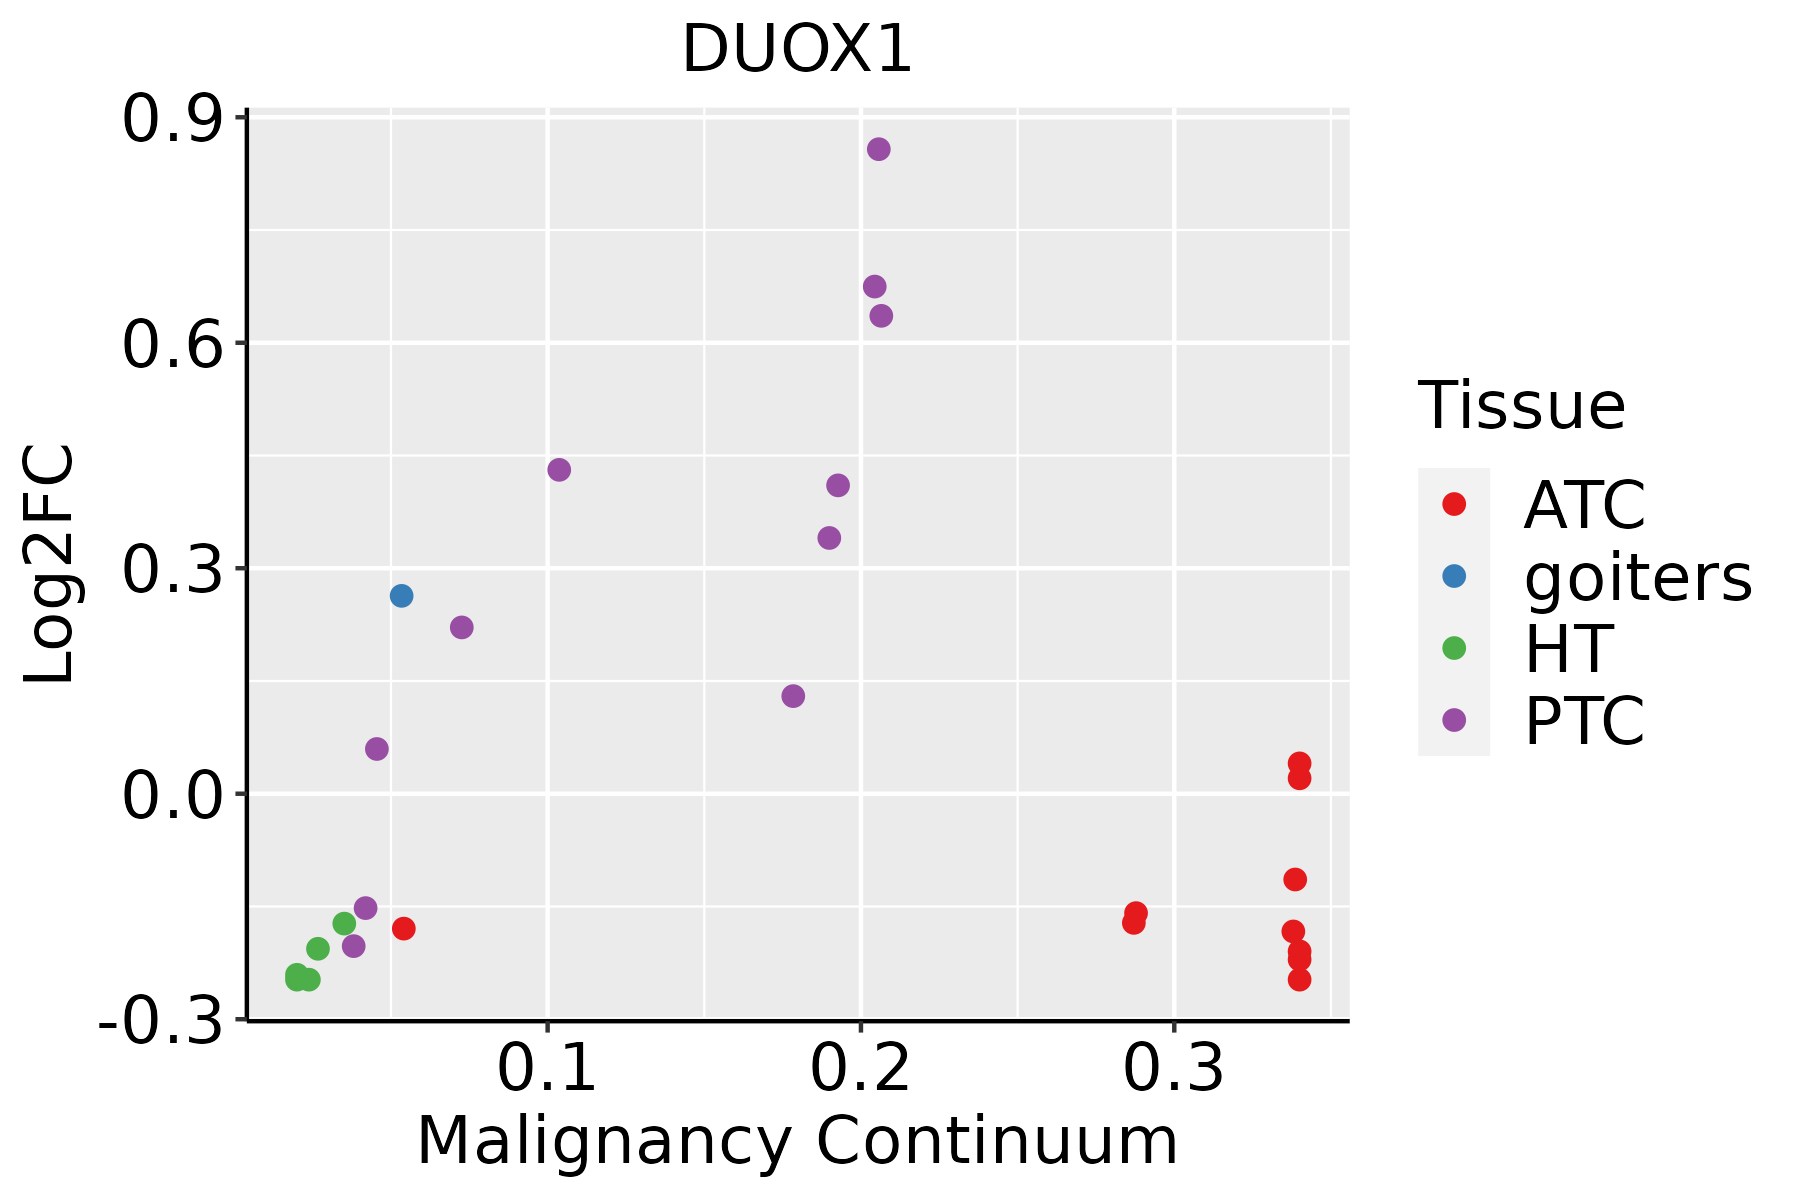 | ATC: Anaplastic thyroid cancer |
| HT: Hashimoto's thyroiditis | ||
| PTC: Papillary thyroid cancer |
| ∗log2FC in expression of this searched gene in stem-like cells from each diseased tissue sample relative to stem-like cells in normal samples in each tissue plotted against the malignancy continuum. Samples are colored based on if they are from different disease stage. |
Top |
Malignant transformation related pathway analysis |
| Find out the enriched GO biological processes and KEGG pathways involved in transition from healthy to precancer to cancer |
| Tissue | Disease Stage | Enriched GO biological Processes |
| Colorectum | AD |  |
| Colorectum | SER |  |
| Colorectum | MSS |  |
| Colorectum | MSI-H |  |
| Colorectum | FAP |  |
| ∗Top 15 enriched GO BP terms are showed in the bar plot of each disease state in each tissue. Each row represents a significant GO biological process which is colored according to the -log10(p.adjust). |
| Page: 1 2 3 4 5 6 7 8 9 |
| GO ID | Tissue | Disease Stage | Description | Gene Ratio | Bg Ratio | pvalue | p.adjust | Count |
| GO:000697913 | Lung | AIS | response to oxidative stress | 75/1849 | 446/18723 | 2.97e-06 | 1.60e-04 | 75 |
| GO:004206013 | Lung | AIS | wound healing | 71/1849 | 422/18723 | 5.32e-06 | 2.52e-04 | 71 |
| GO:005159113 | Lung | AIS | response to cAMP | 21/1849 | 93/18723 | 2.35e-04 | 4.68e-03 | 21 |
| GO:00466838 | Lung | AIS | response to organophosphorus | 24/1849 | 131/18723 | 2.14e-03 | 2.30e-02 | 24 |
| GO:00140748 | Lung | AIS | response to purine-containing compound | 25/1849 | 148/18723 | 5.34e-03 | 4.56e-02 | 25 |
| GO:000697920 | Oral cavity | OSCC | response to oxidative stress | 273/7305 | 446/18723 | 8.35e-22 | 1.65e-19 | 273 |
| GO:004206020 | Oral cavity | OSCC | wound healing | 237/7305 | 422/18723 | 4.51e-13 | 2.18e-11 | 237 |
| GO:000963618 | Oral cavity | OSCC | response to toxic substance | 137/7305 | 262/18723 | 7.94e-06 | 8.52e-05 | 137 |
| GO:007259316 | Oral cavity | OSCC | reactive oxygen species metabolic process | 122/7305 | 239/18723 | 9.73e-05 | 7.34e-04 | 122 |
| GO:00192214 | Oral cavity | OSCC | cytokine-mediated signaling pathway | 222/7305 | 472/18723 | 2.02e-04 | 1.35e-03 | 222 |
| GO:190303418 | Oral cavity | OSCC | regulation of response to wounding | 87/7305 | 167/18723 | 3.91e-04 | 2.38e-03 | 87 |
| GO:199074818 | Oral cavity | OSCC | cellular detoxification | 63/7305 | 116/18723 | 5.80e-04 | 3.31e-03 | 63 |
| GO:009886918 | Oral cavity | OSCC | cellular oxidant detoxification | 55/7305 | 101/18723 | 1.16e-03 | 5.89e-03 | 55 |
| GO:009723718 | Oral cavity | OSCC | cellular response to toxic substance | 65/7305 | 124/18723 | 1.63e-03 | 7.74e-03 | 65 |
| GO:006104116 | Oral cavity | OSCC | regulation of wound healing | 69/7305 | 134/18723 | 2.19e-03 | 9.95e-03 | 69 |
| GO:190303615 | Oral cavity | OSCC | positive regulation of response to wounding | 40/7305 | 72/18723 | 3.21e-03 | 1.38e-02 | 40 |
| GO:00065756 | Oral cavity | OSCC | cellular modified amino acid metabolic process | 91/7305 | 188/18723 | 5.33e-03 | 2.07e-02 | 91 |
| GO:009875418 | Oral cavity | OSCC | detoxification | 75/7305 | 152/18723 | 5.99e-03 | 2.28e-02 | 75 |
| GO:00903039 | Oral cavity | OSCC | positive regulation of wound healing | 33/7305 | 59/18723 | 6.17e-03 | 2.33e-02 | 33 |
| GO:0006979110 | Oral cavity | LP | response to oxidative stress | 181/4623 | 446/18723 | 5.74e-14 | 6.10e-12 | 181 |
| Page: 1 2 3 4 |
| Pathway ID | Tissue | Disease Stage | Description | Gene Ratio | Bg Ratio | pvalue | p.adjust | qvalue | Count |
| Page: 1 |
Top |
Cell-cell communication analysis |
| Identification of potential cell-cell interactions between two cell types and their ligand-receptor pairs for different disease states |
| Ligand | Receptor | LRpair | Pathway | Tissue | Disease Stage |
| Page: 1 |
Top |
Single-cell gene regulatory network inference analysis |
| Find out the significant the regulons (TFs) and the target genes of each regulon across cell types for different disease states |
| TF | Cell Type | Tissue | Disease Stage | Target Gene | RSS | Regulon Activity |
| ∗The dot plots of a searched regulon are shown for all cell subpopulations in each disease state of each tissue based on the regulon specific score inferred using pySCENIC and by calculating the average expression. |
| Page: 1 |
Top |
Somatic mutation of malignant transformation related genes |
| Annotation of somatic variants for genes involved in malignant transformation |
| Hugo Symbol | Variant Class | Variant Classification | dbSNP RS | HGVSc | HGVSp | HGVSp Short | SWISSPROT | BIOTYPE | SIFT | PolyPhen | Tumor Sample Barcode | Tissue | Histology | Sex | Age | Stage | Therapy Types | Drugs | Outcome |
| DUOX1 | SNV | Missense_Mutation | rs376478271 | c.3949N>A | p.Glu1317Lys | p.E1317K | Q9NRD9 | protein_coding | deleterious(0) | probably_damaging(0.986) | TCGA-5L-AAT1-01 | Breast | breast invasive carcinoma | Female | <65 | III/IV | Hormone Therapy | letrozol | SD |
| DUOX1 | SNV | Missense_Mutation | c.3636C>A | p.His1212Gln | p.H1212Q | Q9NRD9 | protein_coding | deleterious(0.01) | possibly_damaging(0.593) | TCGA-A2-A1FW-01 | Breast | breast invasive carcinoma | Female | <65 | III/IV | Chemotherapy | cytoxan | SD | |
| DUOX1 | SNV | Missense_Mutation | c.2201N>T | p.Lys734Met | p.K734M | Q9NRD9 | protein_coding | tolerated(0.06) | benign(0.062) | TCGA-A8-A08R-01 | Breast | breast invasive carcinoma | Female | <65 | I/II | Unknown | Unknown | SD | |
| DUOX1 | SNV | Missense_Mutation | c.3285C>G | p.Phe1095Leu | p.F1095L | Q9NRD9 | protein_coding | deleterious(0.02) | possibly_damaging(0.88) | TCGA-AC-A23H-01 | Breast | breast invasive carcinoma | Female | >=65 | I/II | Unknown | Unknown | PD | |
| DUOX1 | SNV | Missense_Mutation | novel | c.944A>C | p.Asp315Ala | p.D315A | Q9NRD9 | protein_coding | deleterious(0.01) | probably_damaging(0.997) | TCGA-AN-A0G0-01 | Breast | breast invasive carcinoma | Female | <65 | I/II | Unknown | Unknown | SD |
| DUOX1 | SNV | Missense_Mutation | c.2680N>A | p.Ala894Thr | p.A894T | Q9NRD9 | protein_coding | tolerated(0.57) | benign(0.001) | TCGA-BH-A18P-01 | Breast | breast invasive carcinoma | Female | <65 | I/II | Unknown | Unknown | PD | |
| DUOX1 | SNV | Missense_Mutation | c.3218N>T | p.Thr1073Met | p.T1073M | Q9NRD9 | protein_coding | tolerated(0.1) | benign(0.007) | TCGA-C8-A12M-01 | Breast | breast invasive carcinoma | Female | >=65 | I/II | Unknown | Unknown | SD | |
| DUOX1 | SNV | Missense_Mutation | c.3937N>G | p.Leu1313Val | p.L1313V | Q9NRD9 | protein_coding | deleterious(0.01) | possibly_damaging(0.812) | TCGA-E2-A1IN-01 | Breast | breast invasive carcinoma | Female | <65 | I/II | Hormone Therapy | arimidex | SD | |
| DUOX1 | SNV | Missense_Mutation | c.1591N>C | p.Glu531Gln | p.E531Q | Q9NRD9 | protein_coding | tolerated(0.1) | possibly_damaging(0.493) | TCGA-GM-A2DO-01 | Breast | breast invasive carcinoma | Female | <65 | I/II | Hormone Therapy | tamoxiphen | CR | |
| DUOX1 | SNV | Missense_Mutation | novel | c.3494G>T | p.Cys1165Phe | p.C1165F | Q9NRD9 | protein_coding | deleterious(0) | probably_damaging(0.998) | TCGA-OL-A6VQ-01 | Breast | breast invasive carcinoma | Female | <65 | I/II | Unknown | Unknown | SD |
| Page: 1 2 3 4 5 6 7 8 9 10 11 12 13 14 15 |
Top |
Related drugs of malignant transformation related genes |
| Identification of chemicals and drugs interact with genes involved in malignant transfromation |
| (DGIdb 4.0) |
| Entrez ID | Symbol | Category | Interaction Types | Drug Claim Name | Drug Name | PMIDs |
| Page: 1 |

Copyright 2023-Present -The University of Texas Health Science Center at Houston |