
|
|||||
|
 | |
| |
| |
| |
| |
| |
|
Gene: DTYMK |
Gene summary for DTYMK |
| Gene information | Species | Human | Gene symbol | DTYMK | Gene ID | 1841 |
| Gene name | deoxythymidylate kinase | |
| Gene Alias | CDC8 | |
| Cytomap | 2q37.3 | |
| Gene Type | protein-coding | GO ID | GO:0006139 | UniProtAcc | P23919 |
Top |
Malignant transformation analysis |
| Identification of the aberrant gene expression in precancerous and cancerous lesions by comparing the gene expression of stem-like cells in diseased tissues with normal stem cells |
| Entrez ID | Symbol | Replicates | Species | Organ | Tissue | Adj P-value | Log2FC | Malignancy |
| 1841 | DTYMK | LZE2T | Human | Esophagus | ESCC | 1.06e-02 | 3.76e-01 | 0.082 |
| 1841 | DTYMK | LZE4T | Human | Esophagus | ESCC | 1.53e-05 | 2.22e-01 | 0.0811 |
| 1841 | DTYMK | LZE7T | Human | Esophagus | ESCC | 7.41e-06 | 3.28e-01 | 0.0667 |
| 1841 | DTYMK | LZE8T | Human | Esophagus | ESCC | 3.65e-09 | 3.95e-01 | 0.067 |
| 1841 | DTYMK | LZE20T | Human | Esophagus | ESCC | 4.42e-03 | 1.69e-01 | 0.0662 |
| 1841 | DTYMK | LZE22T | Human | Esophagus | ESCC | 8.42e-03 | 5.69e-01 | 0.068 |
| 1841 | DTYMK | LZE24T | Human | Esophagus | ESCC | 6.38e-12 | 4.34e-01 | 0.0596 |
| 1841 | DTYMK | LZE21T | Human | Esophagus | ESCC | 7.19e-03 | 4.10e-01 | 0.0655 |
| 1841 | DTYMK | LZE6T | Human | Esophagus | ESCC | 3.94e-10 | 4.39e-01 | 0.0845 |
| 1841 | DTYMK | P1T-E | Human | Esophagus | ESCC | 3.09e-08 | 4.71e-01 | 0.0875 |
| 1841 | DTYMK | P2T-E | Human | Esophagus | ESCC | 3.38e-34 | 8.15e-01 | 0.1177 |
| 1841 | DTYMK | P4T-E | Human | Esophagus | ESCC | 1.32e-28 | 8.27e-01 | 0.1323 |
| 1841 | DTYMK | P5T-E | Human | Esophagus | ESCC | 6.72e-32 | 8.02e-01 | 0.1327 |
| 1841 | DTYMK | P8T-E | Human | Esophagus | ESCC | 1.04e-28 | 5.83e-01 | 0.0889 |
| 1841 | DTYMK | P9T-E | Human | Esophagus | ESCC | 6.89e-21 | 5.68e-01 | 0.1131 |
| 1841 | DTYMK | P10T-E | Human | Esophagus | ESCC | 5.22e-39 | 9.36e-01 | 0.116 |
| 1841 | DTYMK | P11T-E | Human | Esophagus | ESCC | 4.75e-14 | 5.35e-01 | 0.1426 |
| 1841 | DTYMK | P12T-E | Human | Esophagus | ESCC | 5.44e-25 | 5.43e-01 | 0.1122 |
| 1841 | DTYMK | P15T-E | Human | Esophagus | ESCC | 3.32e-33 | 9.25e-01 | 0.1149 |
| 1841 | DTYMK | P16T-E | Human | Esophagus | ESCC | 7.26e-24 | 6.20e-01 | 0.1153 |
| Page: 1 2 3 4 5 6 |
| Tissue | Expression Dynamics | Abbreviation |
| Esophagus | 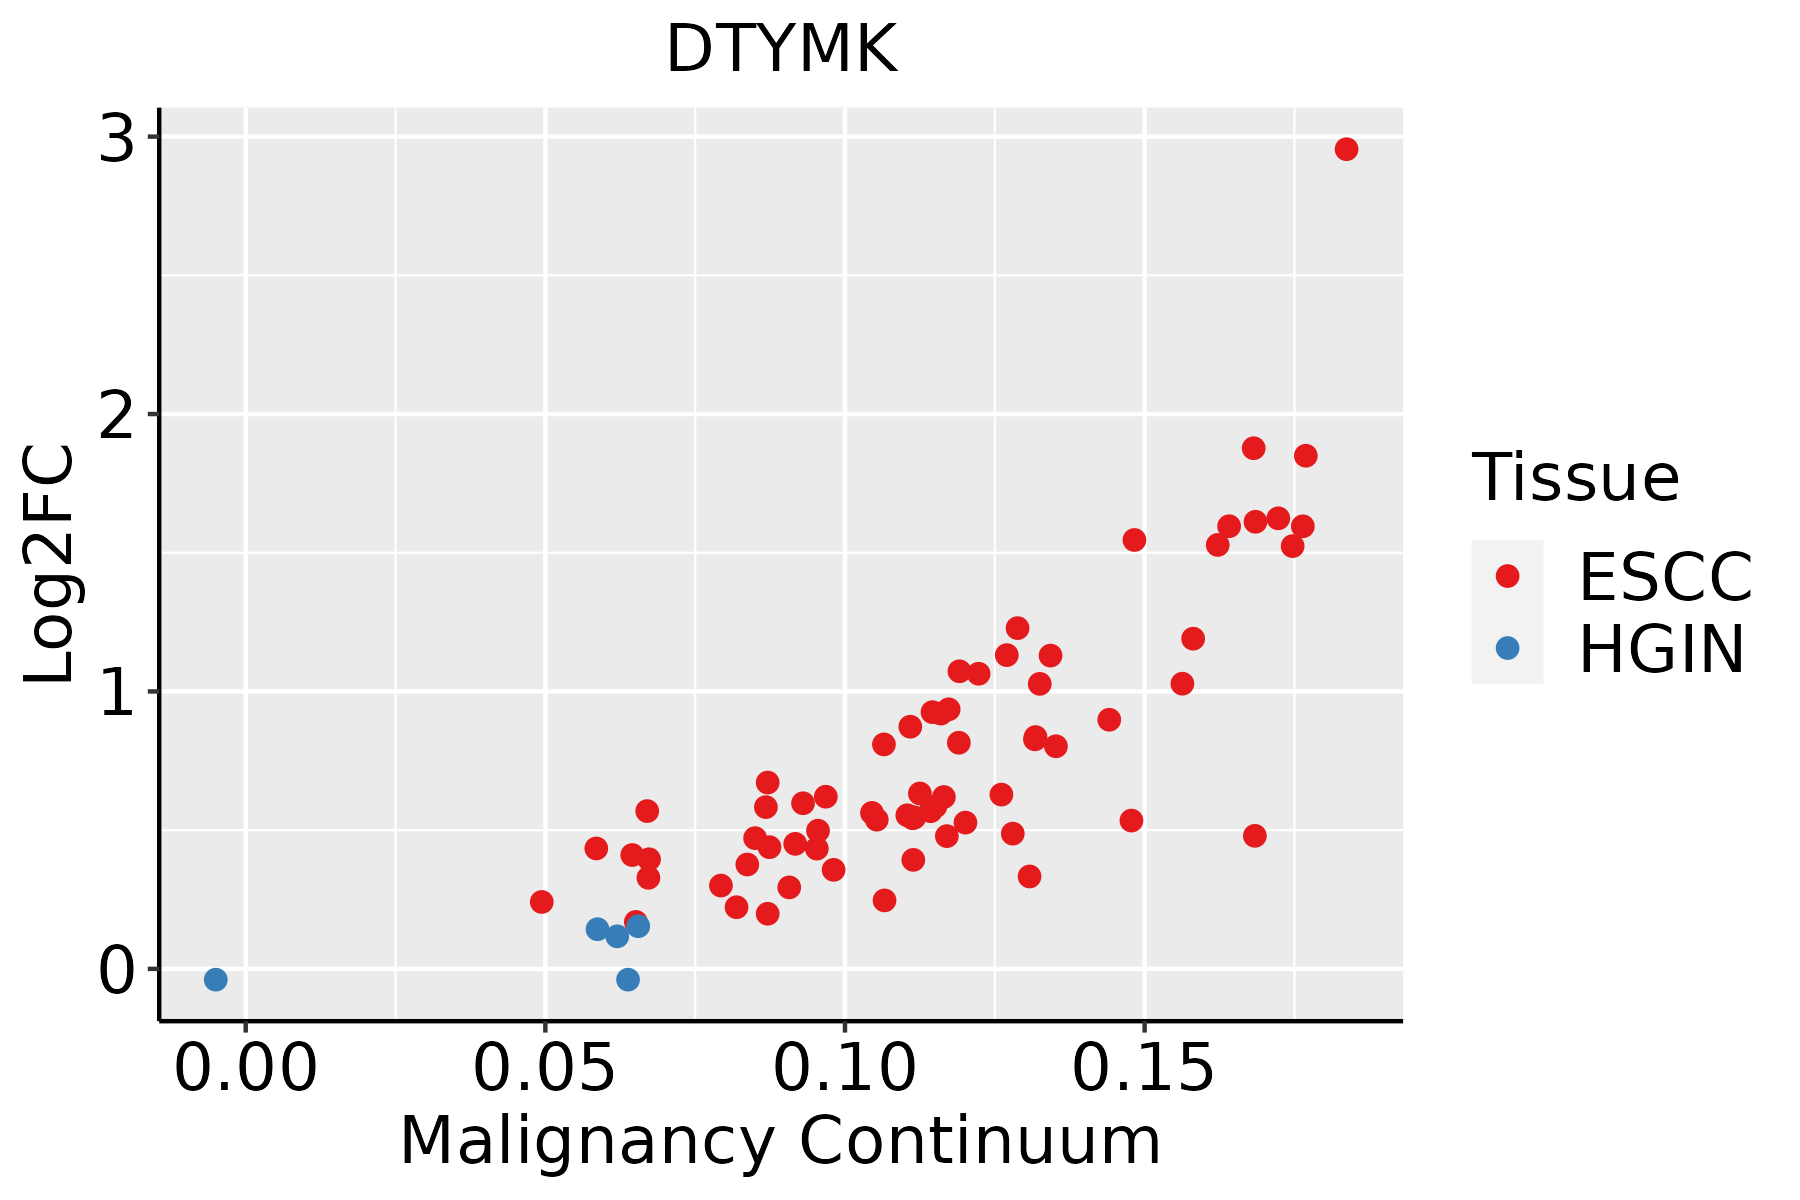 | ESCC: Esophageal squamous cell carcinoma |
| HGIN: High-grade intraepithelial neoplasias | ||
| LGIN: Low-grade intraepithelial neoplasias | ||
| Liver | 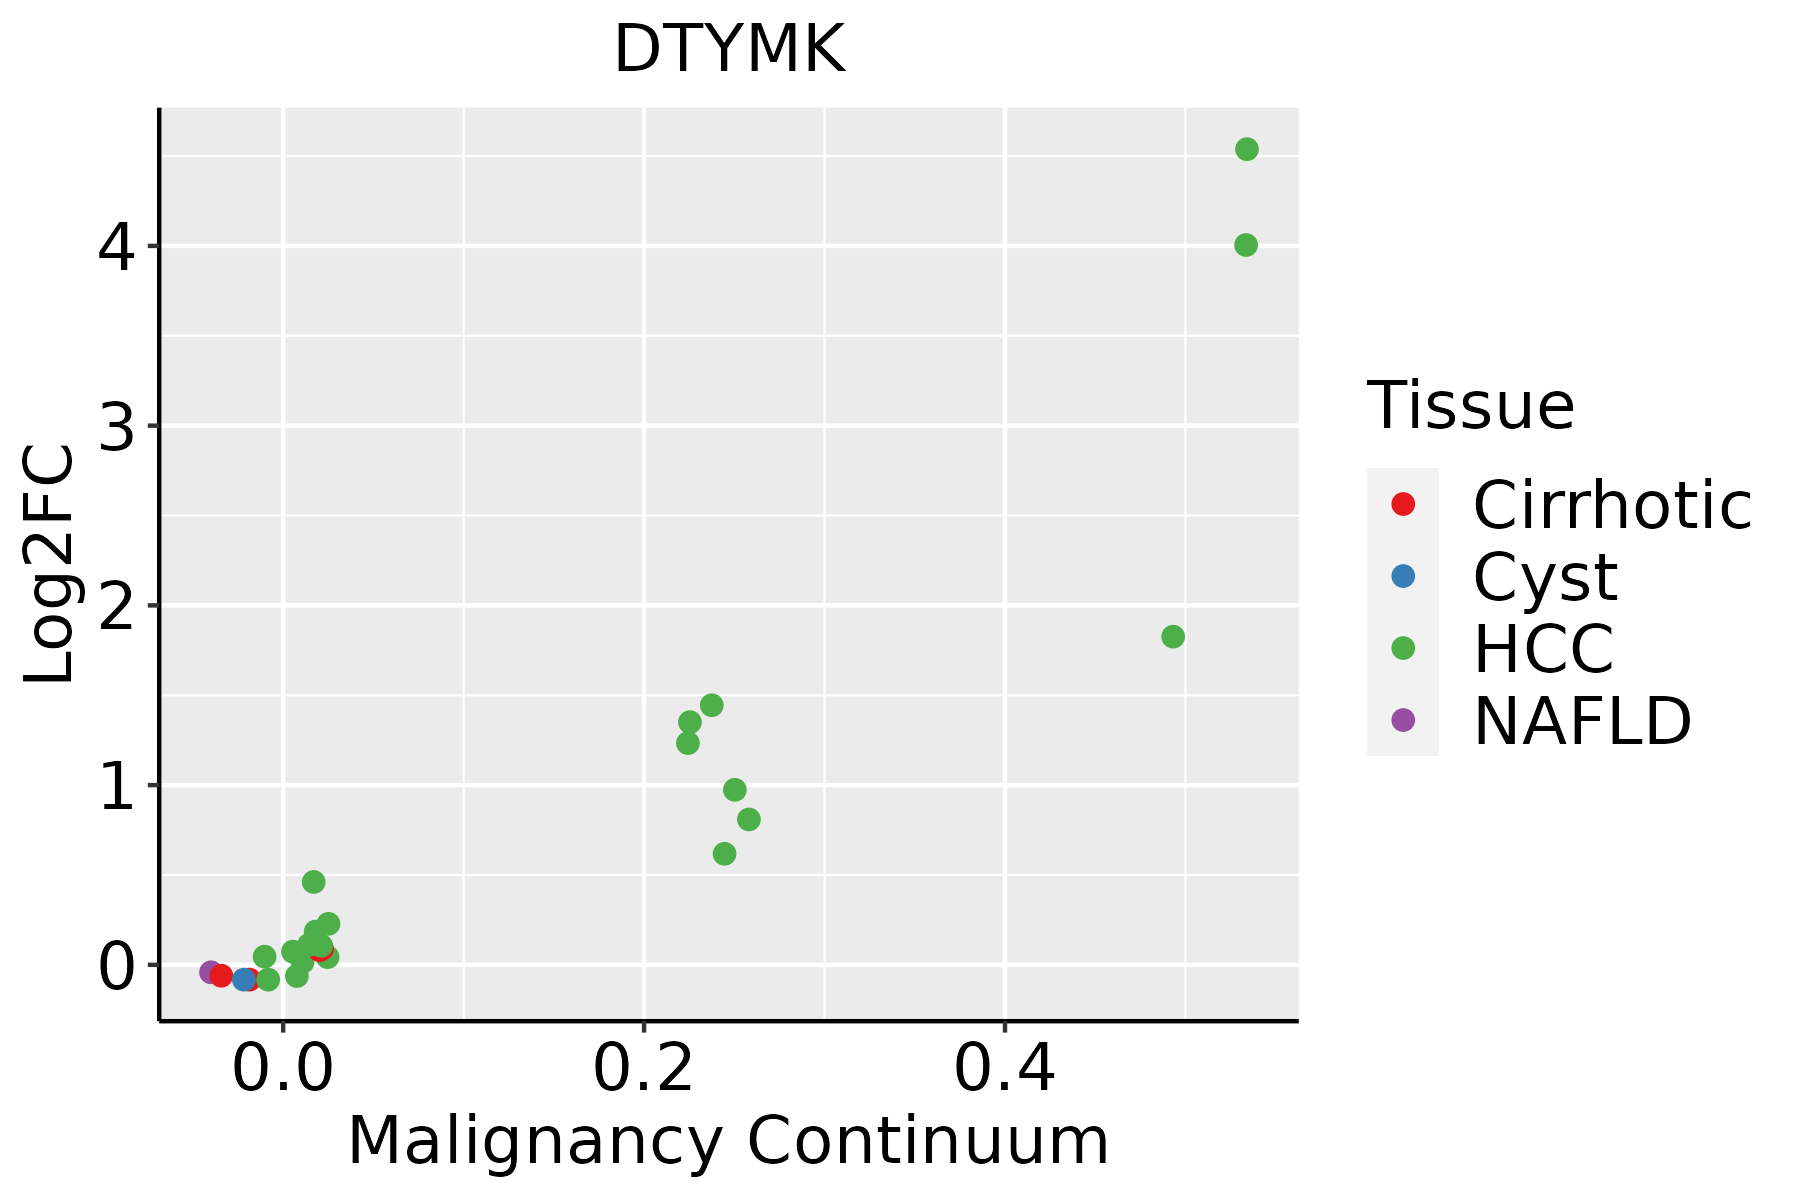 | HCC: Hepatocellular carcinoma |
| NAFLD: Non-alcoholic fatty liver disease | ||
| Oral Cavity | 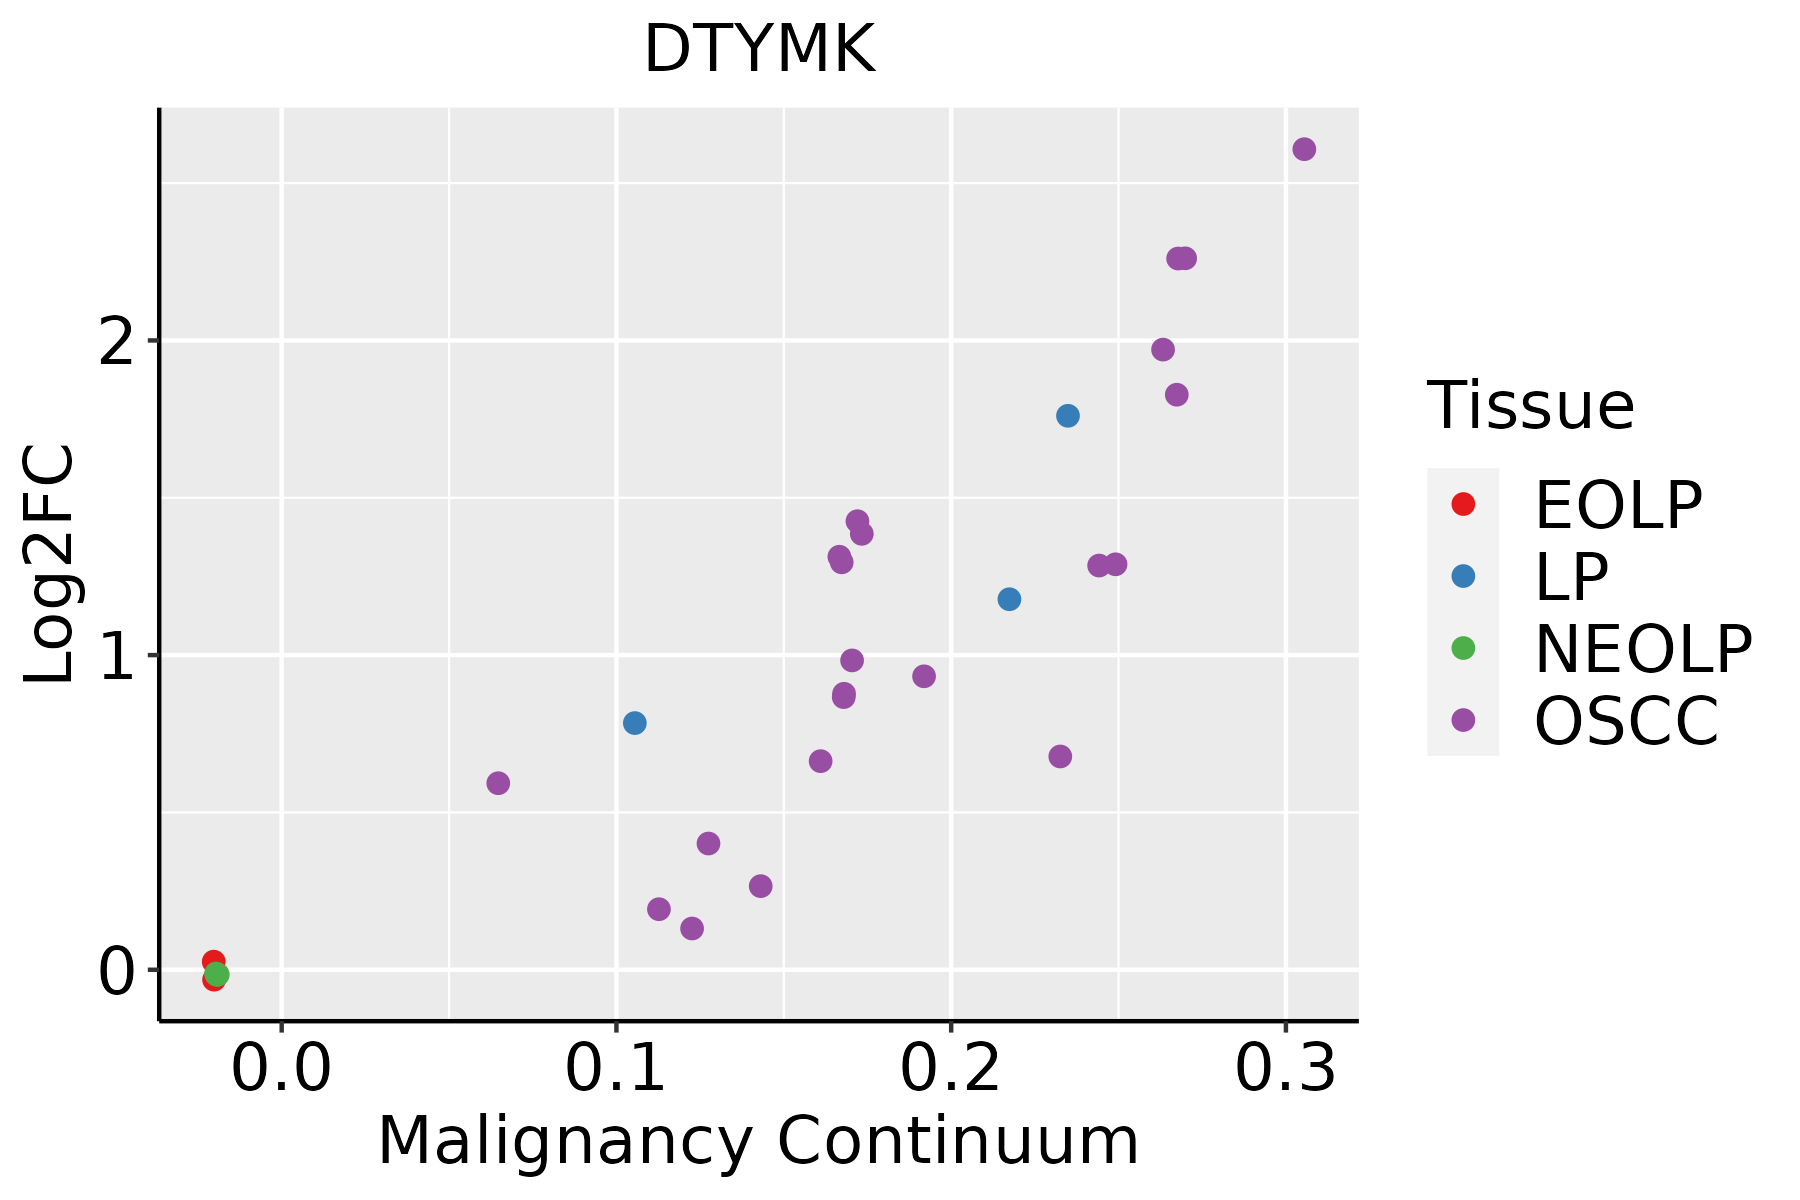 | EOLP: Erosive Oral lichen planus |
| LP: leukoplakia | ||
| NEOLP: Non-erosive oral lichen planus | ||
| OSCC: Oral squamous cell carcinoma | ||
| Skin | 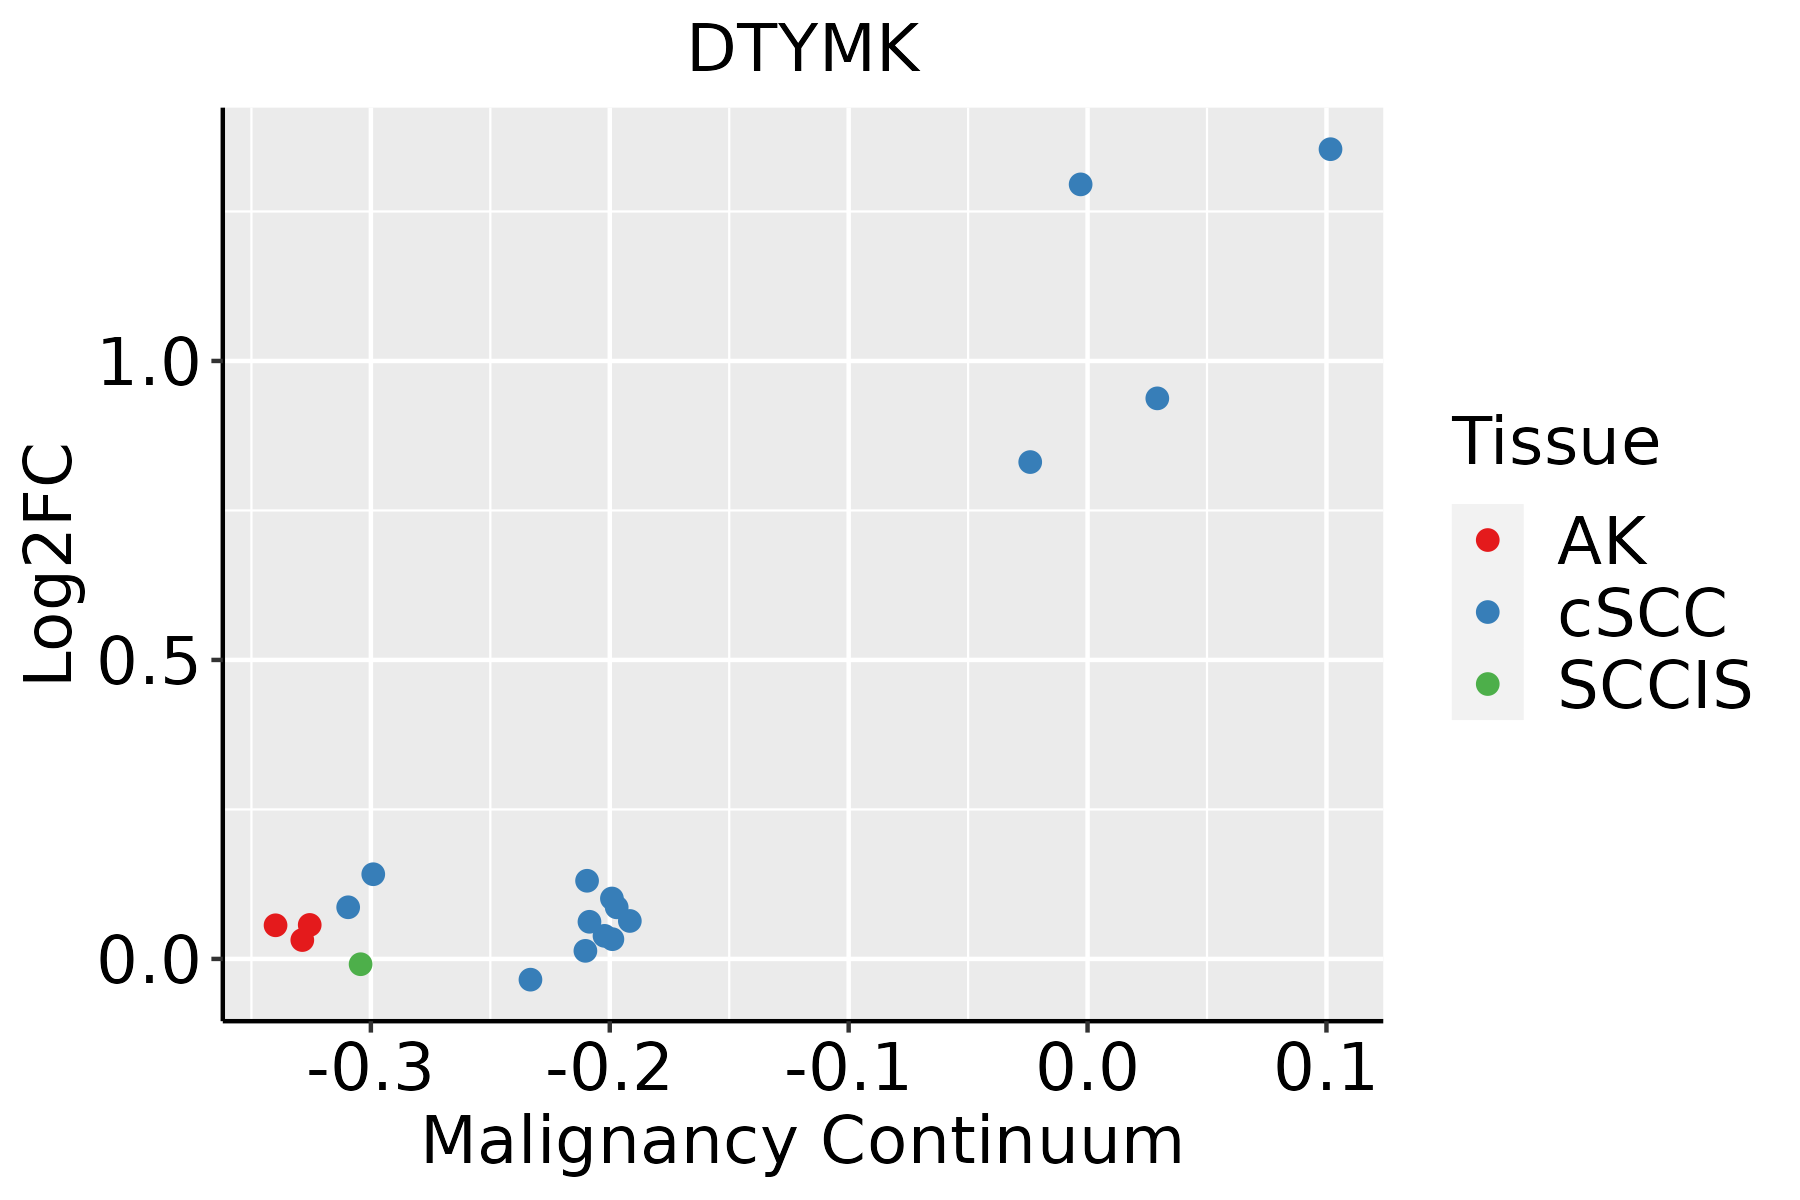 | AK: Actinic keratosis |
| cSCC: Cutaneous squamous cell carcinoma | ||
| SCCIS:squamous cell carcinoma in situ | ||
| Thyroid | 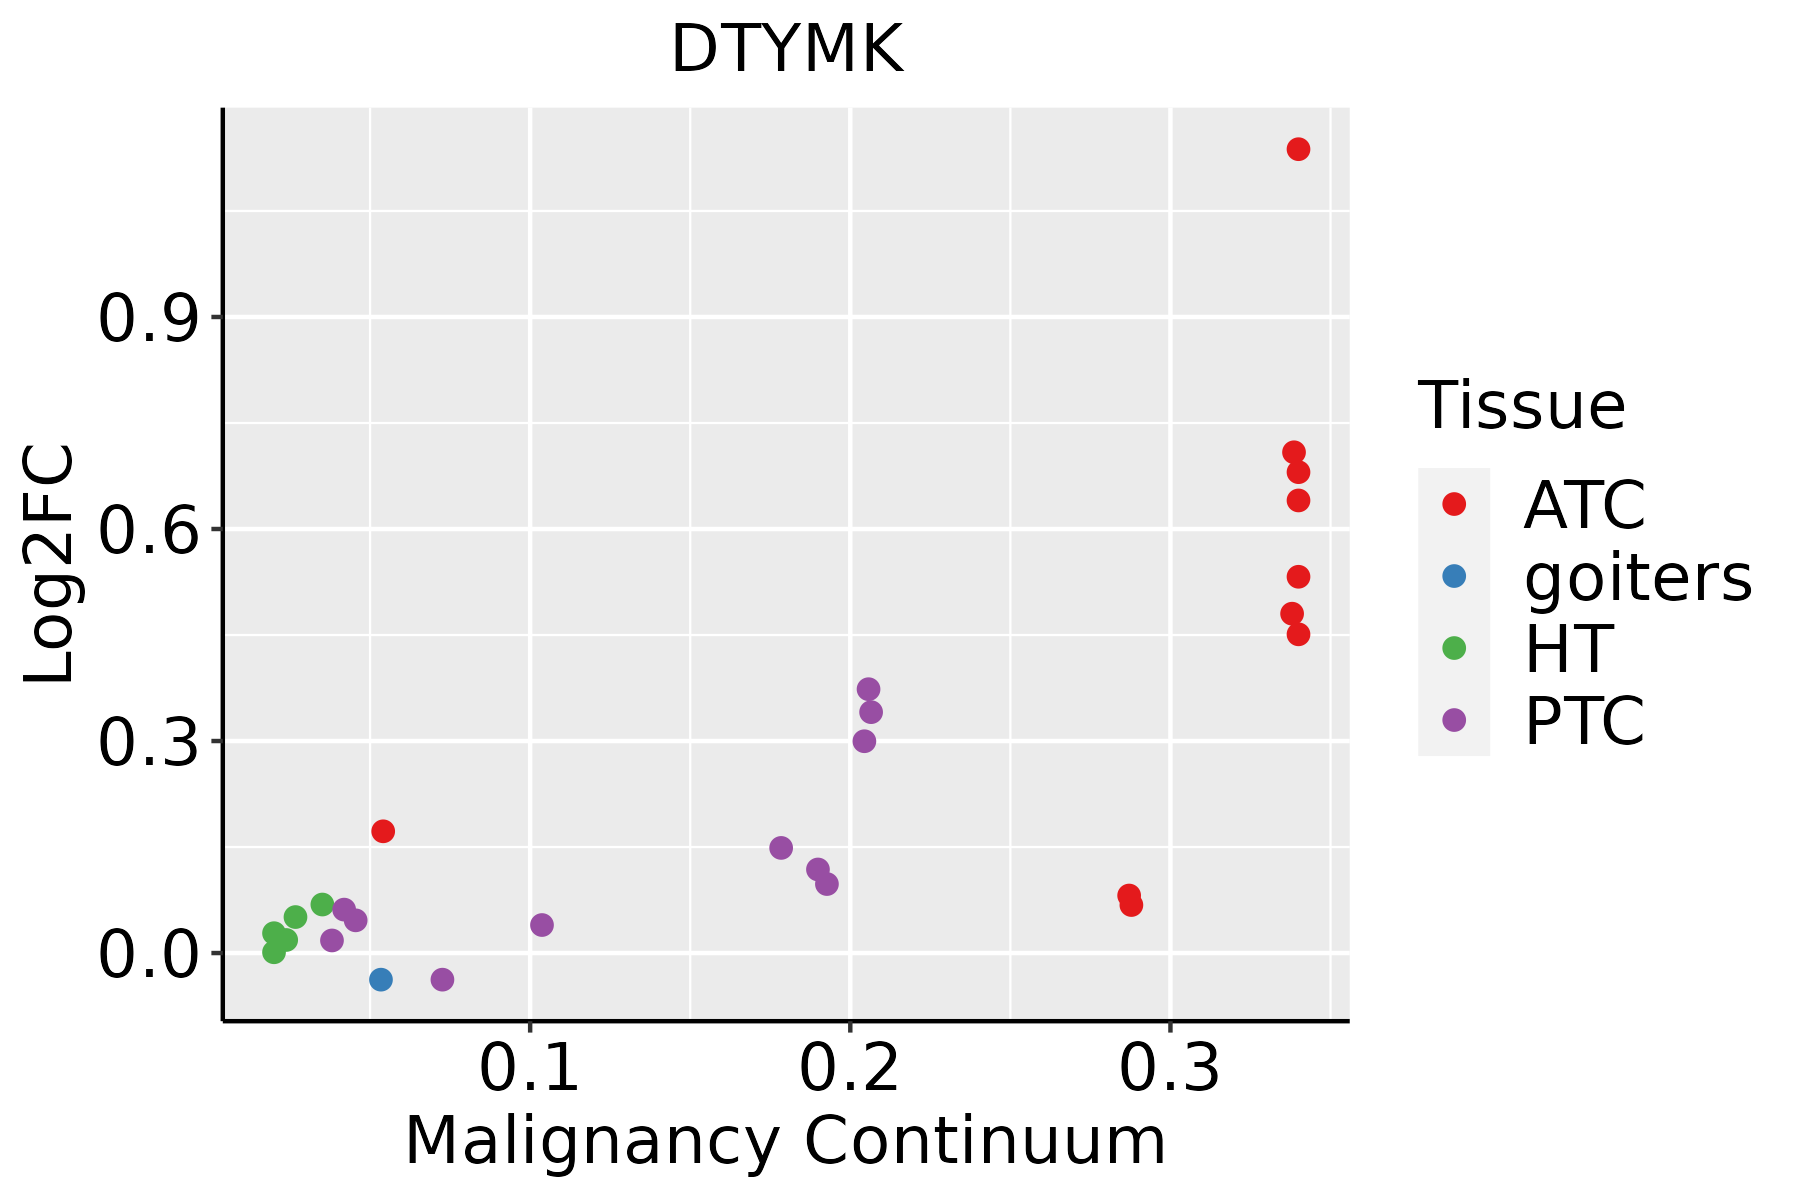 | ATC: Anaplastic thyroid cancer |
| HT: Hashimoto's thyroiditis | ||
| PTC: Papillary thyroid cancer |
| ∗log2FC in expression of this searched gene in stem-like cells from each diseased tissue sample relative to stem-like cells in normal samples in each tissue plotted against the malignancy continuum. Samples are colored based on if they are from different disease stage. |
Top |
Malignant transformation related pathway analysis |
| Find out the enriched GO biological processes and KEGG pathways involved in transition from healthy to precancer to cancer |
| Tissue | Disease Stage | Enriched GO biological Processes |
| Colorectum | AD |  |
| Colorectum | SER |  |
| Colorectum | MSS |  |
| Colorectum | MSI-H |  |
| Colorectum | FAP |  |
| ∗Top 15 enriched GO BP terms are showed in the bar plot of each disease state in each tissue. Each row represents a significant GO biological process which is colored according to the -log10(p.adjust). |
| Page: 1 2 3 4 5 6 7 8 9 |
| GO ID | Tissue | Disease Stage | Description | Gene Ratio | Bg Ratio | pvalue | p.adjust | Count |
| GO:0006753110 | Esophagus | ESCC | nucleoside phosphate metabolic process | 288/8552 | 497/18723 | 1.80e-08 | 3.50e-07 | 288 |
| GO:0009117111 | Esophagus | ESCC | nucleotide metabolic process | 282/8552 | 489/18723 | 4.70e-08 | 8.50e-07 | 282 |
| GO:0009141111 | Esophagus | ESCC | nucleoside triphosphate metabolic process | 78/8552 | 112/18723 | 2.36e-07 | 3.59e-06 | 78 |
| GO:000916516 | Esophagus | ESCC | nucleotide biosynthetic process | 150/8552 | 254/18723 | 1.12e-05 | 1.06e-04 | 150 |
| GO:190129316 | Esophagus | ESCC | nucleoside phosphate biosynthetic process | 151/8552 | 256/18723 | 1.15e-05 | 1.08e-04 | 151 |
| GO:000914219 | Esophagus | ESCC | nucleoside triphosphate biosynthetic process | 58/8552 | 85/18723 | 2.16e-05 | 1.87e-04 | 58 |
| GO:001003827 | Esophagus | ESCC | response to metal ion | 208/8552 | 373/18723 | 5.02e-05 | 3.90e-04 | 208 |
| GO:004668619 | Esophagus | ESCC | response to cadmium ion | 47/8552 | 68/18723 | 7.81e-05 | 5.80e-04 | 47 |
| GO:000913219 | Esophagus | ESCC | nucleoside diphosphate metabolic process | 77/8552 | 124/18723 | 1.65e-04 | 1.09e-03 | 77 |
| GO:19016574 | Esophagus | ESCC | glycosyl compound metabolic process | 57/8552 | 88/18723 | 2.32e-04 | 1.44e-03 | 57 |
| GO:000920012 | Esophagus | ESCC | deoxyribonucleoside triphosphate metabolic process | 15/8552 | 17/18723 | 3.48e-04 | 2.03e-03 | 15 |
| GO:00062203 | Esophagus | ESCC | pyrimidine nucleotide metabolic process | 35/8552 | 50/18723 | 4.33e-04 | 2.44e-03 | 35 |
| GO:00091473 | Esophagus | ESCC | pyrimidine nucleoside triphosphate metabolic process | 20/8552 | 25/18723 | 4.81e-04 | 2.69e-03 | 20 |
| GO:00091234 | Esophagus | ESCC | nucleoside monophosphate metabolic process | 49/8552 | 76/18723 | 7.30e-04 | 3.80e-03 | 49 |
| GO:000926212 | Esophagus | ESCC | deoxyribonucleotide metabolic process | 31/8552 | 44/18723 | 7.70e-04 | 3.99e-03 | 31 |
| GO:00725273 | Esophagus | ESCC | pyrimidine-containing compound metabolic process | 52/8552 | 82/18723 | 9.03e-04 | 4.61e-03 | 52 |
| GO:00092633 | Esophagus | ESCC | deoxyribonucleotide biosynthetic process | 13/8552 | 15/18723 | 1.31e-03 | 6.26e-03 | 13 |
| GO:001969212 | Esophagus | ESCC | deoxyribose phosphate metabolic process | 29/8552 | 42/18723 | 1.87e-03 | 8.46e-03 | 29 |
| GO:00454454 | Esophagus | ESCC | myoblast differentiation | 52/8552 | 84/18723 | 1.98e-03 | 8.90e-03 | 52 |
| GO:004693919 | Esophagus | ESCC | nucleotide phosphorylation | 61/8552 | 101/18723 | 2.03e-03 | 9.08e-03 | 61 |
| Page: 1 2 3 4 5 6 7 8 9 10 |
| Pathway ID | Tissue | Disease Stage | Description | Gene Ratio | Bg Ratio | pvalue | p.adjust | qvalue | Count |
| hsa012325 | Esophagus | ESCC | Nucleotide metabolism | 59/4205 | 85/8465 | 1.67e-04 | 6.58e-04 | 3.37e-04 | 59 |
| hsa002405 | Esophagus | ESCC | Pyrimidine metabolism | 41/4205 | 58/8465 | 9.14e-04 | 2.92e-03 | 1.49e-03 | 41 |
| hsa0123212 | Esophagus | ESCC | Nucleotide metabolism | 59/4205 | 85/8465 | 1.67e-04 | 6.58e-04 | 3.37e-04 | 59 |
| hsa0024012 | Esophagus | ESCC | Pyrimidine metabolism | 41/4205 | 58/8465 | 9.14e-04 | 2.92e-03 | 1.49e-03 | 41 |
| hsa01232 | Liver | Cirrhotic | Nucleotide metabolism | 39/2530 | 85/8465 | 1.27e-03 | 6.73e-03 | 4.15e-03 | 39 |
| hsa00240 | Liver | Cirrhotic | Pyrimidine metabolism | 27/2530 | 58/8465 | 5.31e-03 | 1.88e-02 | 1.16e-02 | 27 |
| hsa012321 | Liver | Cirrhotic | Nucleotide metabolism | 39/2530 | 85/8465 | 1.27e-03 | 6.73e-03 | 4.15e-03 | 39 |
| hsa002401 | Liver | Cirrhotic | Pyrimidine metabolism | 27/2530 | 58/8465 | 5.31e-03 | 1.88e-02 | 1.16e-02 | 27 |
| hsa002402 | Liver | HCC | Pyrimidine metabolism | 44/4020 | 58/8465 | 9.34e-06 | 7.11e-05 | 3.95e-05 | 44 |
| hsa012322 | Liver | HCC | Nucleotide metabolism | 59/4020 | 85/8465 | 3.30e-05 | 1.88e-04 | 1.04e-04 | 59 |
| hsa002403 | Liver | HCC | Pyrimidine metabolism | 44/4020 | 58/8465 | 9.34e-06 | 7.11e-05 | 3.95e-05 | 44 |
| hsa012323 | Liver | HCC | Nucleotide metabolism | 59/4020 | 85/8465 | 3.30e-05 | 1.88e-04 | 1.04e-04 | 59 |
| hsa012324 | Oral cavity | OSCC | Nucleotide metabolism | 54/3704 | 85/8465 | 1.78e-04 | 5.95e-04 | 3.03e-04 | 54 |
| hsa002404 | Oral cavity | OSCC | Pyrimidine metabolism | 37/3704 | 58/8465 | 1.62e-03 | 4.45e-03 | 2.26e-03 | 37 |
| hsa0123211 | Oral cavity | OSCC | Nucleotide metabolism | 54/3704 | 85/8465 | 1.78e-04 | 5.95e-04 | 3.03e-04 | 54 |
| hsa0024011 | Oral cavity | OSCC | Pyrimidine metabolism | 37/3704 | 58/8465 | 1.62e-03 | 4.45e-03 | 2.26e-03 | 37 |
| hsa0123221 | Oral cavity | LP | Nucleotide metabolism | 42/2418 | 85/8465 | 3.62e-05 | 2.36e-04 | 1.52e-04 | 42 |
| hsa0024021 | Oral cavity | LP | Pyrimidine metabolism | 28/2418 | 58/8465 | 1.12e-03 | 5.02e-03 | 3.24e-03 | 28 |
| hsa0123231 | Oral cavity | LP | Nucleotide metabolism | 42/2418 | 85/8465 | 3.62e-05 | 2.36e-04 | 1.52e-04 | 42 |
| hsa0024031 | Oral cavity | LP | Pyrimidine metabolism | 28/2418 | 58/8465 | 1.12e-03 | 5.02e-03 | 3.24e-03 | 28 |
| Page: 1 |
Top |
Cell-cell communication analysis |
| Identification of potential cell-cell interactions between two cell types and their ligand-receptor pairs for different disease states |
| Ligand | Receptor | LRpair | Pathway | Tissue | Disease Stage |
| Page: 1 |
Top |
Single-cell gene regulatory network inference analysis |
| Find out the significant the regulons (TFs) and the target genes of each regulon across cell types for different disease states |
| TF | Cell Type | Tissue | Disease Stage | Target Gene | RSS | Regulon Activity |
| ∗The dot plots of a searched regulon are shown for all cell subpopulations in each disease state of each tissue based on the regulon specific score inferred using pySCENIC and by calculating the average expression. |
| Page: 1 |
Top |
Somatic mutation of malignant transformation related genes |
| Annotation of somatic variants for genes involved in malignant transformation |
| Hugo Symbol | Variant Class | Variant Classification | dbSNP RS | HGVSc | HGVSp | HGVSp Short | SWISSPROT | BIOTYPE | SIFT | PolyPhen | Tumor Sample Barcode | Tissue | Histology | Sex | Age | Stage | Therapy Types | Drugs | Outcome |
| DTYMK | SNV | Missense_Mutation | c.212N>C | p.Leu71Pro | p.L71P | P23919 | protein_coding | deleterious(0) | probably_damaging(0.999) | TCGA-A8-A09Z-01 | Breast | breast invasive carcinoma | Female | >=65 | I/II | Unknown | Unknown | SD | |
| DTYMK | deletion | Frame_Shift_Del | novel | c.395delT | p.Phe132SerfsTer37 | p.F132Sfs*37 | P23919 | protein_coding | TCGA-D8-A27V-01 | Breast | breast invasive carcinoma | Female | <65 | I/II | Hormone Therapy | tamoxiphen | SD | ||
| DTYMK | SNV | Missense_Mutation | c.259T>A | p.Leu87Met | p.L87M | P23919 | protein_coding | deleterious(0.01) | probably_damaging(0.971) | TCGA-AG-A016-01 | Colorectum | rectum adenocarcinoma | Male | <65 | III/IV | Chemotherapy | 5-fluorouracil | SD | |
| DTYMK | SNV | Missense_Mutation | rs766664417 | c.434N>T | p.Ala145Val | p.A145V | P23919 | protein_coding | deleterious(0.04) | benign(0.054) | TCGA-A5-A0G2-01 | Endometrium | uterine corpus endometrioid carcinoma | Female | <65 | III/IV | Unknown | Unknown | SD |
| DTYMK | SNV | Missense_Mutation | c.575N>A | p.Arg192His | p.R192H | P23919 | protein_coding | tolerated(0.36) | benign(0) | TCGA-A5-A0GB-01 | Endometrium | uterine corpus endometrioid carcinoma | Female | >=65 | I/II | Unknown | Unknown | SD | |
| DTYMK | SNV | Missense_Mutation | rs149828739 | c.449N>A | p.Arg150His | p.R150H | P23919 | protein_coding | deleterious(0) | probably_damaging(0.996) | TCGA-AP-A051-01 | Endometrium | uterine corpus endometrioid carcinoma | Female | >=65 | I/II | Unknown | Unknown | SD |
| DTYMK | SNV | Missense_Mutation | novel | c.620N>C | p.Leu207Pro | p.L207P | P23919 | protein_coding | deleterious(0) | probably_damaging(0.928) | TCGA-AX-A06F-01 | Endometrium | uterine corpus endometrioid carcinoma | Female | <65 | III/IV | Chemotherapy | carboplatin | SD |
| DTYMK | SNV | Missense_Mutation | novel | c.478N>A | p.Ala160Thr | p.A160T | P23919 | protein_coding | deleterious(0) | possibly_damaging(0.448) | TCGA-AX-A06F-01 | Endometrium | uterine corpus endometrioid carcinoma | Female | <65 | III/IV | Chemotherapy | carboplatin | SD |
| DTYMK | SNV | Missense_Mutation | c.242N>T | p.Pro81Leu | p.P81L | P23919 | protein_coding | deleterious(0.05) | benign(0.19) | TCGA-AX-A1CE-01 | Endometrium | uterine corpus endometrioid carcinoma | Female | <65 | I/II | Unspecific | Paclitaxel | SD | |
| DTYMK | SNV | Missense_Mutation | rs139227304 | c.427N>T | p.Arg143Trp | p.R143W | P23919 | protein_coding | deleterious(0) | probably_damaging(1) | TCGA-D1-A1O7-01 | Endometrium | uterine corpus endometrioid carcinoma | Female | <65 | I/II | Unknown | Unknown | SD |
| Page: 1 2 |
Top |
Related drugs of malignant transformation related genes |
| Identification of chemicals and drugs interact with genes involved in malignant transfromation |
| (DGIdb 4.0) |
| Entrez ID | Symbol | Category | Interaction Types | Drug Claim Name | Drug Name | PMIDs |
| 1841 | DTYMK | KINASE | 5-FU | FLUOROURACIL | 15067352 | |
| 1841 | DTYMK | KINASE | zidovudine | ZIDOVUDINE | 22960662 | |
| 1841 | DTYMK | KINASE | D4T | STAVUDINE | 15134538 | |
| 1841 | DTYMK | KINASE | ETHANOL | ALCOHOL | 11923581 |
| Page: 1 |

Copyright 2023-Present -The University of Texas Health Science Center at Houston |