
|
|||||
|
 | |
| |
| |
| |
| |
| |
|
Gene: DTX4 |
Gene summary for DTX4 |
| Gene information | Species | Human | Gene symbol | DTX4 | Gene ID | 23220 |
| Gene name | deltex E3 ubiquitin ligase 4 | |
| Gene Alias | RNF155 | |
| Cytomap | 11q12.1 | |
| Gene Type | protein-coding | GO ID | GO:0001816 | UniProtAcc | Q9Y2E6 |
Top |
Malignant transformation analysis |
| Identification of the aberrant gene expression in precancerous and cancerous lesions by comparing the gene expression of stem-like cells in diseased tissues with normal stem cells |
| Entrez ID | Symbol | Replicates | Species | Organ | Tissue | Adj P-value | Log2FC | Malignancy |
| 23220 | DTX4 | male-WTA | Human | Thyroid | PTC | 3.54e-78 | 1.01e+00 | 0.1037 |
| 23220 | DTX4 | female-WTA | Human | Thyroid | PTC | 8.20e-03 | 2.99e-01 | 0.0726 |
| 23220 | DTX4 | PTC01 | Human | Thyroid | PTC | 3.99e-17 | 4.75e-01 | 0.1899 |
| 23220 | DTX4 | PTC03 | Human | Thyroid | PTC | 5.73e-14 | 6.49e-01 | 0.1784 |
| 23220 | DTX4 | PTC04 | Human | Thyroid | PTC | 2.13e-24 | 6.03e-01 | 0.1927 |
| 23220 | DTX4 | PTC05 | Human | Thyroid | PTC | 1.47e-35 | 1.22e+00 | 0.2065 |
| 23220 | DTX4 | PTC06 | Human | Thyroid | PTC | 6.08e-59 | 1.28e+00 | 0.2057 |
| 23220 | DTX4 | PTC07 | Human | Thyroid | PTC | 1.13e-42 | 8.69e-01 | 0.2044 |
| 23220 | DTX4 | ATC13 | Human | Thyroid | ATC | 1.37e-02 | 6.11e-02 | 0.34 |
| 23220 | DTX4 | ATC5 | Human | Thyroid | ATC | 5.79e-08 | 6.61e-02 | 0.34 |
| Page: 1 |
| Tissue | Expression Dynamics | Abbreviation |
| Thyroid | 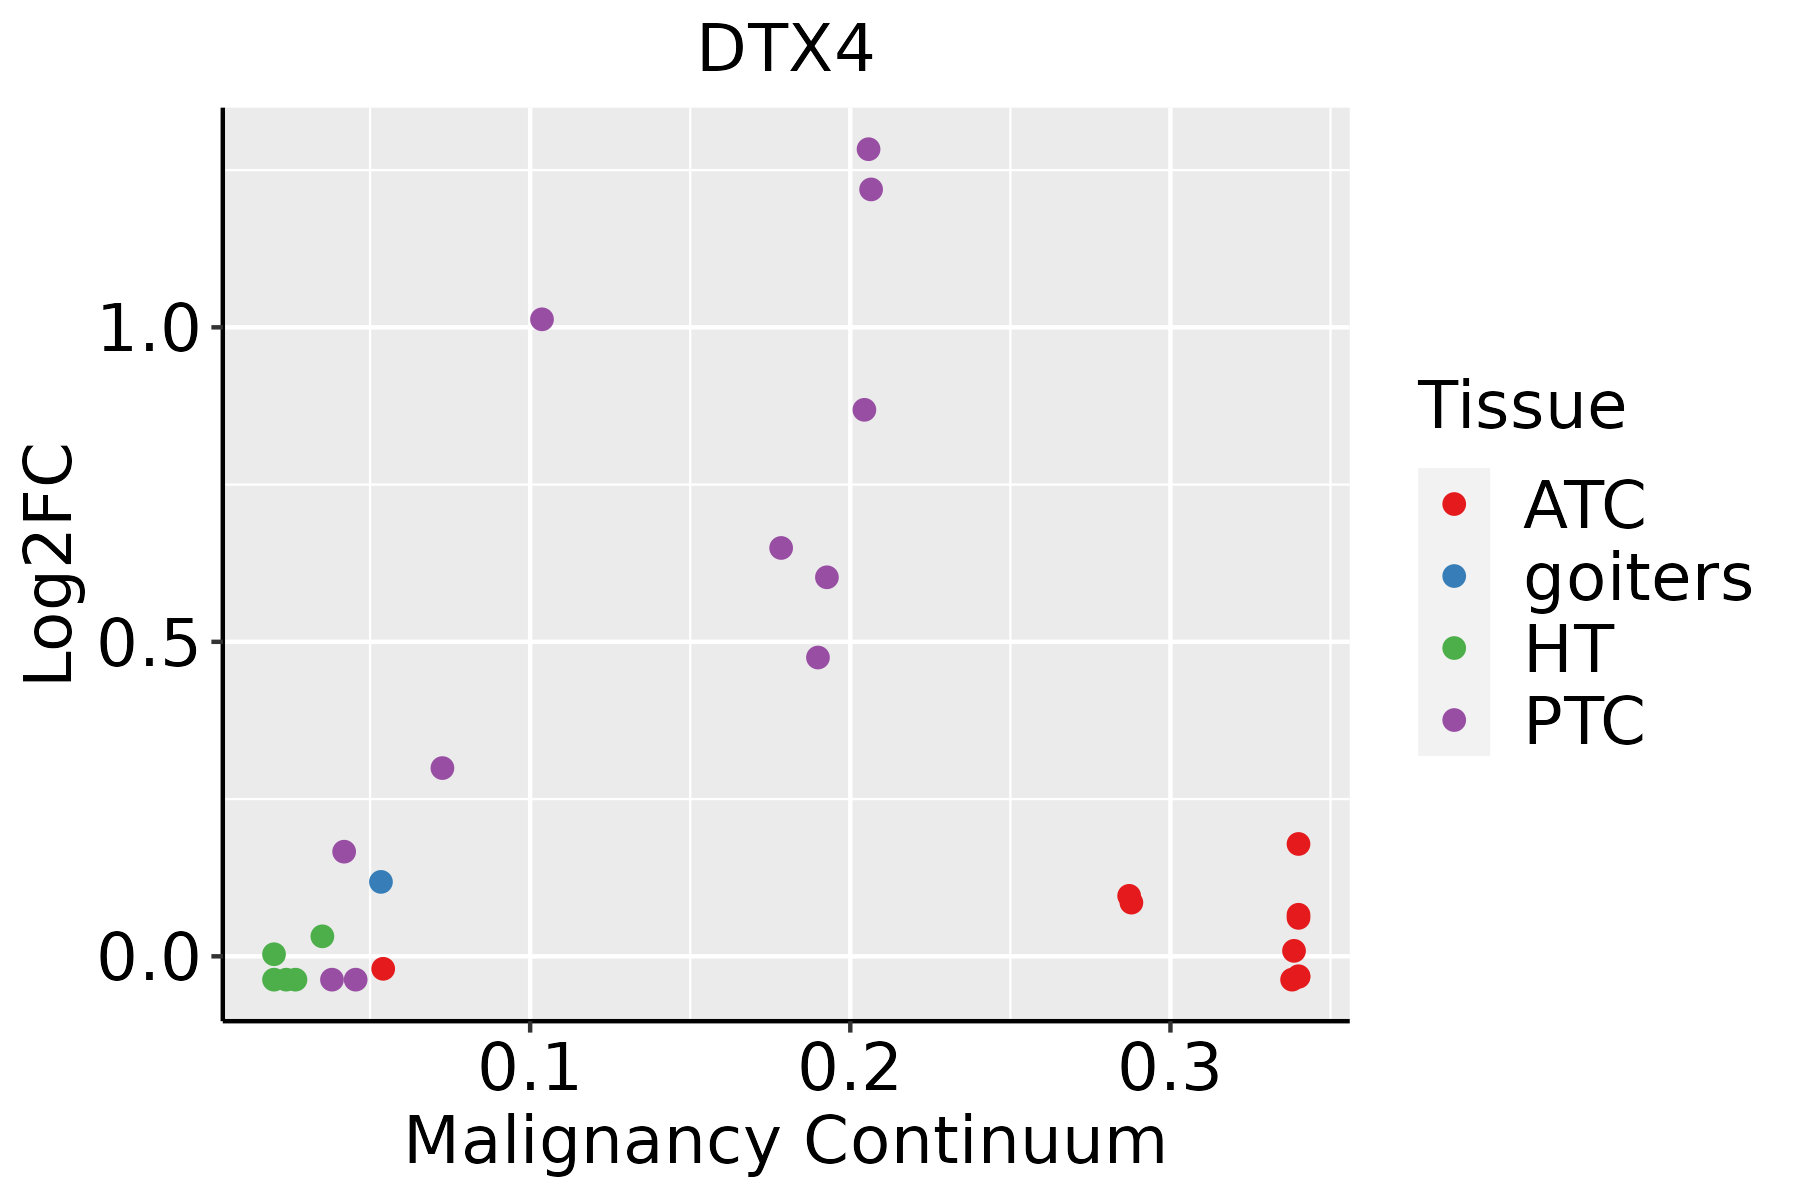 | ATC: Anaplastic thyroid cancer |
| HT: Hashimoto's thyroiditis | ||
| PTC: Papillary thyroid cancer |
| ∗log2FC in expression of this searched gene in stem-like cells from each diseased tissue sample relative to stem-like cells in normal samples in each tissue plotted against the malignancy continuum. Samples are colored based on if they are from different disease stage. |
Top |
Malignant transformation related pathway analysis |
| Find out the enriched GO biological processes and KEGG pathways involved in transition from healthy to precancer to cancer |
| Tissue | Disease Stage | Enriched GO biological Processes |
| Colorectum | AD |  |
| Colorectum | SER |  |
| Colorectum | MSS |  |
| Colorectum | MSI-H |  |
| Colorectum | FAP |  |
| ∗Top 15 enriched GO BP terms are showed in the bar plot of each disease state in each tissue. Each row represents a significant GO biological process which is colored according to the -log10(p.adjust). |
| Page: 1 2 3 4 5 6 7 8 9 |
| GO ID | Tissue | Disease Stage | Description | Gene Ratio | Bg Ratio | pvalue | p.adjust | Count |
| GO:00324796 | Thyroid | PTC | regulation of type I interferon production | 45/5968 | 95/18723 | 1.13e-03 | 6.63e-03 | 45 |
| GO:00326066 | Thyroid | PTC | type I interferon production | 45/5968 | 95/18723 | 1.13e-03 | 6.63e-03 | 45 |
| GO:00072199 | Thyroid | PTC | Notch signaling pathway | 70/5968 | 172/18723 | 8.82e-03 | 3.67e-02 | 70 |
| GO:000721915 | Thyroid | ATC | Notch signaling pathway | 79/6293 | 172/18723 | 5.08e-04 | 2.96e-03 | 79 |
| GO:003247913 | Thyroid | ATC | regulation of type I interferon production | 47/6293 | 95/18723 | 9.81e-04 | 5.21e-03 | 47 |
| GO:003260613 | Thyroid | ATC | type I interferon production | 47/6293 | 95/18723 | 9.81e-04 | 5.21e-03 | 47 |
| Page: 1 |
| Pathway ID | Tissue | Disease Stage | Description | Gene Ratio | Bg Ratio | pvalue | p.adjust | qvalue | Count |
| Page: 1 |
Top |
Cell-cell communication analysis |
| Identification of potential cell-cell interactions between two cell types and their ligand-receptor pairs for different disease states |
| Ligand | Receptor | LRpair | Pathway | Tissue | Disease Stage |
| Page: 1 |
Top |
Single-cell gene regulatory network inference analysis |
| Find out the significant the regulons (TFs) and the target genes of each regulon across cell types for different disease states |
| TF | Cell Type | Tissue | Disease Stage | Target Gene | RSS | Regulon Activity |
| ∗The dot plots of a searched regulon are shown for all cell subpopulations in each disease state of each tissue based on the regulon specific score inferred using pySCENIC and by calculating the average expression. |
| Page: 1 |
Top |
Somatic mutation of malignant transformation related genes |
| Annotation of somatic variants for genes involved in malignant transformation |
| Hugo Symbol | Variant Class | Variant Classification | dbSNP RS | HGVSc | HGVSp | HGVSp Short | SWISSPROT | BIOTYPE | SIFT | PolyPhen | Tumor Sample Barcode | Tissue | Histology | Sex | Age | Stage | Therapy Types | Drugs | Outcome |
| DTX4 | SNV | Missense_Mutation | novel | c.1741N>A | p.Glu581Lys | p.E581K | Q9Y2E6 | protein_coding | deleterious(0) | probably_damaging(0.985) | TCGA-A2-A0CR-01 | Breast | breast invasive carcinoma | Female | <65 | I/II | Chemotherapy | adriamycin | CR |
| DTX4 | SNV | Missense_Mutation | c.292G>A | p.Asp98Asn | p.D98N | Q9Y2E6 | protein_coding | deleterious(0.03) | probably_damaging(0.926) | TCGA-A2-A25B-01 | Breast | breast invasive carcinoma | Female | <65 | I/II | Chemotherapy | taxotere | PD | |
| DTX4 | SNV | Missense_Mutation | novel | c.556N>C | p.Met186Leu | p.M186L | Q9Y2E6 | protein_coding | tolerated(0.68) | benign(0) | TCGA-AN-A0FF-01 | Breast | breast invasive carcinoma | Female | <65 | I/II | Unknown | Unknown | SD |
| DTX4 | SNV | Missense_Mutation | rs770339821 | c.460N>T | p.Arg154Cys | p.R154C | Q9Y2E6 | protein_coding | deleterious(0) | probably_damaging(0.938) | TCGA-B6-A0RS-01 | Breast | breast invasive carcinoma | Female | <65 | I/II | Unknown | Unknown | PD |
| DTX4 | SNV | Missense_Mutation | c.1642C>T | p.Leu548Phe | p.L548F | Q9Y2E6 | protein_coding | tolerated(0.17) | possibly_damaging(0.82) | TCGA-D8-A1J8-01 | Breast | breast invasive carcinoma | Female | >=65 | I/II | Hormone Therapy | nolvadex | SD | |
| DTX4 | deletion | Frame_Shift_Del | novel | c.513delT | p.Gln172SerfsTer26 | p.Q172Sfs*26 | Q9Y2E6 | protein_coding | TCGA-EW-A2FV-01 | Breast | breast invasive carcinoma | Female | <65 | III/IV | Chemotherapy | docetaxel | SD | ||
| DTX4 | SNV | Missense_Mutation | c.1404N>T | p.Lys468Asn | p.K468N | Q9Y2E6 | protein_coding | deleterious(0) | probably_damaging(0.998) | TCGA-FU-A3HZ-01 | Cervix | cervical & endocervical cancer | Female | <65 | I/II | Chemotherapy | cisplatin | CR | |
| DTX4 | SNV | Missense_Mutation | rs577423377 | c.665C>T | p.Pro222Leu | p.P222L | Q9Y2E6 | protein_coding | tolerated(0.6) | benign(0) | TCGA-A6-5661-01 | Colorectum | colon adenocarcinoma | Female | >=65 | I/II | Unknown | Unknown | SD |
| DTX4 | SNV | Missense_Mutation | rs376061897 | c.1081G>A | p.Val361Ile | p.V361I | Q9Y2E6 | protein_coding | tolerated(0.14) | benign(0.033) | TCGA-A6-6781-01 | Colorectum | colon adenocarcinoma | Male | <65 | III/IV | Chemotherapy | oxaliplatin | SD |
| DTX4 | SNV | Missense_Mutation | c.1229N>T | p.Thr410Ile | p.T410I | Q9Y2E6 | protein_coding | tolerated(0.67) | probably_damaging(0.999) | TCGA-AA-3672-01 | Colorectum | colon adenocarcinoma | Female | >=65 | III/IV | Unknown | Unknown | SD |
| Page: 1 2 3 4 5 6 7 |
Top |
Related drugs of malignant transformation related genes |
| Identification of chemicals and drugs interact with genes involved in malignant transfromation |
| (DGIdb 4.0) |
| Entrez ID | Symbol | Category | Interaction Types | Drug Claim Name | Drug Name | PMIDs |
| Page: 1 |

Copyright 2023-Present -The University of Texas Health Science Center at Houston |