
|
|||||
|
 | |
| |
| |
| |
| |
| |
|
Gene: DTX2 |
Gene summary for DTX2 |
| Gene information | Species | Human | Gene symbol | DTX2 | Gene ID | 113878 |
| Gene name | deltex E3 ubiquitin ligase 2 | |
| Gene Alias | RNF58 | |
| Cytomap | 7q11.23 | |
| Gene Type | protein-coding | GO ID | GO:0006464 | UniProtAcc | Q86UW9 |
Top |
Malignant transformation analysis |
| Identification of the aberrant gene expression in precancerous and cancerous lesions by comparing the gene expression of stem-like cells in diseased tissues with normal stem cells |
| Entrez ID | Symbol | Replicates | Species | Organ | Tissue | Adj P-value | Log2FC | Malignancy |
| 113878 | DTX2 | CCI_2 | Human | Cervix | CC | 3.02e-10 | 8.73e-01 | 0.5249 |
| 113878 | DTX2 | CCI_3 | Human | Cervix | CC | 6.37e-08 | 6.18e-01 | 0.516 |
| 113878 | DTX2 | H2 | Human | Cervix | HSIL_HPV | 6.90e-07 | 2.84e-01 | 0.0632 |
| 113878 | DTX2 | T3 | Human | Cervix | CC | 4.29e-02 | 1.56e-01 | 0.1389 |
| 113878 | DTX2 | LZE4T | Human | Esophagus | ESCC | 2.22e-09 | 2.93e-01 | 0.0811 |
| 113878 | DTX2 | LZE7T | Human | Esophagus | ESCC | 1.66e-11 | 7.08e-01 | 0.0667 |
| 113878 | DTX2 | LZE8T | Human | Esophagus | ESCC | 1.65e-16 | 5.48e-01 | 0.067 |
| 113878 | DTX2 | LZE20T | Human | Esophagus | ESCC | 2.30e-08 | 4.48e-01 | 0.0662 |
| 113878 | DTX2 | LZE21D1 | Human | Esophagus | HGIN | 9.71e-03 | 5.47e-01 | 0.0632 |
| 113878 | DTX2 | LZE22D1 | Human | Esophagus | HGIN | 8.05e-08 | 6.89e-01 | 0.0595 |
| 113878 | DTX2 | LZE22T | Human | Esophagus | ESCC | 7.18e-11 | 6.59e-01 | 0.068 |
| 113878 | DTX2 | LZE24T | Human | Esophagus | ESCC | 7.82e-29 | 9.53e-01 | 0.0596 |
| 113878 | DTX2 | LZE21T | Human | Esophagus | ESCC | 1.07e-18 | 8.94e-01 | 0.0655 |
| 113878 | DTX2 | P1T-E | Human | Esophagus | ESCC | 5.52e-24 | 1.05e+00 | 0.0875 |
| 113878 | DTX2 | P2T-E | Human | Esophagus | ESCC | 9.80e-48 | 8.69e-01 | 0.1177 |
| 113878 | DTX2 | P4T-E | Human | Esophagus | ESCC | 1.11e-13 | 3.87e-01 | 0.1323 |
| 113878 | DTX2 | P5T-E | Human | Esophagus | ESCC | 1.57e-18 | 2.90e-01 | 0.1327 |
| 113878 | DTX2 | P8T-E | Human | Esophagus | ESCC | 1.06e-32 | 7.12e-01 | 0.0889 |
| 113878 | DTX2 | P9T-E | Human | Esophagus | ESCC | 2.98e-11 | 2.54e-01 | 0.1131 |
| 113878 | DTX2 | P10T-E | Human | Esophagus | ESCC | 8.02e-23 | 3.32e-01 | 0.116 |
| Page: 1 2 3 4 5 |
| Tissue | Expression Dynamics | Abbreviation |
| Cervix | 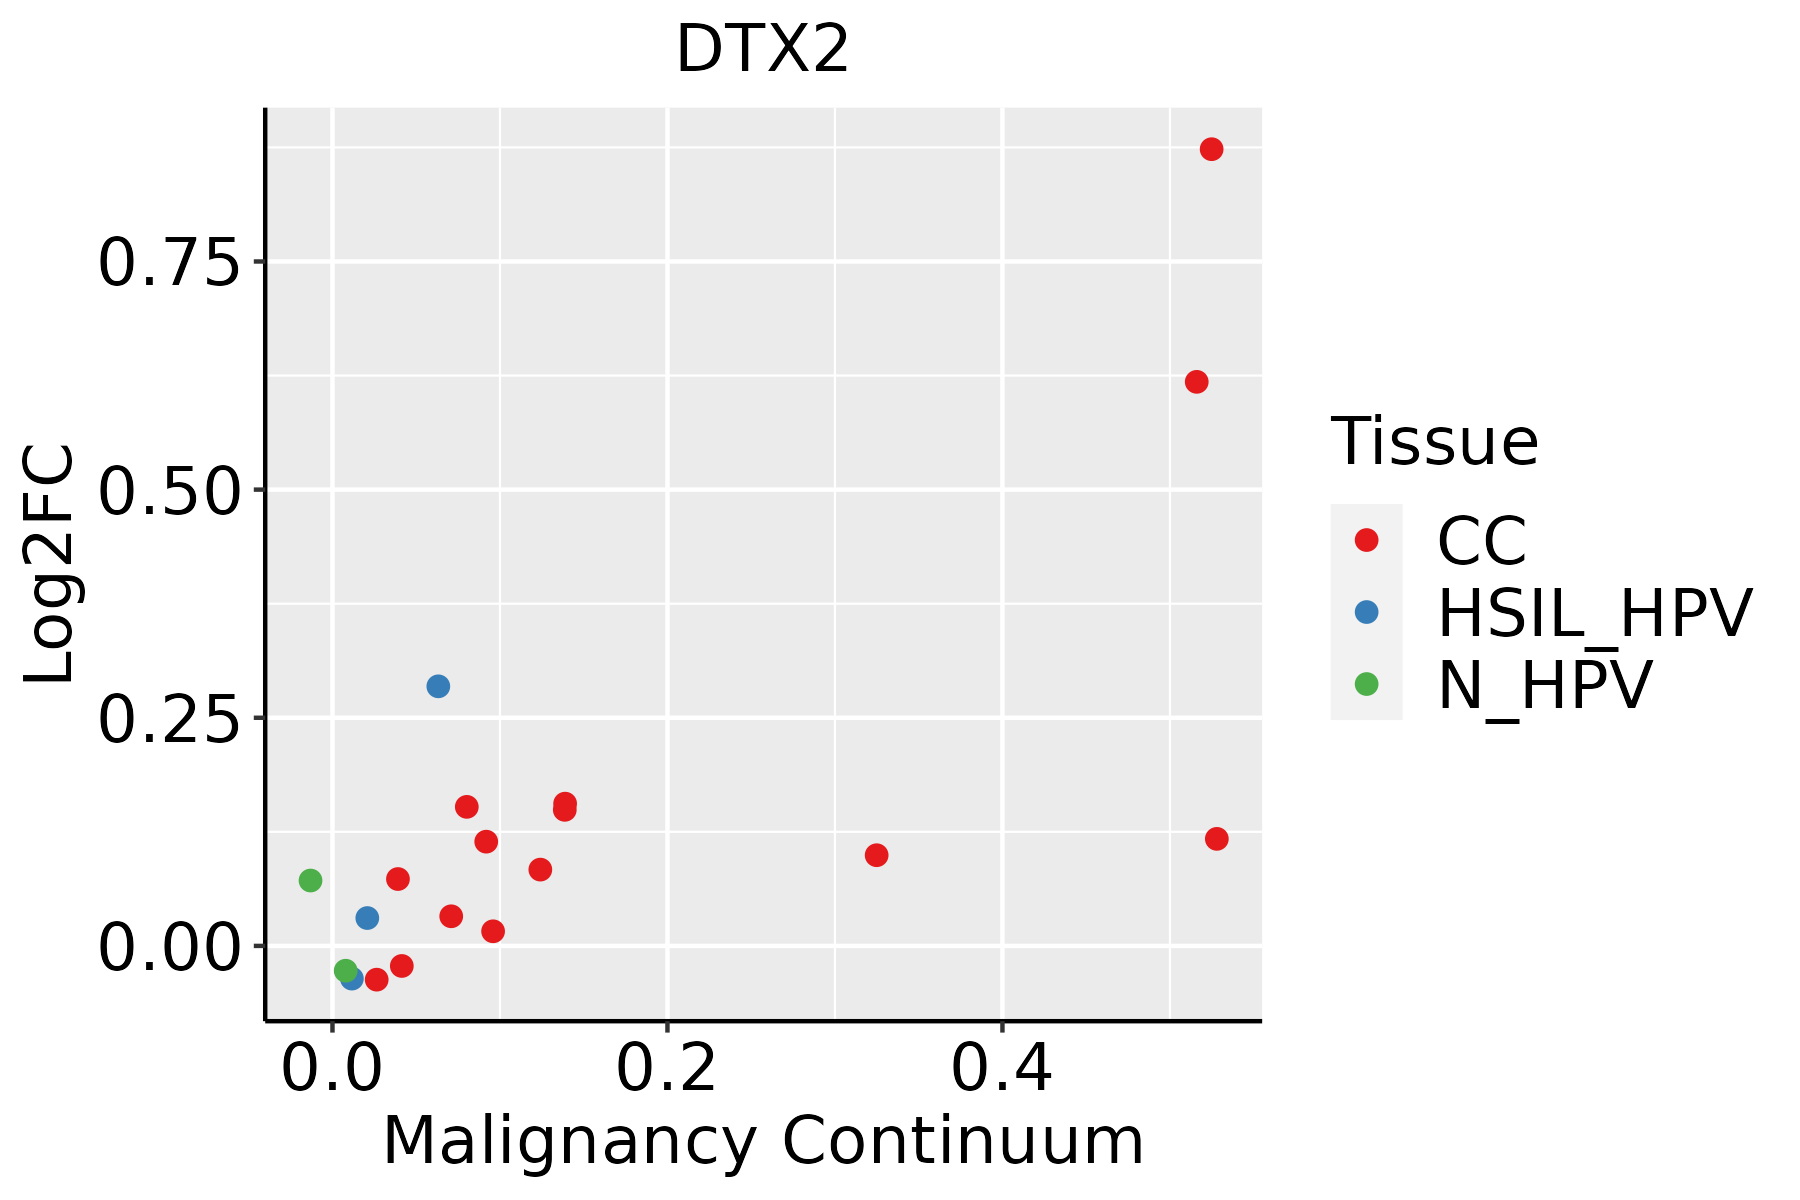 | CC: Cervix cancer |
| HSIL_HPV: HPV-infected high-grade squamous intraepithelial lesions | ||
| N_HPV: HPV-infected normal cervix | ||
| Esophagus |  | ESCC: Esophageal squamous cell carcinoma |
| HGIN: High-grade intraepithelial neoplasias | ||
| LGIN: Low-grade intraepithelial neoplasias | ||
| Oral Cavity |  | EOLP: Erosive Oral lichen planus |
| LP: leukoplakia | ||
| NEOLP: Non-erosive oral lichen planus | ||
| OSCC: Oral squamous cell carcinoma | ||
| Skin |  | AK: Actinic keratosis |
| cSCC: Cutaneous squamous cell carcinoma | ||
| SCCIS:squamous cell carcinoma in situ | ||
| Thyroid |  | ATC: Anaplastic thyroid cancer |
| HT: Hashimoto's thyroiditis | ||
| PTC: Papillary thyroid cancer |
| ∗log2FC in expression of this searched gene in stem-like cells from each diseased tissue sample relative to stem-like cells in normal samples in each tissue plotted against the malignancy continuum. Samples are colored based on if they are from different disease stage. |
Top |
Malignant transformation related pathway analysis |
| Find out the enriched GO biological processes and KEGG pathways involved in transition from healthy to precancer to cancer |
| Tissue | Disease Stage | Enriched GO biological Processes |
| Colorectum | AD |  |
| Colorectum | SER |  |
| Colorectum | MSS |  |
| Colorectum | MSI-H |  |
| Colorectum | FAP |  |
| ∗Top 15 enriched GO BP terms are showed in the bar plot of each disease state in each tissue. Each row represents a significant GO biological process which is colored according to the -log10(p.adjust). |
| Page: 1 2 3 4 5 6 7 8 9 |
| GO ID | Tissue | Disease Stage | Description | Gene Ratio | Bg Ratio | pvalue | p.adjust | Count |
| GO:00072194 | Cervix | CC | Notch signaling pathway | 39/2311 | 172/18723 | 1.08e-04 | 1.38e-03 | 39 |
| GO:00072197 | Esophagus | ESCC | Notch signaling pathway | 106/8552 | 172/18723 | 1.74e-05 | 1.55e-04 | 106 |
| GO:00072196 | Oral cavity | OSCC | Notch signaling pathway | 92/7305 | 172/18723 | 7.84e-05 | 6.08e-04 | 92 |
| GO:000721922 | Skin | cSCC | Notch signaling pathway | 60/4864 | 172/18723 | 5.82e-03 | 2.87e-02 | 60 |
| GO:00072199 | Thyroid | PTC | Notch signaling pathway | 70/5968 | 172/18723 | 8.82e-03 | 3.67e-02 | 70 |
| GO:000721915 | Thyroid | ATC | Notch signaling pathway | 79/6293 | 172/18723 | 5.08e-04 | 2.96e-03 | 79 |
| Page: 1 |
| Pathway ID | Tissue | Disease Stage | Description | Gene Ratio | Bg Ratio | pvalue | p.adjust | qvalue | Count |
| hsa043306 | Esophagus | ESCC | Notch signaling pathway | 42/4205 | 62/8465 | 2.97e-03 | 7.97e-03 | 4.08e-03 | 42 |
| hsa0433013 | Esophagus | ESCC | Notch signaling pathway | 42/4205 | 62/8465 | 2.97e-03 | 7.97e-03 | 4.08e-03 | 42 |
| hsa043305 | Oral cavity | OSCC | Notch signaling pathway | 44/3704 | 62/8465 | 1.26e-05 | 5.55e-05 | 2.83e-05 | 44 |
| hsa0433012 | Oral cavity | OSCC | Notch signaling pathway | 44/3704 | 62/8465 | 1.26e-05 | 5.55e-05 | 2.83e-05 | 44 |
| Page: 1 |
Top |
Cell-cell communication analysis |
| Identification of potential cell-cell interactions between two cell types and their ligand-receptor pairs for different disease states |
| Ligand | Receptor | LRpair | Pathway | Tissue | Disease Stage |
| Page: 1 |
Top |
Single-cell gene regulatory network inference analysis |
| Find out the significant the regulons (TFs) and the target genes of each regulon across cell types for different disease states |
| TF | Cell Type | Tissue | Disease Stage | Target Gene | RSS | Regulon Activity |
| ∗The dot plots of a searched regulon are shown for all cell subpopulations in each disease state of each tissue based on the regulon specific score inferred using pySCENIC and by calculating the average expression. |
| Page: 1 |
Top |
Somatic mutation of malignant transformation related genes |
| Annotation of somatic variants for genes involved in malignant transformation |
| Hugo Symbol | Variant Class | Variant Classification | dbSNP RS | HGVSc | HGVSp | HGVSp Short | SWISSPROT | BIOTYPE | SIFT | PolyPhen | Tumor Sample Barcode | Tissue | Histology | Sex | Age | Stage | Therapy Types | Drugs | Outcome |
| DTX2 | SNV | Missense_Mutation | rs754766592 | c.394N>G | p.Leu132Val | p.L132V | Q86UW9 | protein_coding | deleterious(0) | benign(0.086) | TCGA-E2-A1L8-01 | Breast | breast invasive carcinoma | Female | <65 | I/II | Chemotherapy | cyclophosphamide | SD |
| DTX2 | SNV | Missense_Mutation | novel | c.1091N>T | p.Ser364Phe | p.S364F | Q86UW9 | protein_coding | deleterious(0) | possibly_damaging(0.779) | TCGA-E9-A1RD-01 | Breast | breast invasive carcinoma | Female | >=65 | I/II | Hormone Therapy | tamoxiphen | SD |
| DTX2 | SNV | Missense_Mutation | rs747982040 | c.703G>A | p.Ala235Thr | p.A235T | Q86UW9 | protein_coding | tolerated(0.3) | benign(0.005) | TCGA-2W-A8YY-01 | Cervix | cervical & endocervical cancer | Female | <65 | I/II | Chemotherapy | cisplatin | CR |
| DTX2 | SNV | Missense_Mutation | c.10N>T | p.Ala4Ser | p.A4S | Q86UW9 | protein_coding | deleterious_low_confidence(0.02) | possibly_damaging(0.459) | TCGA-A6-2686-01 | Colorectum | colon adenocarcinoma | Female | >=65 | I/II | Unknown | Unknown | SD | |
| DTX2 | SNV | Missense_Mutation | c.671N>G | p.Tyr224Cys | p.Y224C | Q86UW9 | protein_coding | tolerated(0.17) | possibly_damaging(0.598) | TCGA-AA-3833-01 | Colorectum | colon adenocarcinoma | Female | <65 | I/II | Unknown | Unknown | SD | |
| DTX2 | SNV | Missense_Mutation | rs559156215 | c.805G>A | p.Ala269Thr | p.A269T | Q86UW9 | protein_coding | tolerated(0.3) | benign(0) | TCGA-A5-A0G2-01 | Endometrium | uterine corpus endometrioid carcinoma | Female | <65 | III/IV | Unknown | Unknown | SD |
| DTX2 | SNV | Missense_Mutation | c.158N>A | p.Arg53His | p.R53H | Q86UW9 | protein_coding | tolerated(0.09) | benign(0.125) | TCGA-AX-A0J1-01 | Endometrium | uterine corpus endometrioid carcinoma | Female | >=65 | I/II | Unknown | Unknown | SD | |
| DTX2 | SNV | Missense_Mutation | novel | c.1051N>C | p.Cys351Arg | p.C351R | Q86UW9 | protein_coding | tolerated(0.27) | benign(0.012) | TCGA-AX-A1CE-01 | Endometrium | uterine corpus endometrioid carcinoma | Female | <65 | I/II | Unspecific | Paclitaxel | SD |
| DTX2 | SNV | Missense_Mutation | rs749904794 | c.1846G>A | p.Glu616Lys | p.E616K | Q86UW9 | protein_coding | deleterious(0) | probably_damaging(0.97) | TCGA-AX-A2HC-01 | Endometrium | uterine corpus endometrioid carcinoma | Female | <65 | III/IV | Chemotherapy | paclitaxel | PD |
| DTX2 | SNV | Missense_Mutation | novel | c.328N>T | p.Val110Phe | p.V110F | Q86UW9 | protein_coding | deleterious(0) | possibly_damaging(0.529) | TCGA-AX-A2HJ-01 | Endometrium | uterine corpus endometrioid carcinoma | Female | <65 | I/II | Unknown | Unknown | SD |
| Page: 1 2 3 4 |
Top |
Related drugs of malignant transformation related genes |
| Identification of chemicals and drugs interact with genes involved in malignant transfromation |
| (DGIdb 4.0) |
| Entrez ID | Symbol | Category | Interaction Types | Drug Claim Name | Drug Name | PMIDs |
| Page: 1 |

Copyright 2023-Present -The University of Texas Health Science Center at Houston |