
|
|||||
|
 | |
| |
| |
| |
| |
| |
|
Gene: DTWD2 |
Gene summary for DTWD2 |
| Gene information | Species | Human | Gene symbol | DTWD2 | Gene ID | 285605 |
| Gene name | DTW domain containing 2 | |
| Gene Alias | DTWD2 | |
| Cytomap | 5q23.1 | |
| Gene Type | protein-coding | GO ID | GO:0006139 | UniProtAcc | J3KND6 |
Top |
Malignant transformation analysis |
| Identification of the aberrant gene expression in precancerous and cancerous lesions by comparing the gene expression of stem-like cells in diseased tissues with normal stem cells |
| Entrez ID | Symbol | Replicates | Species | Organ | Tissue | Adj P-value | Log2FC | Malignancy |
| 285605 | DTWD2 | HTA11_3410_2000001011 | Human | Colorectum | AD | 9.65e-14 | 5.64e-01 | 0.0155 |
| 285605 | DTWD2 | HTA11_2487_2000001011 | Human | Colorectum | SER | 3.97e-13 | 9.48e-01 | -0.1808 |
| 285605 | DTWD2 | HTA11_1938_2000001011 | Human | Colorectum | AD | 7.79e-19 | 1.53e+00 | -0.0811 |
| 285605 | DTWD2 | HTA11_78_2000001011 | Human | Colorectum | AD | 3.84e-25 | 1.23e+00 | -0.1088 |
| 285605 | DTWD2 | HTA11_347_2000001011 | Human | Colorectum | AD | 1.24e-45 | 1.49e+00 | -0.1954 |
| 285605 | DTWD2 | HTA11_411_2000001011 | Human | Colorectum | SER | 4.80e-09 | 1.24e+00 | -0.2602 |
| 285605 | DTWD2 | HTA11_3361_2000001011 | Human | Colorectum | AD | 1.54e-06 | 1.13e+00 | -0.1207 |
| 285605 | DTWD2 | HTA11_83_2000001011 | Human | Colorectum | SER | 4.65e-15 | 1.13e+00 | -0.1526 |
| 285605 | DTWD2 | HTA11_696_2000001011 | Human | Colorectum | AD | 1.88e-21 | 1.02e+00 | -0.1464 |
| 285605 | DTWD2 | HTA11_866_2000001011 | Human | Colorectum | AD | 3.16e-20 | 8.84e-01 | -0.1001 |
| 285605 | DTWD2 | HTA11_1391_2000001011 | Human | Colorectum | AD | 3.63e-25 | 1.77e+00 | -0.059 |
| 285605 | DTWD2 | HTA11_2992_2000001011 | Human | Colorectum | SER | 3.31e-03 | 6.18e-01 | -0.1706 |
| 285605 | DTWD2 | HTA11_5212_2000001011 | Human | Colorectum | AD | 2.28e-06 | 7.93e-01 | -0.2061 |
| 285605 | DTWD2 | HTA11_5216_2000001011 | Human | Colorectum | SER | 4.30e-07 | 8.83e-01 | -0.1462 |
| 285605 | DTWD2 | HTA11_546_2000001011 | Human | Colorectum | AD | 1.68e-06 | 8.80e-01 | -0.0842 |
| 285605 | DTWD2 | HTA11_7862_2000001011 | Human | Colorectum | AD | 9.19e-20 | 1.10e+00 | -0.0179 |
| 285605 | DTWD2 | HTA11_866_3004761011 | Human | Colorectum | AD | 2.13e-54 | 1.75e+00 | 0.096 |
| 285605 | DTWD2 | HTA11_4255_2000001011 | Human | Colorectum | SER | 3.57e-17 | 1.48e+00 | 0.0446 |
| 285605 | DTWD2 | HTA11_8622_2000001021 | Human | Colorectum | SER | 2.47e-11 | 1.13e+00 | 0.0528 |
| 285605 | DTWD2 | HTA11_7663_2000001011 | Human | Colorectum | SER | 2.15e-21 | 1.58e+00 | 0.0131 |
| Page: 1 2 3 |
| Tissue | Expression Dynamics | Abbreviation |
| Colorectum (GSE201348) |  | FAP: Familial adenomatous polyposis |
| CRC: Colorectal cancer | ||
| Colorectum (HTA11) |  | AD: Adenomas |
| SER: Sessile serrated lesions | ||
| MSI-H: Microsatellite-high colorectal cancer | ||
| MSS: Microsatellite stable colorectal cancer | ||
| Liver | 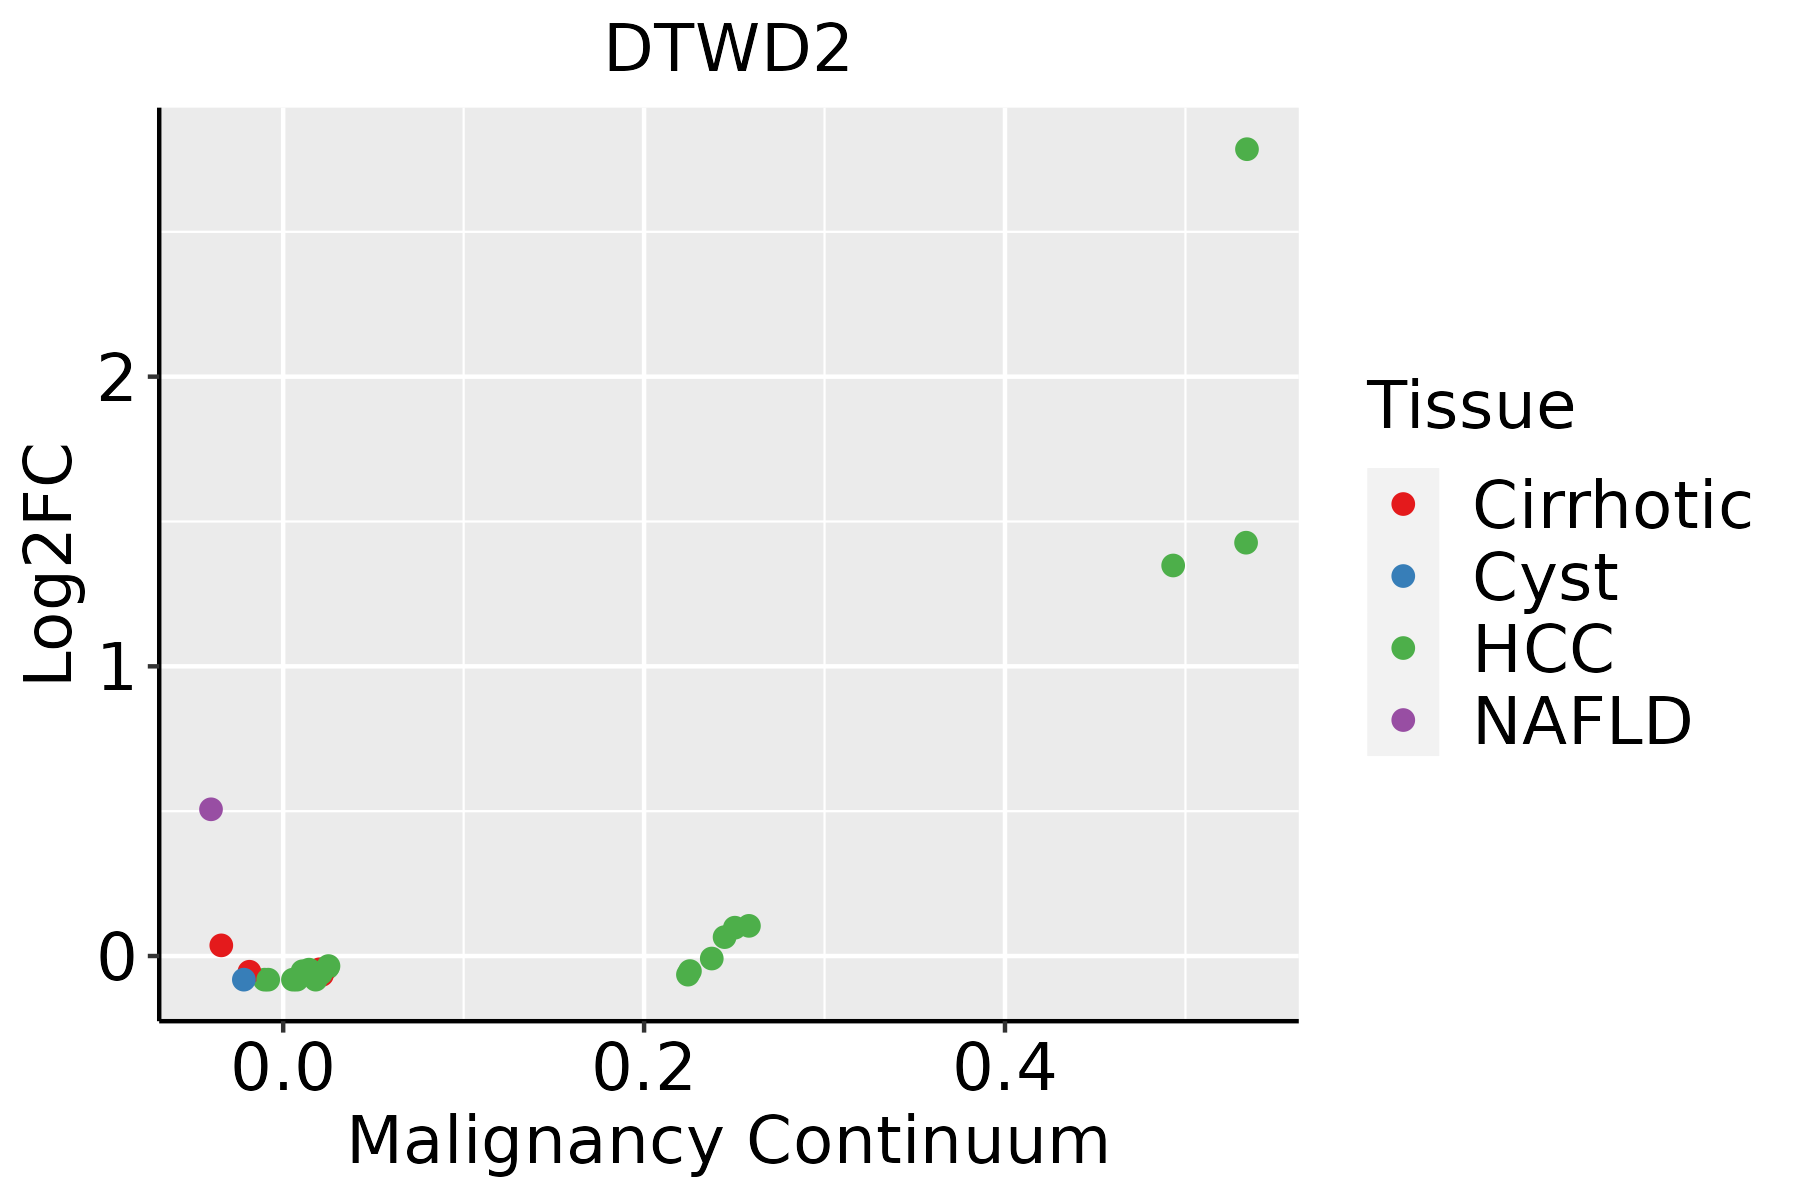 | HCC: Hepatocellular carcinoma |
| NAFLD: Non-alcoholic fatty liver disease |
| ∗log2FC in expression of this searched gene in stem-like cells from each diseased tissue sample relative to stem-like cells in normal samples in each tissue plotted against the malignancy continuum. Samples are colored based on if they are from different disease stage. |
Top |
Malignant transformation related pathway analysis |
| Find out the enriched GO biological processes and KEGG pathways involved in transition from healthy to precancer to cancer |
| Tissue | Disease Stage | Enriched GO biological Processes |
| Colorectum | AD |  |
| Colorectum | SER |  |
| Colorectum | MSS |  |
| Colorectum | MSI-H |  |
| Colorectum | FAP |  |
| ∗Top 15 enriched GO BP terms are showed in the bar plot of each disease state in each tissue. Each row represents a significant GO biological process which is colored according to the -log10(p.adjust). |
| Page: 1 2 3 4 5 6 7 8 9 |
| GO ID | Tissue | Disease Stage | Description | Gene Ratio | Bg Ratio | pvalue | p.adjust | Count |
| GO:0034470 | Colorectum | MSI-H | ncRNA processing | 48/1319 | 395/18723 | 1.54e-04 | 4.47e-03 | 48 |
| GO:0034660 | Colorectum | MSI-H | ncRNA metabolic process | 53/1319 | 485/18723 | 9.66e-04 | 1.68e-02 | 53 |
| GO:00344704 | Liver | NAFLD | ncRNA processing | 57/1882 | 395/18723 | 3.34e-03 | 2.93e-02 | 57 |
| GO:00344702 | Liver | HCC | ncRNA processing | 293/7958 | 395/18723 | 4.26e-38 | 6.76e-35 | 293 |
| GO:00346601 | Liver | HCC | ncRNA metabolic process | 332/7958 | 485/18723 | 1.48e-31 | 7.80e-29 | 332 |
| GO:0008033 | Liver | HCC | tRNA processing | 87/7958 | 127/18723 | 2.66e-09 | 7.23e-08 | 87 |
| GO:0006399 | Liver | HCC | tRNA metabolic process | 108/7958 | 179/18723 | 1.07e-06 | 1.59e-05 | 108 |
| GO:0009451 | Liver | HCC | RNA modification | 101/7958 | 167/18723 | 2.02e-06 | 2.78e-05 | 101 |
| GO:0006400 | Liver | HCC | tRNA modification | 60/7958 | 90/18723 | 3.09e-06 | 4.09e-05 | 60 |
| Page: 1 |
| Pathway ID | Tissue | Disease Stage | Description | Gene Ratio | Bg Ratio | pvalue | p.adjust | qvalue | Count |
| Page: 1 |
Top |
Cell-cell communication analysis |
| Identification of potential cell-cell interactions between two cell types and their ligand-receptor pairs for different disease states |
| Ligand | Receptor | LRpair | Pathway | Tissue | Disease Stage |
| Page: 1 |
Top |
Single-cell gene regulatory network inference analysis |
| Find out the significant the regulons (TFs) and the target genes of each regulon across cell types for different disease states |
| TF | Cell Type | Tissue | Disease Stage | Target Gene | RSS | Regulon Activity |
| ∗The dot plots of a searched regulon are shown for all cell subpopulations in each disease state of each tissue based on the regulon specific score inferred using pySCENIC and by calculating the average expression. |
| Page: 1 |
Top |
Somatic mutation of malignant transformation related genes |
| Annotation of somatic variants for genes involved in malignant transformation |
| Hugo Symbol | Variant Class | Variant Classification | dbSNP RS | HGVSc | HGVSp | HGVSp Short | SWISSPROT | BIOTYPE | SIFT | PolyPhen | Tumor Sample Barcode | Tissue | Histology | Sex | Age | Stage | Therapy Types | Drugs | Outcome |
| DTWD2 | SNV | Missense_Mutation | rs200315964 | c.850N>T | p.Arg284Cys | p.R284C | Q8NBA8 | protein_coding | deleterious(0) | benign(0.015) | TCGA-A2-A4S1-01 | Breast | breast invasive carcinoma | Female | >=65 | I/II | Unknown | Unknown | SD |
| DTWD2 | SNV | Missense_Mutation | c.870N>T | p.Glu290Asp | p.E290D | Q8NBA8 | protein_coding | deleterious(0.04) | possibly_damaging(0.621) | TCGA-AR-A0TP-01 | Breast | breast invasive carcinoma | Female | <65 | I/II | Chemotherapy | doxorubicin | SD | |
| DTWD2 | SNV | Missense_Mutation | rs140154641 | c.737N>A | p.Arg246His | p.R246H | Q8NBA8 | protein_coding | deleterious(0.04) | benign(0.048) | TCGA-AA-3949-01 | Colorectum | colon adenocarcinoma | Female | >=65 | III/IV | Unknown | Unknown | SD |
| DTWD2 | SNV | Missense_Mutation | novel | c.813N>C | p.Lys271Asn | p.K271N | Q8NBA8 | protein_coding | deleterious(0) | benign(0.348) | TCGA-AA-3984-01 | Colorectum | colon adenocarcinoma | Female | <65 | I/II | Unknown | Unknown | SD |
| DTWD2 | SNV | Missense_Mutation | c.50C>T | p.Pro17Leu | p.P17L | Q8NBA8 | protein_coding | tolerated_low_confidence(0.12) | benign(0) | TCGA-CK-4951-01 | Colorectum | colon adenocarcinoma | Female | >=65 | I/II | Unknown | Unknown | PD | |
| DTWD2 | SNV | Missense_Mutation | rs769159957 | c.851G>A | p.Arg284His | p.R284H | Q8NBA8 | protein_coding | tolerated(0.11) | possibly_damaging(0.791) | TCGA-DM-A28A-01 | Colorectum | colon adenocarcinoma | Male | >=65 | III/IV | Unknown | Unknown | SD |
| DTWD2 | SNV | Missense_Mutation | rs753917662 | c.787N>T | p.Arg263Cys | p.R263C | Q8NBA8 | protein_coding | deleterious(0) | possibly_damaging(0.543) | TCGA-AJ-A3EL-01 | Endometrium | uterine corpus endometrioid carcinoma | Female | <65 | I/II | Unknown | Unknown | SD |
| DTWD2 | SNV | Missense_Mutation | rs771577328 | c.389N>A | p.Arg130His | p.R130H | Q8NBA8 | protein_coding | deleterious(0) | probably_damaging(0.995) | TCGA-AJ-A5DW-01 | Endometrium | uterine corpus endometrioid carcinoma | Female | <65 | I/II | Unknown | Unknown | SD |
| DTWD2 | SNV | Missense_Mutation | c.538N>G | p.Thr180Ala | p.T180A | Q8NBA8 | protein_coding | deleterious(0) | probably_damaging(0.998) | TCGA-AP-A059-01 | Endometrium | uterine corpus endometrioid carcinoma | Female | >=65 | I/II | Unknown | Unknown | SD | |
| DTWD2 | SNV | Missense_Mutation | novel | c.880N>C | p.Asn294His | p.N294H | Q8NBA8 | protein_coding | deleterious(0) | benign(0.123) | TCGA-AP-A1DV-01 | Endometrium | uterine corpus endometrioid carcinoma | Female | <65 | I/II | Unknown | Unknown | SD |
| Page: 1 2 3 4 |
Top |
Related drugs of malignant transformation related genes |
| Identification of chemicals and drugs interact with genes involved in malignant transfromation |
| (DGIdb 4.0) |
| Entrez ID | Symbol | Category | Interaction Types | Drug Claim Name | Drug Name | PMIDs |
| Page: 1 |

Copyright 2023-Present -The University of Texas Health Science Center at Houston |