
|
|||||
|
 | |
| |
| |
| |
| |
| |
|
Gene: DTNBP1 |
Gene summary for DTNBP1 |
| Gene information | Species | Human | Gene symbol | DTNBP1 | Gene ID | 84062 |
| Gene name | dystrobrevin binding protein 1 | |
| Gene Alias | BLOC1S8 | |
| Cytomap | 6p22.3 | |
| Gene Type | protein-coding | GO ID | GO:0000902 | UniProtAcc | Q96EV8 |
Top |
Malignant transformation analysis |
| Identification of the aberrant gene expression in precancerous and cancerous lesions by comparing the gene expression of stem-like cells in diseased tissues with normal stem cells |
| Entrez ID | Symbol | Replicates | Species | Organ | Tissue | Adj P-value | Log2FC | Malignancy |
| 84062 | DTNBP1 | HTA11_99999974143_84620 | Human | Colorectum | MSS | 3.68e-07 | -3.66e-01 | 0.3005 |
| 84062 | DTNBP1 | A002-C-010 | Human | Colorectum | FAP | 2.11e-03 | -2.01e-01 | 0.242 |
| 84062 | DTNBP1 | A015-C-203 | Human | Colorectum | FAP | 2.04e-30 | -5.50e-01 | -0.1294 |
| 84062 | DTNBP1 | A015-C-204 | Human | Colorectum | FAP | 4.68e-08 | -4.42e-01 | -0.0228 |
| 84062 | DTNBP1 | A014-C-040 | Human | Colorectum | FAP | 2.72e-07 | -6.37e-01 | -0.1184 |
| 84062 | DTNBP1 | A002-C-201 | Human | Colorectum | FAP | 1.01e-11 | -4.06e-01 | 0.0324 |
| 84062 | DTNBP1 | A002-C-203 | Human | Colorectum | FAP | 3.99e-08 | -2.49e-01 | 0.2786 |
| 84062 | DTNBP1 | A001-C-119 | Human | Colorectum | FAP | 8.09e-08 | -4.60e-01 | -0.1557 |
| 84062 | DTNBP1 | A001-C-108 | Human | Colorectum | FAP | 4.96e-23 | -4.76e-01 | -0.0272 |
| 84062 | DTNBP1 | A002-C-205 | Human | Colorectum | FAP | 2.86e-19 | -5.29e-01 | -0.1236 |
| 84062 | DTNBP1 | A001-C-104 | Human | Colorectum | FAP | 9.75e-07 | -3.22e-01 | 0.0184 |
| 84062 | DTNBP1 | A015-C-005 | Human | Colorectum | FAP | 4.64e-06 | -4.05e-01 | -0.0336 |
| 84062 | DTNBP1 | A015-C-006 | Human | Colorectum | FAP | 5.98e-14 | -5.50e-01 | -0.0994 |
| 84062 | DTNBP1 | A015-C-106 | Human | Colorectum | FAP | 8.12e-12 | -3.58e-01 | -0.0511 |
| 84062 | DTNBP1 | A002-C-114 | Human | Colorectum | FAP | 2.54e-13 | -4.65e-01 | -0.1561 |
| 84062 | DTNBP1 | A015-C-104 | Human | Colorectum | FAP | 3.38e-34 | -5.68e-01 | -0.1899 |
| 84062 | DTNBP1 | A001-C-014 | Human | Colorectum | FAP | 9.06e-15 | -4.07e-01 | 0.0135 |
| 84062 | DTNBP1 | A002-C-016 | Human | Colorectum | FAP | 2.10e-24 | -4.41e-01 | 0.0521 |
| 84062 | DTNBP1 | A015-C-002 | Human | Colorectum | FAP | 6.87e-08 | -3.95e-01 | -0.0763 |
| 84062 | DTNBP1 | A001-C-203 | Human | Colorectum | FAP | 4.90e-15 | -3.49e-01 | -0.0481 |
| Page: 1 2 3 4 5 6 |
| Tissue | Expression Dynamics | Abbreviation |
| Colorectum (GSE201348) |  | FAP: Familial adenomatous polyposis |
| CRC: Colorectal cancer | ||
| Colorectum (HTA11) | 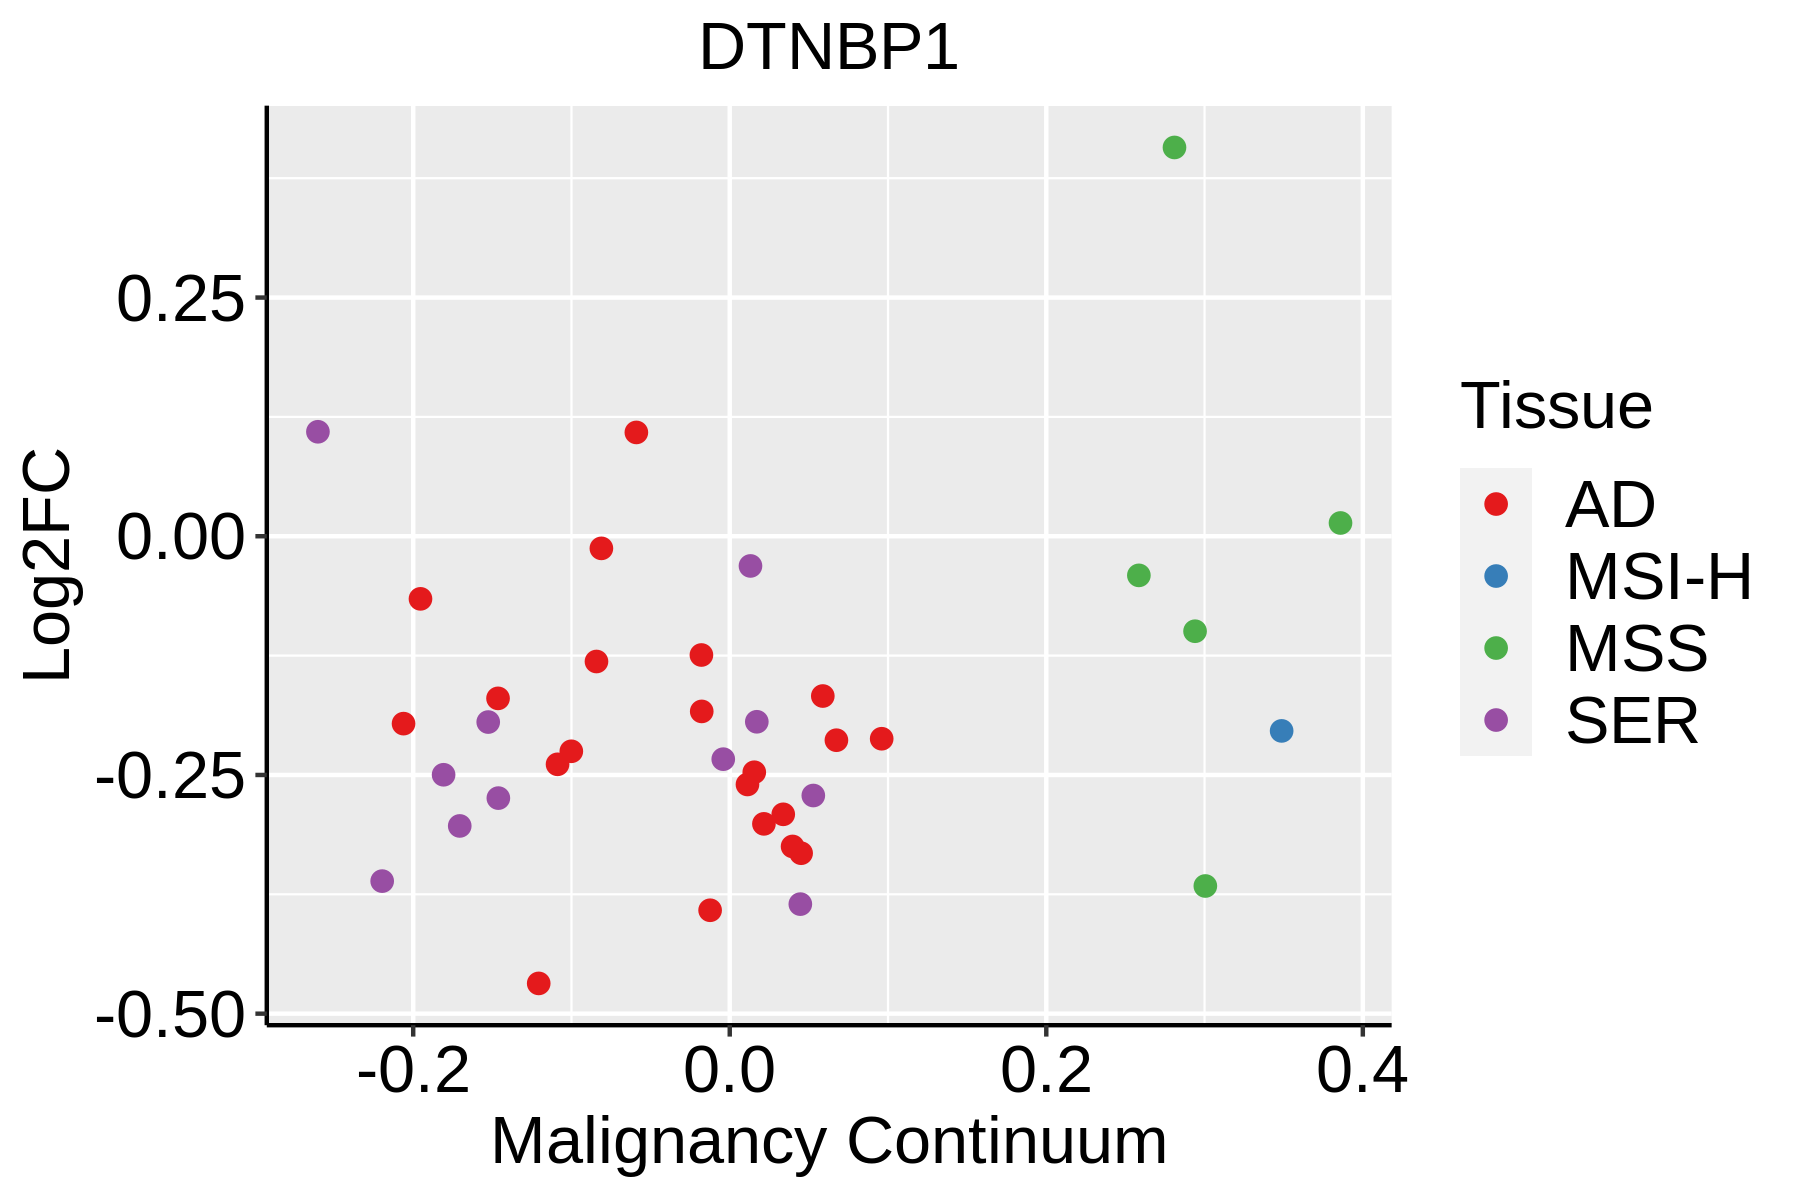 | AD: Adenomas |
| SER: Sessile serrated lesions | ||
| MSI-H: Microsatellite-high colorectal cancer | ||
| MSS: Microsatellite stable colorectal cancer | ||
| Esophagus |  | ESCC: Esophageal squamous cell carcinoma |
| HGIN: High-grade intraepithelial neoplasias | ||
| LGIN: Low-grade intraepithelial neoplasias | ||
| Oral Cavity | 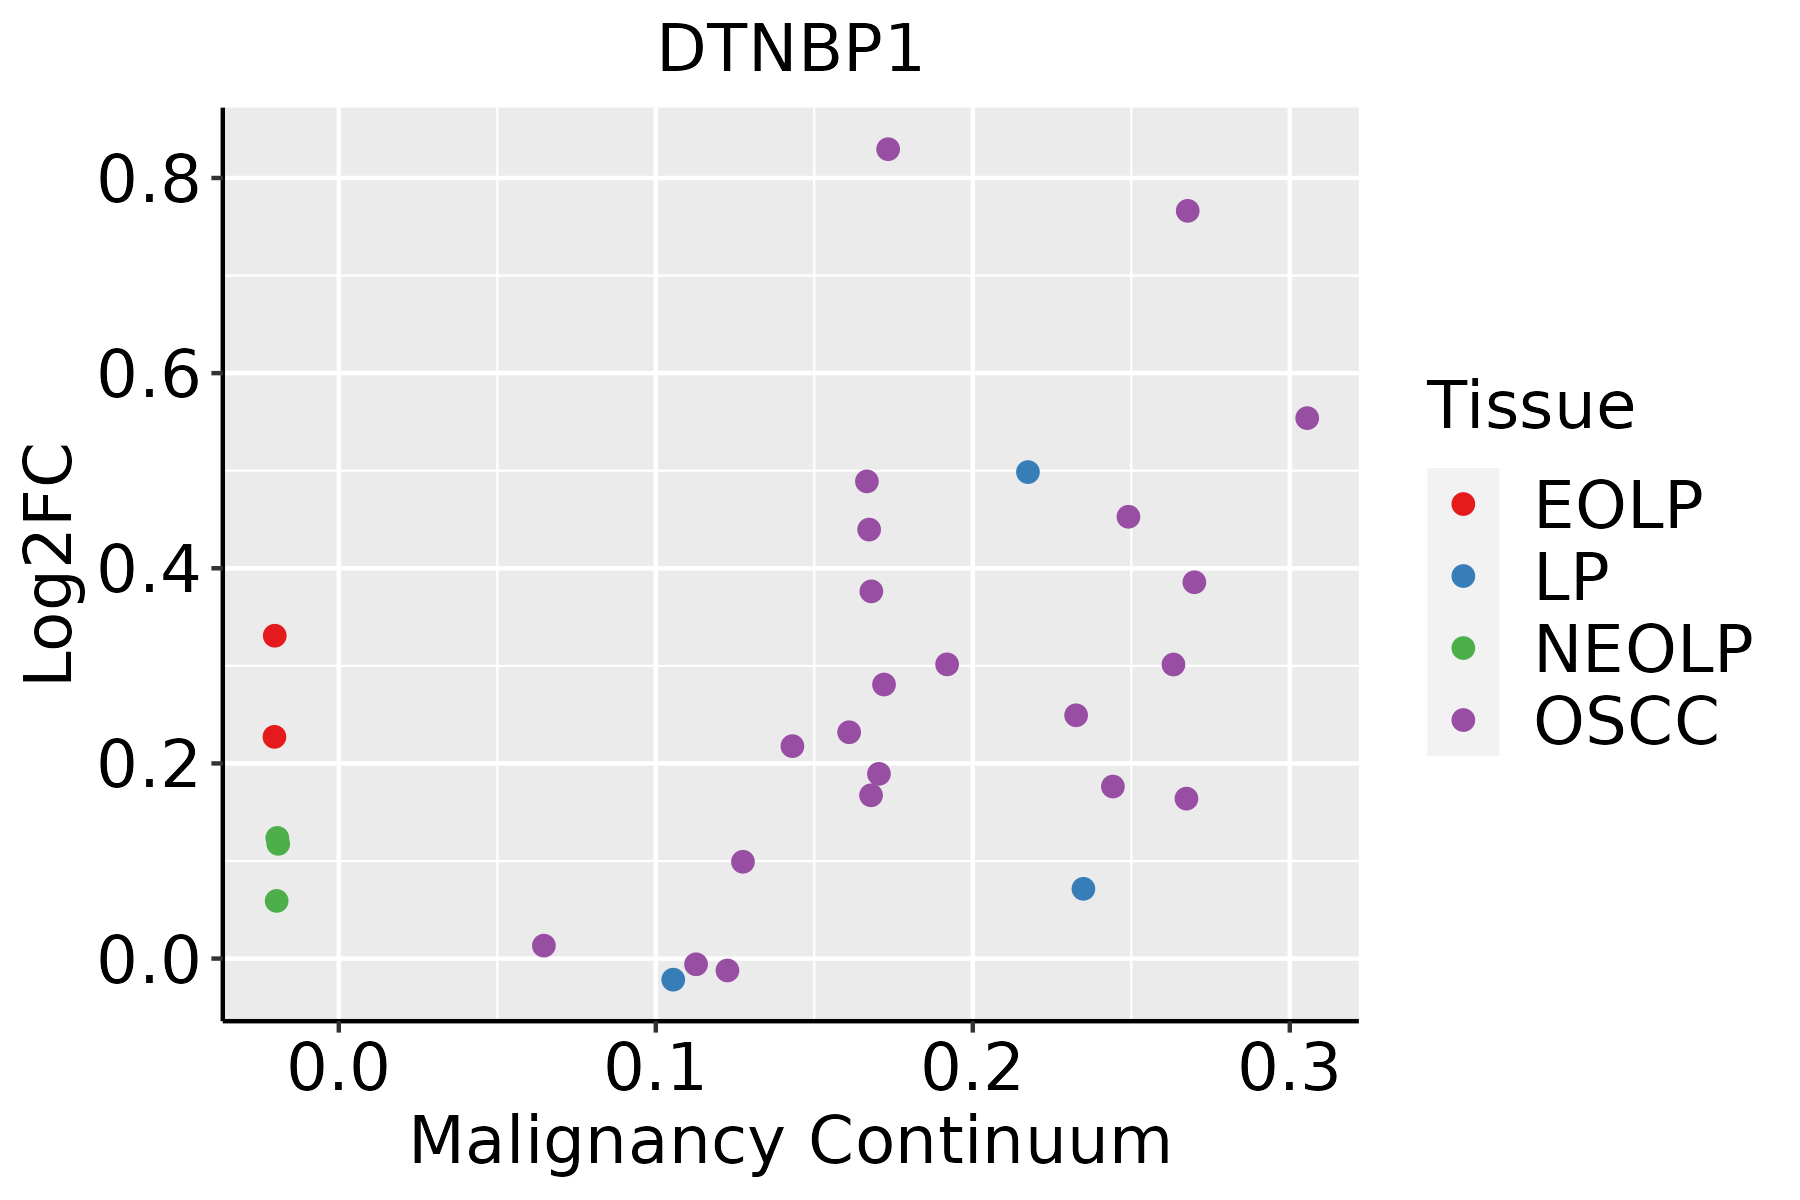 | EOLP: Erosive Oral lichen planus |
| LP: leukoplakia | ||
| NEOLP: Non-erosive oral lichen planus | ||
| OSCC: Oral squamous cell carcinoma |
| ∗log2FC in expression of this searched gene in stem-like cells from each diseased tissue sample relative to stem-like cells in normal samples in each tissue plotted against the malignancy continuum. Samples are colored based on if they are from different disease stage. |
Top |
Malignant transformation related pathway analysis |
| Find out the enriched GO biological processes and KEGG pathways involved in transition from healthy to precancer to cancer |
| Tissue | Disease Stage | Enriched GO biological Processes |
| Colorectum | AD |  |
| Colorectum | SER |  |
| Colorectum | MSS |  |
| Colorectum | MSI-H |  |
| Colorectum | FAP |  |
| ∗Top 15 enriched GO BP terms are showed in the bar plot of each disease state in each tissue. Each row represents a significant GO biological process which is colored according to the -log10(p.adjust). |
| Page: 1 2 3 4 5 6 7 8 9 |
| GO ID | Tissue | Disease Stage | Description | Gene Ratio | Bg Ratio | pvalue | p.adjust | Count |
| GO:00510982 | Colorectum | MSS | regulation of binding | 113/3467 | 363/18723 | 3.55e-09 | 2.41e-07 | 113 |
| GO:00516562 | Colorectum | MSS | establishment of organelle localization | 115/3467 | 390/18723 | 7.30e-08 | 3.67e-06 | 115 |
| GO:00160502 | Colorectum | MSS | vesicle organization | 93/3467 | 300/18723 | 1.04e-07 | 4.97e-06 | 93 |
| GO:00420602 | Colorectum | MSS | wound healing | 119/3467 | 422/18723 | 5.93e-07 | 2.24e-05 | 119 |
| GO:00315322 | Colorectum | MSS | actin cytoskeleton reorganization | 41/3467 | 107/18723 | 1.21e-06 | 4.06e-05 | 41 |
| GO:00513482 | Colorectum | MSS | negative regulation of transferase activity | 80/3467 | 268/18723 | 4.06e-06 | 1.17e-04 | 80 |
| GO:00433932 | Colorectum | MSS | regulation of protein binding | 62/3467 | 196/18723 | 6.44e-06 | 1.69e-04 | 62 |
| GO:00105632 | Colorectum | MSS | negative regulation of phosphorus metabolic process | 118/3467 | 442/18723 | 1.18e-05 | 2.77e-04 | 118 |
| GO:00459362 | Colorectum | MSS | negative regulation of phosphate metabolic process | 117/3467 | 441/18723 | 1.74e-05 | 3.84e-04 | 117 |
| GO:00423262 | Colorectum | MSS | negative regulation of phosphorylation | 103/3467 | 385/18723 | 3.76e-05 | 7.17e-04 | 103 |
| GO:00516502 | Colorectum | MSS | establishment of vesicle localization | 51/3467 | 161/18723 | 3.92e-05 | 7.45e-04 | 51 |
| GO:00019332 | Colorectum | MSS | negative regulation of protein phosphorylation | 93/3467 | 342/18723 | 4.54e-05 | 8.35e-04 | 93 |
| GO:00508782 | Colorectum | MSS | regulation of body fluid levels | 99/3467 | 379/18723 | 1.40e-04 | 2.07e-03 | 99 |
| GO:00516482 | Colorectum | MSS | vesicle localization | 53/3467 | 177/18723 | 1.47e-04 | 2.16e-03 | 53 |
| GO:00336732 | Colorectum | MSS | negative regulation of kinase activity | 66/3467 | 237/18723 | 2.63e-04 | 3.54e-03 | 66 |
| GO:00719002 | Colorectum | MSS | regulation of protein serine/threonine kinase activity | 93/3467 | 359/18723 | 2.98e-04 | 3.91e-03 | 93 |
| GO:00064692 | Colorectum | MSS | negative regulation of protein kinase activity | 60/3467 | 212/18723 | 3.08e-04 | 4.02e-03 | 60 |
| GO:19035321 | Colorectum | MSS | positive regulation of secretion by cell | 74/3467 | 282/18723 | 7.93e-04 | 8.36e-03 | 74 |
| GO:00510472 | Colorectum | MSS | positive regulation of secretion | 80/3467 | 310/18723 | 8.55e-04 | 8.75e-03 | 80 |
| GO:00163582 | Colorectum | MSS | dendrite development | 65/3467 | 243/18723 | 9.41e-04 | 9.50e-03 | 65 |
| Page: 1 2 3 4 5 6 7 8 9 10 11 12 |
| Pathway ID | Tissue | Disease Stage | Description | Gene Ratio | Bg Ratio | pvalue | p.adjust | qvalue | Count |
| Page: 1 |
Top |
Cell-cell communication analysis |
| Identification of potential cell-cell interactions between two cell types and their ligand-receptor pairs for different disease states |
| Ligand | Receptor | LRpair | Pathway | Tissue | Disease Stage |
| Page: 1 |
Top |
Single-cell gene regulatory network inference analysis |
| Find out the significant the regulons (TFs) and the target genes of each regulon across cell types for different disease states |
| TF | Cell Type | Tissue | Disease Stage | Target Gene | RSS | Regulon Activity |
| ∗The dot plots of a searched regulon are shown for all cell subpopulations in each disease state of each tissue based on the regulon specific score inferred using pySCENIC and by calculating the average expression. |
| Page: 1 |
Top |
Somatic mutation of malignant transformation related genes |
| Annotation of somatic variants for genes involved in malignant transformation |
| Hugo Symbol | Variant Class | Variant Classification | dbSNP RS | HGVSc | HGVSp | HGVSp Short | SWISSPROT | BIOTYPE | SIFT | PolyPhen | Tumor Sample Barcode | Tissue | Histology | Sex | Age | Stage | Therapy Types | Drugs | Outcome |
| DTNBP1 | SNV | Missense_Mutation | novel | c.469A>G | p.Asn157Asp | p.N157D | Q96EV8 | protein_coding | tolerated(0.35) | benign(0.001) | TCGA-AN-A046-01 | Breast | breast invasive carcinoma | Female | >=65 | I/II | Unknown | Unknown | SD |
| DTNBP1 | deletion | Frame_Shift_Del | novel | c.597delN | p.Phe199LeufsTer27 | p.F199Lfs*27 | Q96EV8 | protein_coding | TCGA-D8-A27V-01 | Breast | breast invasive carcinoma | Female | <65 | I/II | Hormone Therapy | tamoxiphen | SD | ||
| DTNBP1 | SNV | Missense_Mutation | rs75704383 | c.532N>A | p.Ala178Thr | p.A178T | Q96EV8 | protein_coding | tolerated(0.52) | benign(0.005) | TCGA-AA-3715-01 | Colorectum | colon adenocarcinoma | Male | >=65 | I/II | Unknown | Unknown | PD |
| DTNBP1 | SNV | Missense_Mutation | c.955N>C | p.Val319Leu | p.V319L | Q96EV8 | protein_coding | deleterious(0) | benign(0.187) | TCGA-NH-A8F7-06 | Colorectum | NA | NA | NA | NA | NA | NA | NA | |
| DTNBP1 | SNV | Missense_Mutation | novel | c.400N>T | p.His134Tyr | p.H134Y | Q96EV8 | protein_coding | tolerated(1) | benign(0) | TCGA-A5-A0G1-01 | Endometrium | uterine corpus endometrioid carcinoma | Female | >=65 | I/II | Unknown | Unknown | SD |
| DTNBP1 | SNV | Missense_Mutation | novel | c.1046N>A | p.Ser349Asn | p.S349N | Q96EV8 | protein_coding | deleterious_low_confidence(0) | probably_damaging(0.986) | TCGA-A5-A1OF-01 | Endometrium | uterine corpus endometrioid carcinoma | Female | <65 | I/II | Unknown | Unknown | SD |
| DTNBP1 | SNV | Missense_Mutation | rs774300249 | c.325G>A | p.Ala109Thr | p.A109T | Q96EV8 | protein_coding | tolerated(0.35) | benign(0.215) | TCGA-AJ-A3EK-01 | Endometrium | uterine corpus endometrioid carcinoma | Female | <65 | I/II | Chemotherapy | carboplatin | CR |
| DTNBP1 | SNV | Missense_Mutation | rs781381233 | c.887C>T | p.Pro296Leu | p.P296L | Q96EV8 | protein_coding | tolerated(0.18) | benign(0.183) | TCGA-AJ-A3EL-01 | Endometrium | uterine corpus endometrioid carcinoma | Female | <65 | I/II | Unknown | Unknown | SD |
| DTNBP1 | SNV | Missense_Mutation | novel | c.788N>G | p.Asn263Ser | p.N263S | Q96EV8 | protein_coding | tolerated(0.5) | benign(0.07) | TCGA-AP-A0LM-01 | Endometrium | uterine corpus endometrioid carcinoma | Female | <65 | III/IV | Chemotherapy | cisplatin | SD |
| DTNBP1 | SNV | Missense_Mutation | c.295G>A | p.Glu99Lys | p.E99K | Q96EV8 | protein_coding | tolerated(0.05) | benign(0.053) | TCGA-AX-A05Z-01 | Endometrium | uterine corpus endometrioid carcinoma | Female | <65 | III/IV | Chemotherapy | adriamycin | SD |
| Page: 1 2 3 |
Top |
Related drugs of malignant transformation related genes |
| Identification of chemicals and drugs interact with genes involved in malignant transfromation |
| (DGIdb 4.0) |
| Entrez ID | Symbol | Category | Interaction Types | Drug Claim Name | Drug Name | PMIDs |
| 84062 | DTNBP1 | KINASE | methamphetamine | METHAMPHETAMINE | 17555717 | |
| 84062 | DTNBP1 | KINASE | citalopram | CITALOPRAM | 19065121 | |
| 84062 | DTNBP1 | KINASE | corticosteroids | 30697902 | ||
| 84062 | DTNBP1 | KINASE | haloperidol | HALOPERIDOL | 27023437 | |
| 84062 | DTNBP1 | KINASE | clozapine | CLOZAPINE |
| Page: 1 |

Copyright 2023-Present -The University of Texas Health Science Center at Houston |