
|
|||||
|
 | |
| |
| |
| |
| |
| |
|
Gene: DTNB |
Gene summary for DTNB |
| Gene information | Species | Human | Gene symbol | DTNB | Gene ID | 1838 |
| Gene name | dystrobrevin beta | |
| Gene Alias | DTNB | |
| Cytomap | 2p23.3 | |
| Gene Type | protein-coding | GO ID | GO:0007154 | UniProtAcc | B7Z6A9 |
Top |
Malignant transformation analysis |
| Identification of the aberrant gene expression in precancerous and cancerous lesions by comparing the gene expression of stem-like cells in diseased tissues with normal stem cells |
| Entrez ID | Symbol | Replicates | Species | Organ | Tissue | Adj P-value | Log2FC | Malignancy |
| 1838 | DTNB | CCI_1 | Human | Cervix | CC | 2.55e-08 | 7.56e-01 | 0.528 |
| 1838 | DTNB | CCI_2 | Human | Cervix | CC | 1.42e-16 | 1.28e+00 | 0.5249 |
| 1838 | DTNB | CCI_3 | Human | Cervix | CC | 1.36e-19 | 9.50e-01 | 0.516 |
| 1838 | DTNB | AEH-subject1 | Human | Endometrium | AEH | 2.64e-19 | 5.00e-01 | -0.3059 |
| 1838 | DTNB | AEH-subject2 | Human | Endometrium | AEH | 1.11e-08 | 3.95e-01 | -0.2525 |
| 1838 | DTNB | AEH-subject3 | Human | Endometrium | AEH | 5.32e-13 | 4.59e-01 | -0.2576 |
| 1838 | DTNB | AEH-subject4 | Human | Endometrium | AEH | 7.49e-04 | 3.11e-01 | -0.2657 |
| 1838 | DTNB | AEH-subject5 | Human | Endometrium | AEH | 7.50e-20 | 6.05e-01 | -0.2953 |
| 1838 | DTNB | EEC-subject1 | Human | Endometrium | EEC | 6.48e-16 | 5.51e-01 | -0.2682 |
| 1838 | DTNB | EEC-subject2 | Human | Endometrium | EEC | 6.48e-22 | 5.70e-01 | -0.2607 |
| 1838 | DTNB | EEC-subject4 | Human | Endometrium | EEC | 1.05e-21 | 6.43e-01 | -0.2571 |
| 1838 | DTNB | EEC-subject5 | Human | Endometrium | EEC | 1.01e-12 | 4.14e-01 | -0.249 |
| 1838 | DTNB | GSM6177620_NYU_UCEC1_lib3_lib3 | Human | Endometrium | EEC | 3.93e-02 | -1.03e-02 | -0.1883 |
| 1838 | DTNB | LZE4T | Human | Esophagus | ESCC | 3.67e-14 | 2.94e-01 | 0.0811 |
| 1838 | DTNB | LZE7T | Human | Esophagus | ESCC | 2.86e-02 | 1.09e-01 | 0.0667 |
| 1838 | DTNB | LZE20T | Human | Esophagus | ESCC | 8.11e-04 | 5.59e-02 | 0.0662 |
| 1838 | DTNB | LZE22T | Human | Esophagus | ESCC | 2.13e-03 | 2.49e-01 | 0.068 |
| 1838 | DTNB | LZE24T | Human | Esophagus | ESCC | 1.26e-15 | 2.25e-01 | 0.0596 |
| 1838 | DTNB | LZE21T | Human | Esophagus | ESCC | 2.75e-02 | 2.13e-01 | 0.0655 |
| 1838 | DTNB | P1T-E | Human | Esophagus | ESCC | 1.17e-04 | 1.91e-01 | 0.0875 |
| Page: 1 2 3 4 5 6 7 |
| Tissue | Expression Dynamics | Abbreviation |
| Cervix | 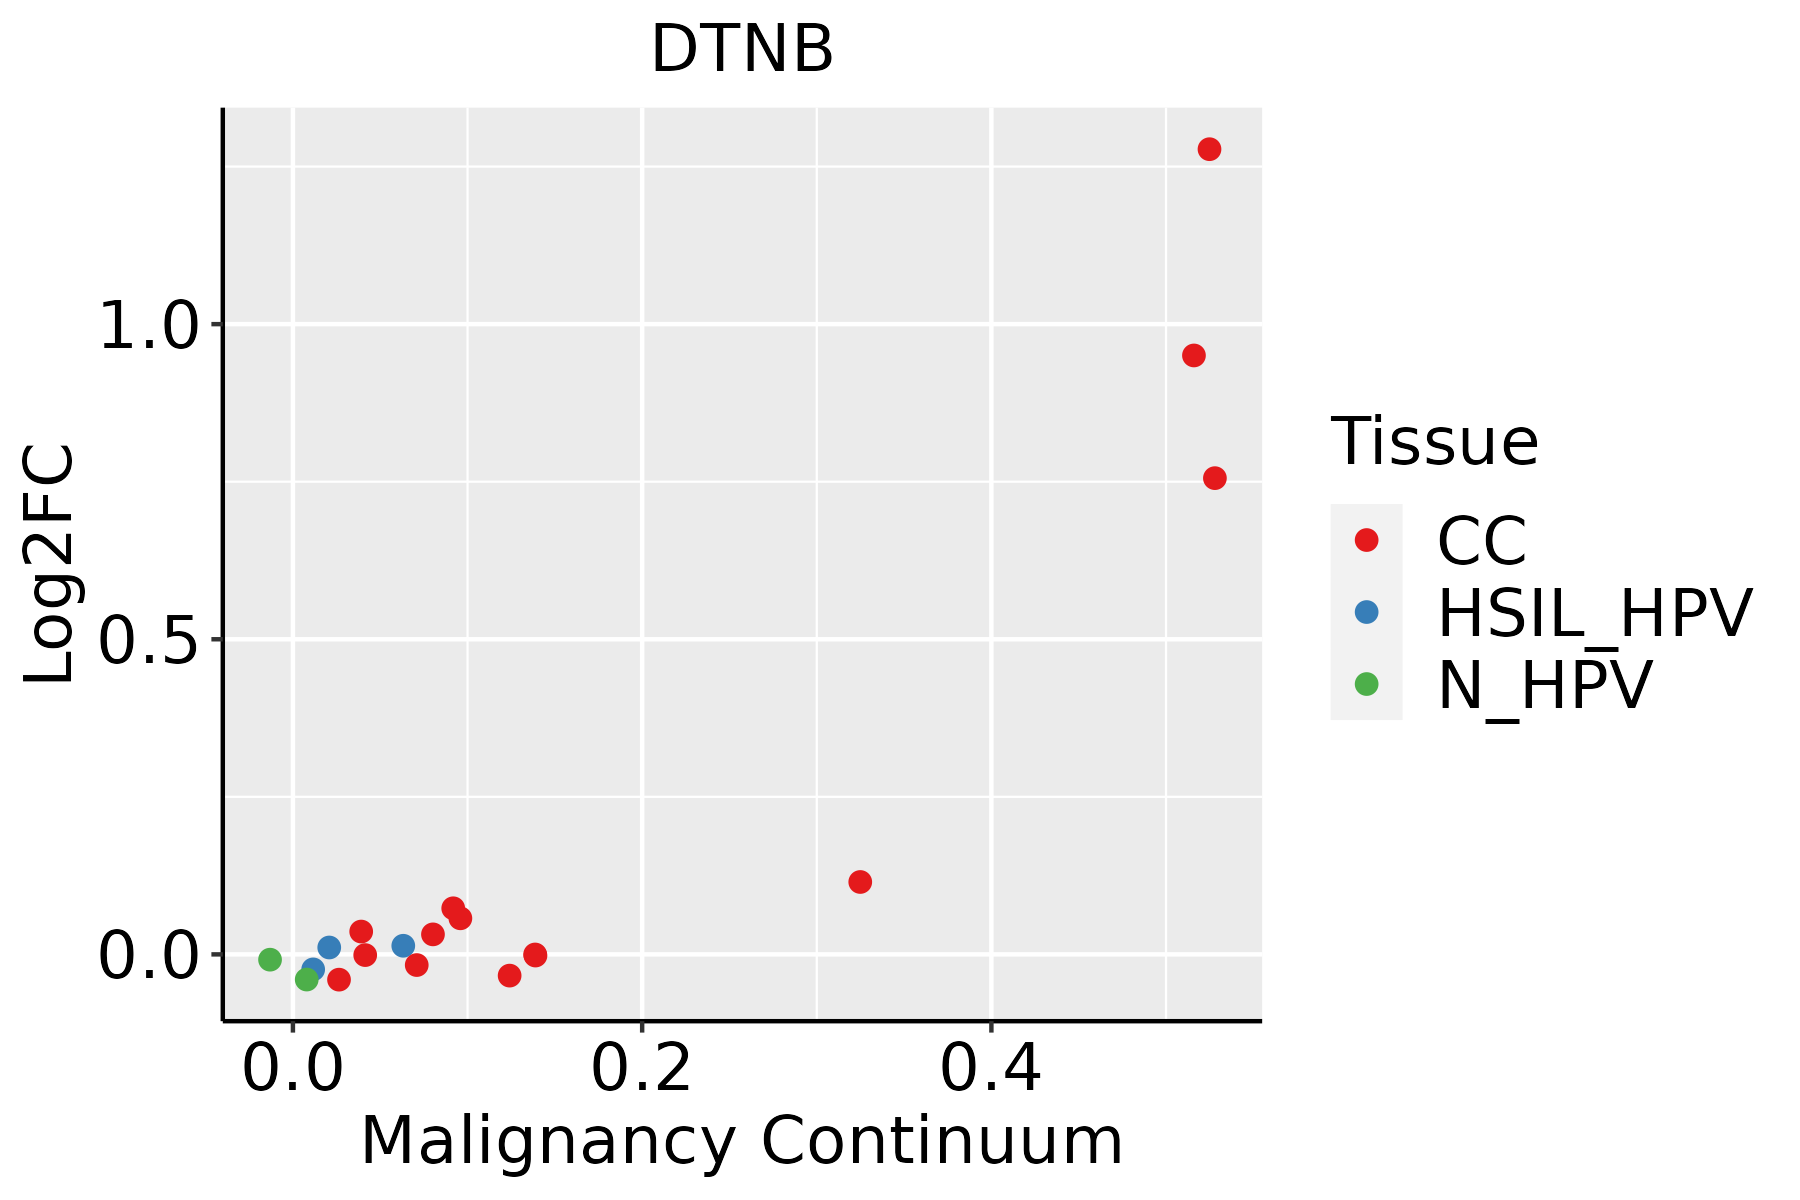 | CC: Cervix cancer |
| HSIL_HPV: HPV-infected high-grade squamous intraepithelial lesions | ||
| N_HPV: HPV-infected normal cervix | ||
| Endometrium | 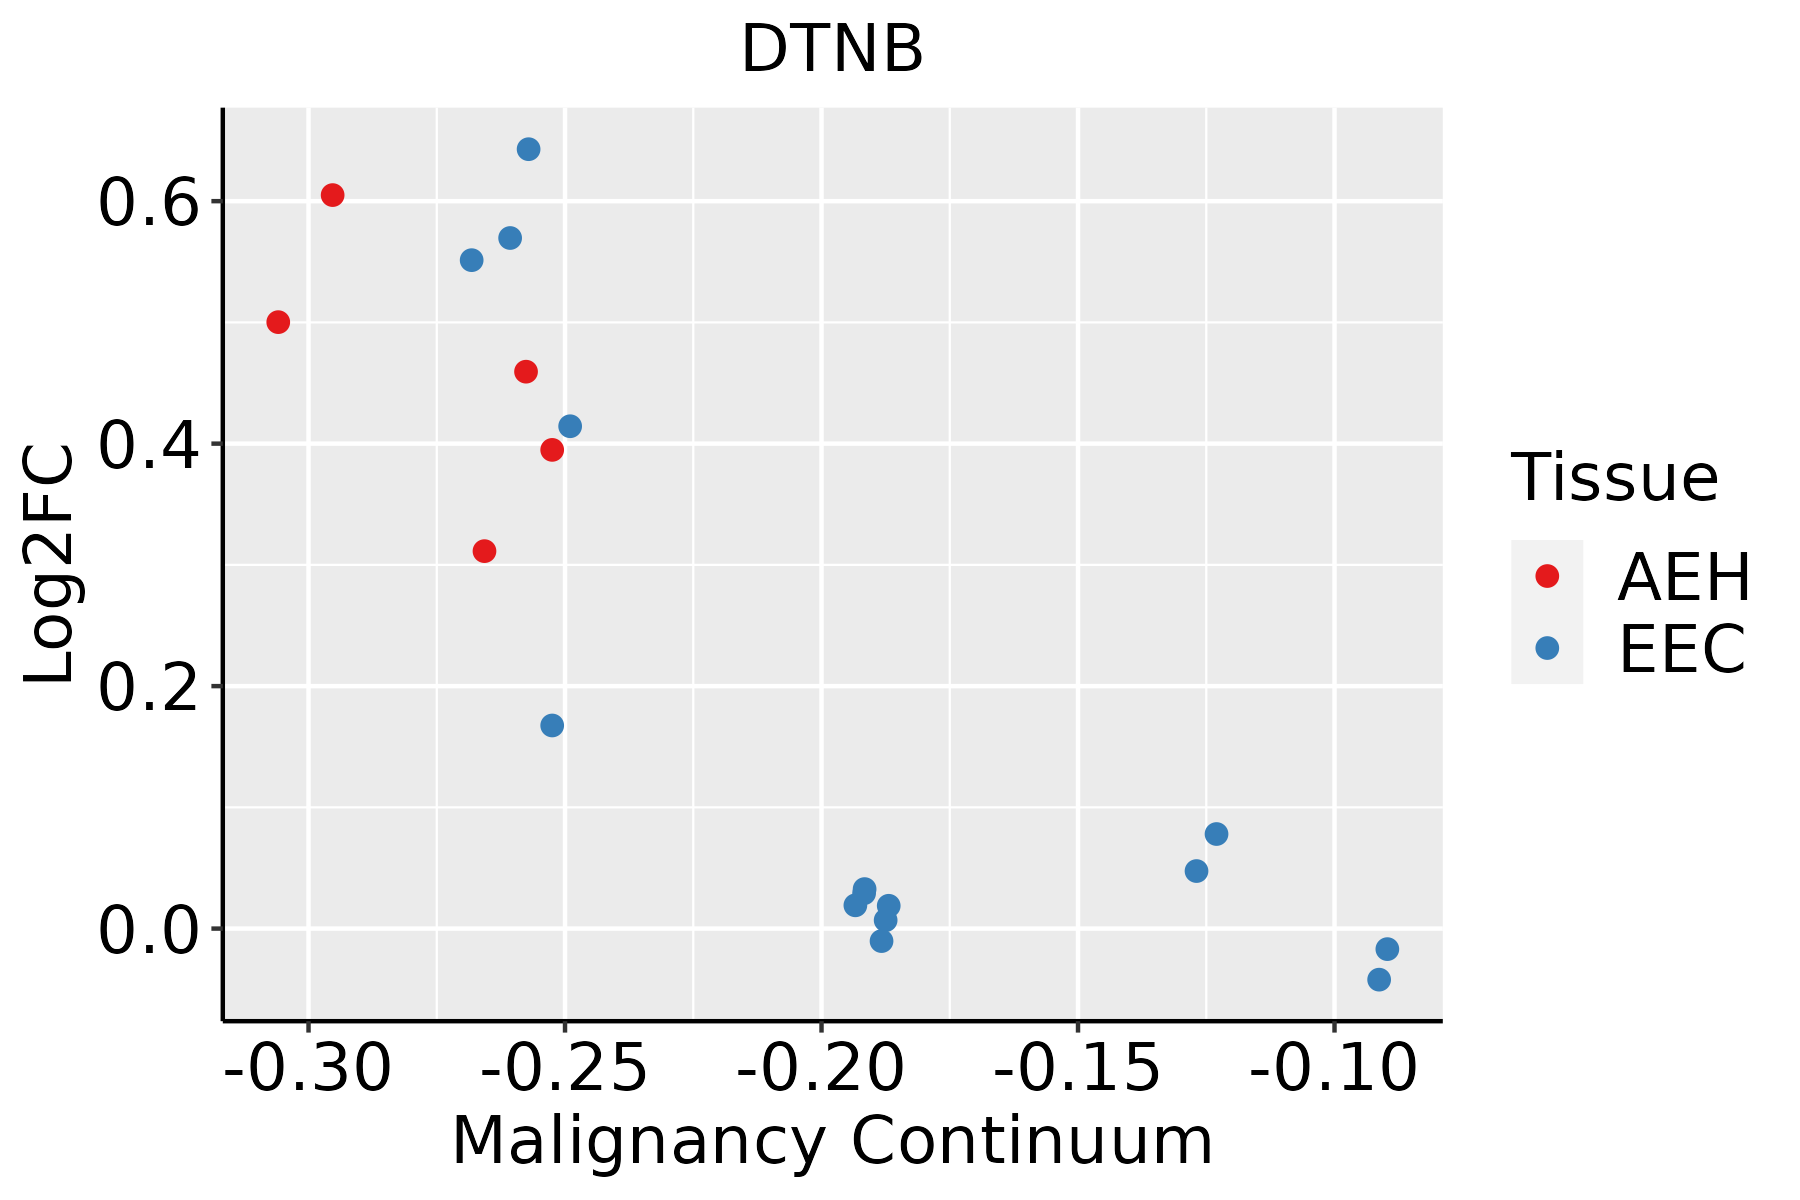 | AEH: Atypical endometrial hyperplasia |
| EEC: Endometrioid Cancer | ||
| Esophagus | 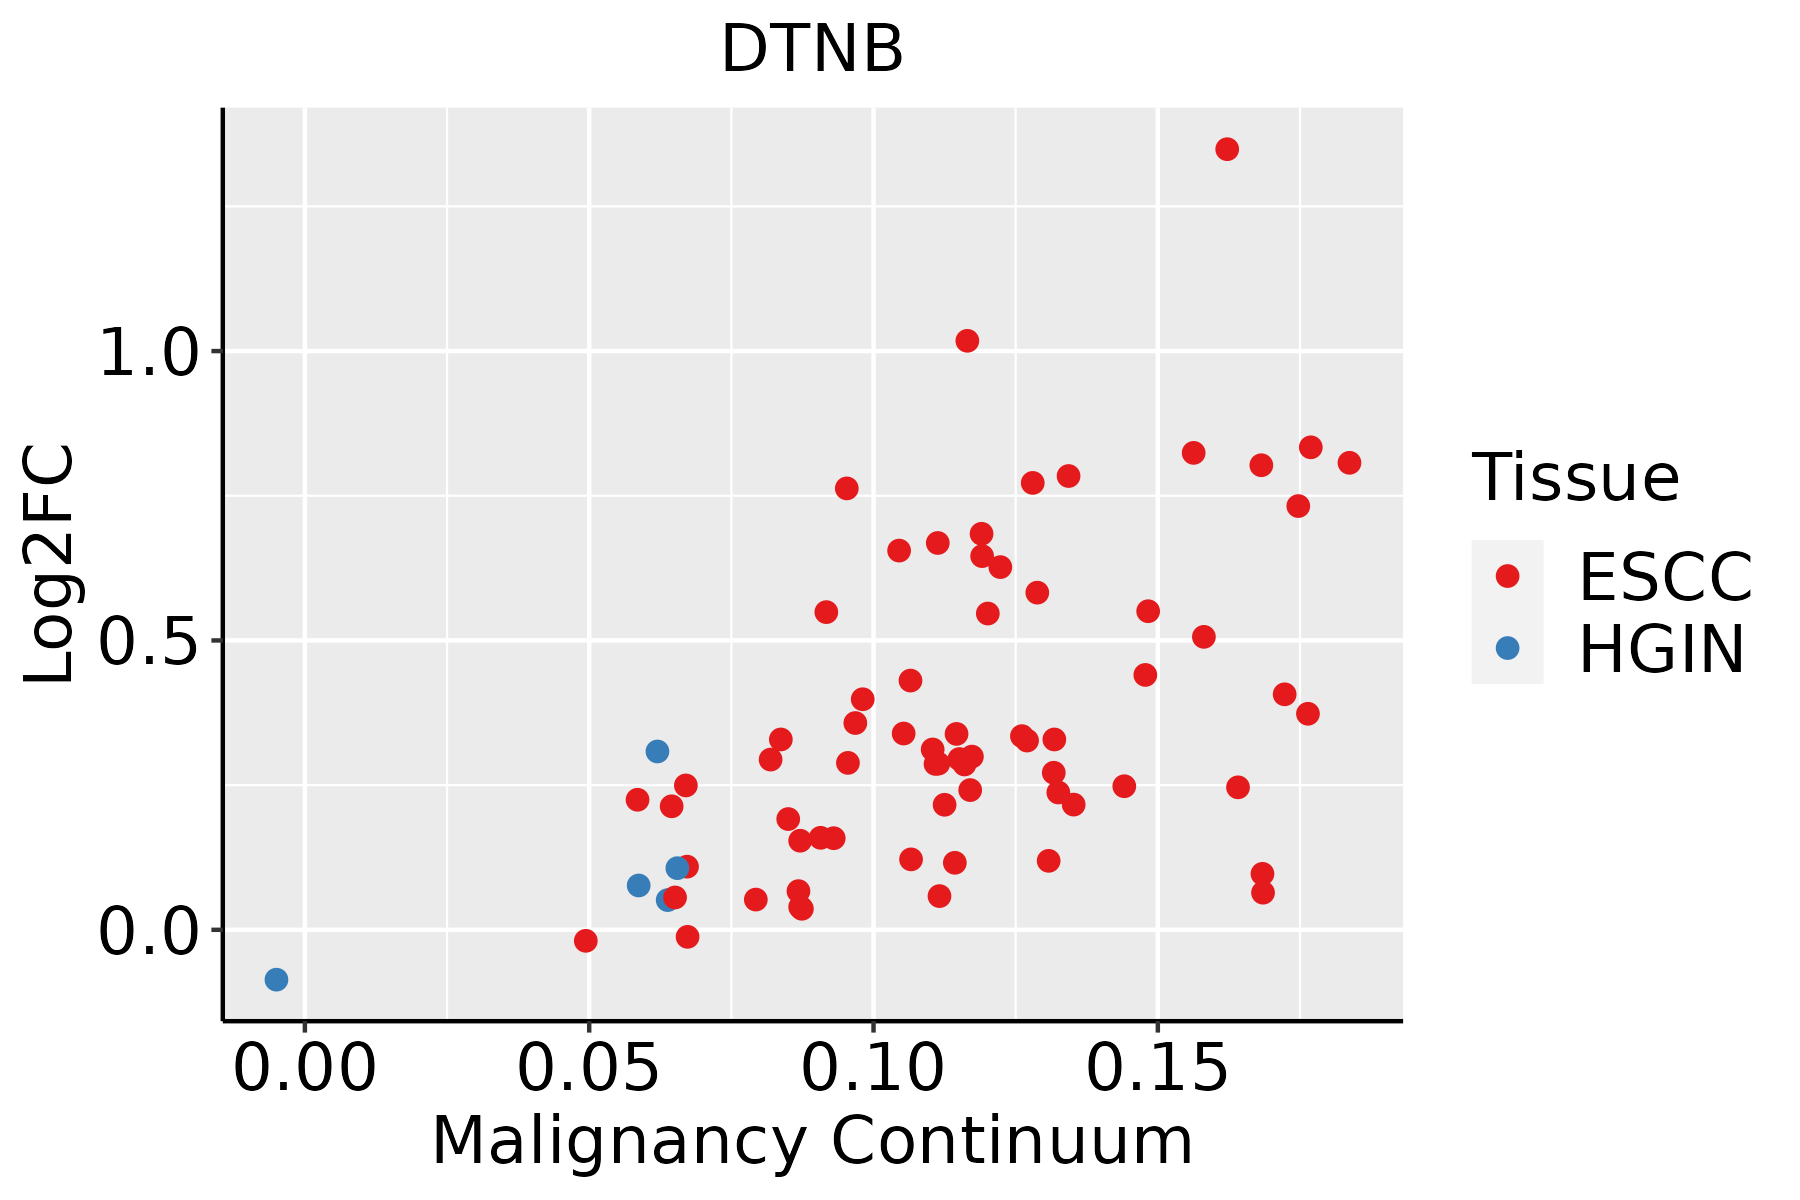 | ESCC: Esophageal squamous cell carcinoma |
| HGIN: High-grade intraepithelial neoplasias | ||
| LGIN: Low-grade intraepithelial neoplasias | ||
| Liver | 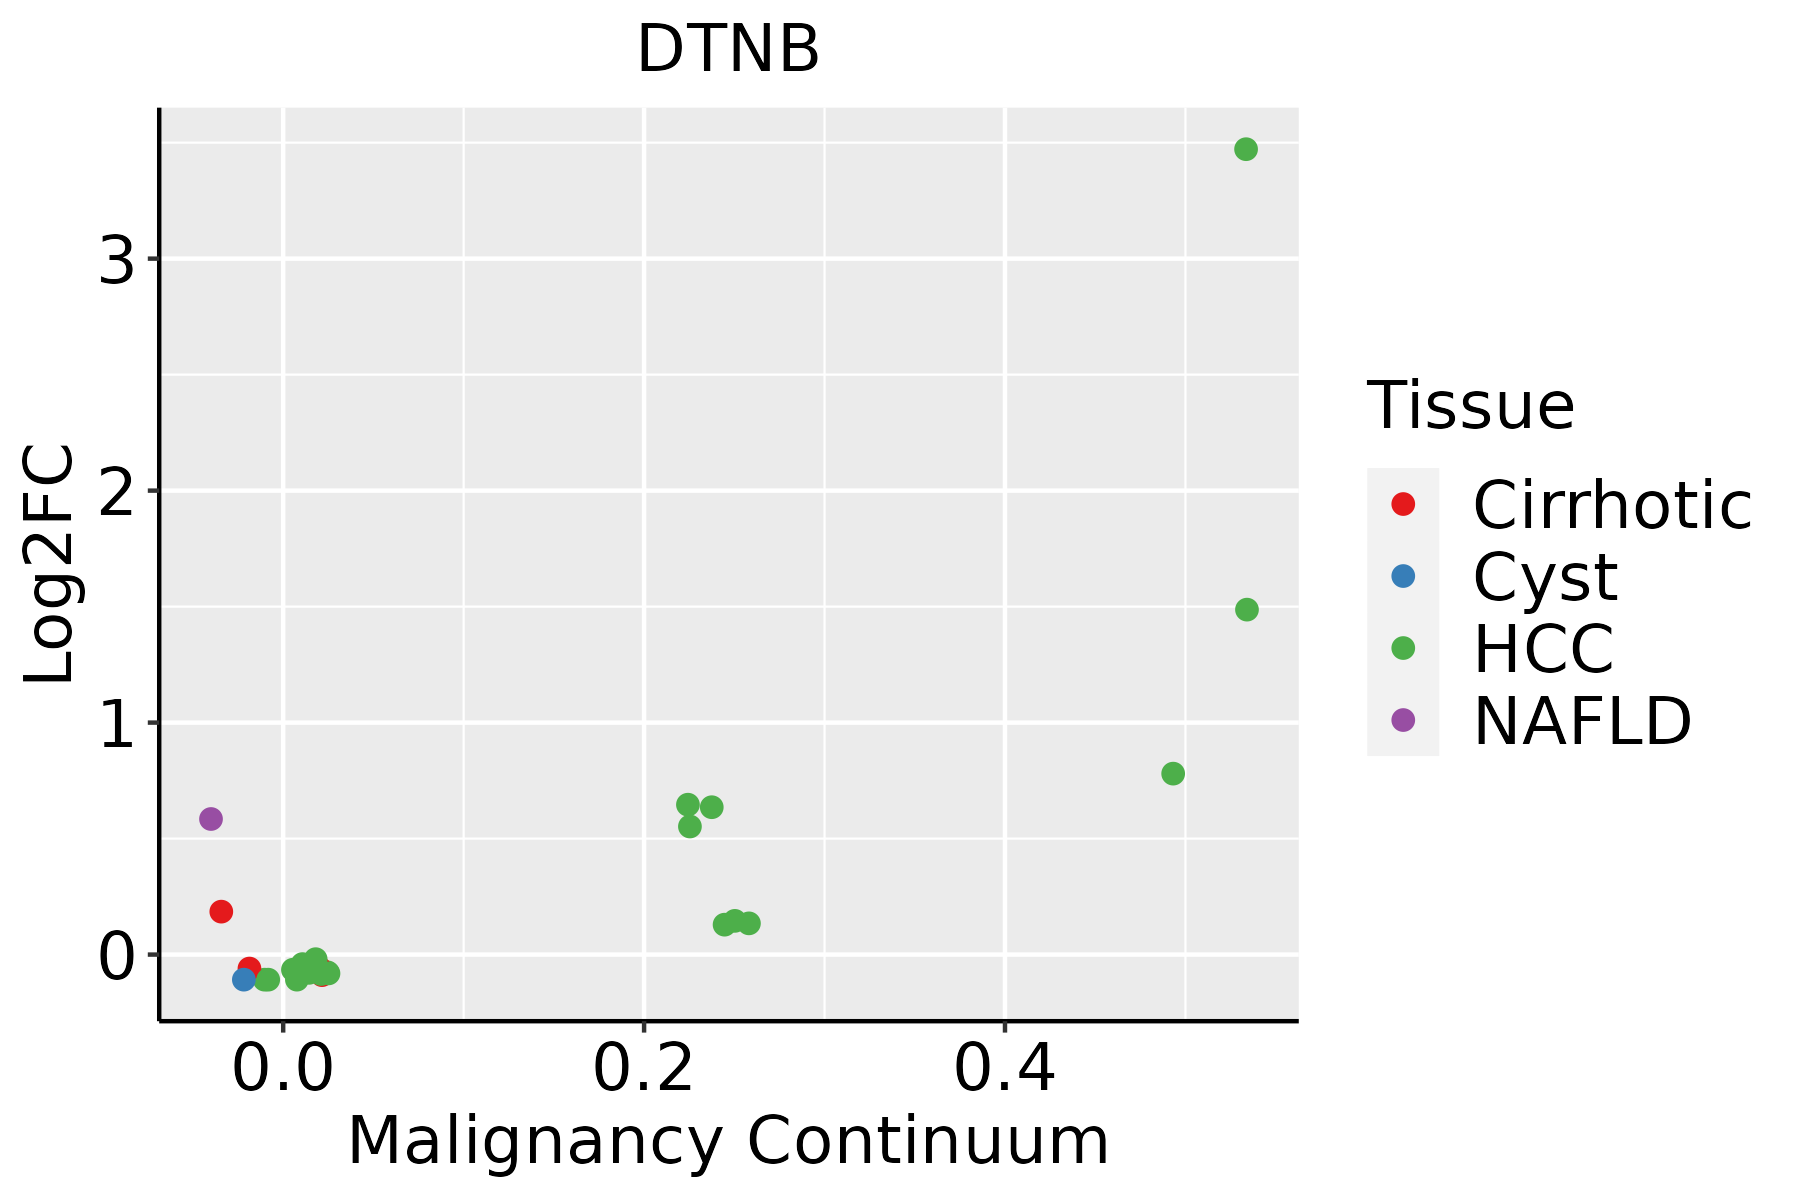 | HCC: Hepatocellular carcinoma |
| NAFLD: Non-alcoholic fatty liver disease | ||
| Lung |  | AAH: Atypical adenomatous hyperplasia |
| AIS: Adenocarcinoma in situ | ||
| IAC: Invasive lung adenocarcinoma | ||
| MIA: Minimally invasive adenocarcinoma | ||
| Oral Cavity |  | EOLP: Erosive Oral lichen planus |
| LP: leukoplakia | ||
| NEOLP: Non-erosive oral lichen planus | ||
| OSCC: Oral squamous cell carcinoma | ||
| Prostate | 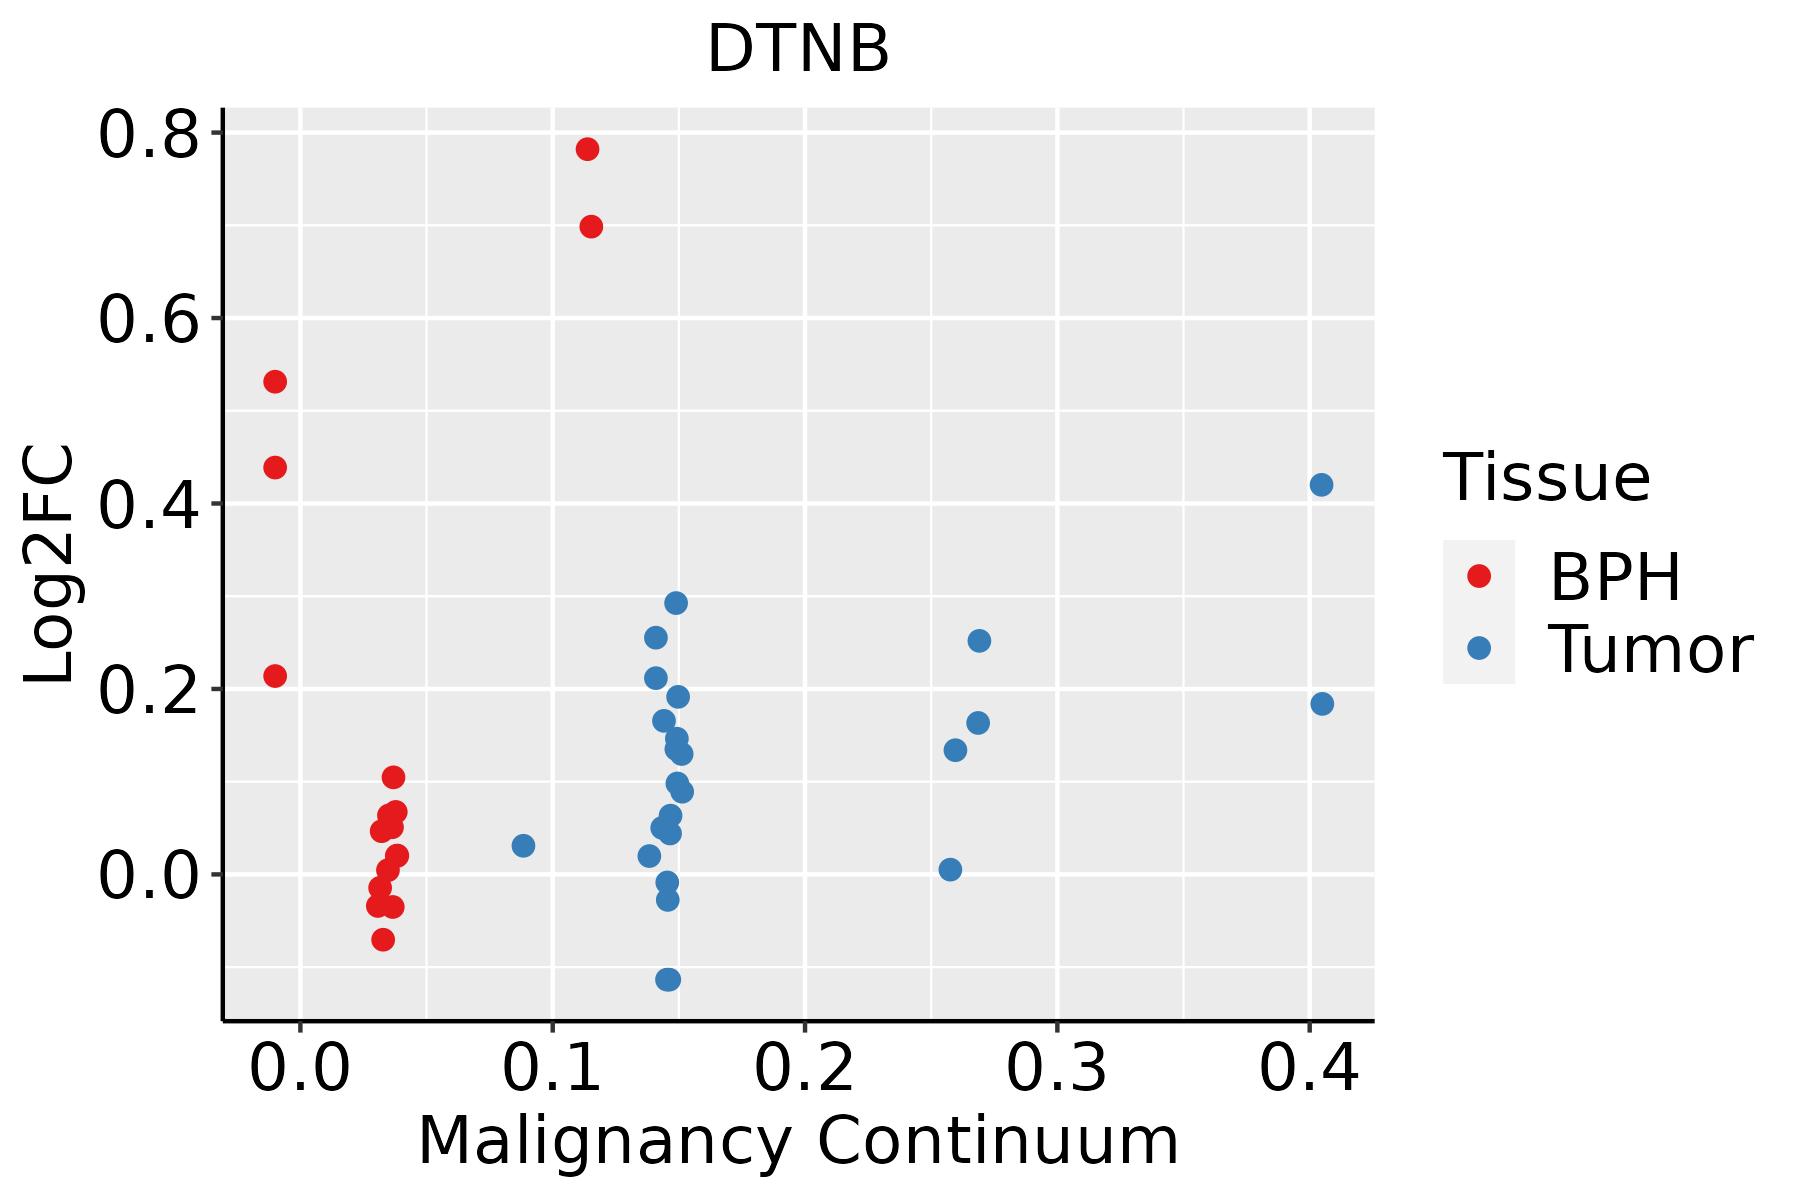 | BPH: Benign Prostatic Hyperplasia |
| ∗log2FC in expression of this searched gene in stem-like cells from each diseased tissue sample relative to stem-like cells in normal samples in each tissue plotted against the malignancy continuum. Samples are colored based on if they are from different disease stage. |
Top |
Malignant transformation related pathway analysis |
| Find out the enriched GO biological processes and KEGG pathways involved in transition from healthy to precancer to cancer |
| Tissue | Disease Stage | Enriched GO biological Processes |
| Colorectum | AD |  |
| Colorectum | SER |  |
| Colorectum | MSS |  |
| Colorectum | MSI-H |  |
| Colorectum | FAP |  |
| ∗Top 15 enriched GO BP terms are showed in the bar plot of each disease state in each tissue. Each row represents a significant GO biological process which is colored according to the -log10(p.adjust). |
| Page: 1 2 3 4 5 6 7 8 9 |
| GO ID | Tissue | Disease Stage | Description | Gene Ratio | Bg Ratio | pvalue | p.adjust | Count |
| GO:00510982 | Colorectum | MSS | regulation of binding | 113/3467 | 363/18723 | 3.55e-09 | 2.41e-07 | 113 |
| GO:00516562 | Colorectum | MSS | establishment of organelle localization | 115/3467 | 390/18723 | 7.30e-08 | 3.67e-06 | 115 |
| GO:00160502 | Colorectum | MSS | vesicle organization | 93/3467 | 300/18723 | 1.04e-07 | 4.97e-06 | 93 |
| GO:00420602 | Colorectum | MSS | wound healing | 119/3467 | 422/18723 | 5.93e-07 | 2.24e-05 | 119 |
| GO:00315322 | Colorectum | MSS | actin cytoskeleton reorganization | 41/3467 | 107/18723 | 1.21e-06 | 4.06e-05 | 41 |
| GO:00513482 | Colorectum | MSS | negative regulation of transferase activity | 80/3467 | 268/18723 | 4.06e-06 | 1.17e-04 | 80 |
| GO:00433932 | Colorectum | MSS | regulation of protein binding | 62/3467 | 196/18723 | 6.44e-06 | 1.69e-04 | 62 |
| GO:00105632 | Colorectum | MSS | negative regulation of phosphorus metabolic process | 118/3467 | 442/18723 | 1.18e-05 | 2.77e-04 | 118 |
| GO:00459362 | Colorectum | MSS | negative regulation of phosphate metabolic process | 117/3467 | 441/18723 | 1.74e-05 | 3.84e-04 | 117 |
| GO:00423262 | Colorectum | MSS | negative regulation of phosphorylation | 103/3467 | 385/18723 | 3.76e-05 | 7.17e-04 | 103 |
| GO:00516502 | Colorectum | MSS | establishment of vesicle localization | 51/3467 | 161/18723 | 3.92e-05 | 7.45e-04 | 51 |
| GO:00019332 | Colorectum | MSS | negative regulation of protein phosphorylation | 93/3467 | 342/18723 | 4.54e-05 | 8.35e-04 | 93 |
| GO:00508782 | Colorectum | MSS | regulation of body fluid levels | 99/3467 | 379/18723 | 1.40e-04 | 2.07e-03 | 99 |
| GO:00516482 | Colorectum | MSS | vesicle localization | 53/3467 | 177/18723 | 1.47e-04 | 2.16e-03 | 53 |
| GO:00336732 | Colorectum | MSS | negative regulation of kinase activity | 66/3467 | 237/18723 | 2.63e-04 | 3.54e-03 | 66 |
| GO:00719002 | Colorectum | MSS | regulation of protein serine/threonine kinase activity | 93/3467 | 359/18723 | 2.98e-04 | 3.91e-03 | 93 |
| GO:00064692 | Colorectum | MSS | negative regulation of protein kinase activity | 60/3467 | 212/18723 | 3.08e-04 | 4.02e-03 | 60 |
| GO:19035321 | Colorectum | MSS | positive regulation of secretion by cell | 74/3467 | 282/18723 | 7.93e-04 | 8.36e-03 | 74 |
| GO:00510472 | Colorectum | MSS | positive regulation of secretion | 80/3467 | 310/18723 | 8.55e-04 | 8.75e-03 | 80 |
| GO:00163582 | Colorectum | MSS | dendrite development | 65/3467 | 243/18723 | 9.41e-04 | 9.50e-03 | 65 |
| Page: 1 2 3 4 5 6 7 8 9 10 11 12 |
| Pathway ID | Tissue | Disease Stage | Description | Gene Ratio | Bg Ratio | pvalue | p.adjust | qvalue | Count |
| Page: 1 |
Top |
Cell-cell communication analysis |
| Identification of potential cell-cell interactions between two cell types and their ligand-receptor pairs for different disease states |
| Ligand | Receptor | LRpair | Pathway | Tissue | Disease Stage |
| Page: 1 |
Top |
Single-cell gene regulatory network inference analysis |
| Find out the significant the regulons (TFs) and the target genes of each regulon across cell types for different disease states |
| TF | Cell Type | Tissue | Disease Stage | Target Gene | RSS | Regulon Activity |
| ∗The dot plots of a searched regulon are shown for all cell subpopulations in each disease state of each tissue based on the regulon specific score inferred using pySCENIC and by calculating the average expression. |
| Page: 1 |
Top |
Somatic mutation of malignant transformation related genes |
| Annotation of somatic variants for genes involved in malignant transformation |
| Hugo Symbol | Variant Class | Variant Classification | dbSNP RS | HGVSc | HGVSp | HGVSp Short | SWISSPROT | BIOTYPE | SIFT | PolyPhen | Tumor Sample Barcode | Tissue | Histology | Sex | Age | Stage | Therapy Types | Drugs | Outcome |
| DTNB | SNV | Missense_Mutation | rs780542534 | c.1654N>C | p.Ser552Pro | p.S552P | O60941 | protein_coding | tolerated(0.1) | possibly_damaging(0.881) | TCGA-AN-A0FY-01 | Breast | breast invasive carcinoma | Female | <65 | I/II | Unknown | Unknown | SD |
| DTNB | SNV | Missense_Mutation | rs773532655 | c.148N>T | p.Leu50Phe | p.L50F | O60941 | protein_coding | deleterious(0.02) | possibly_damaging(0.603) | TCGA-EW-A1OZ-01 | Breast | breast invasive carcinoma | Female | <65 | I/II | Targeted Molecular therapy | trastuzumab | SD |
| DTNB | insertion | Nonsense_Mutation | novel | c.781_782insACTCGGGAGGCTGAGGCAGGAGAATGGCGTGAACCCGGGAGGTGGAG | p.Cys261TyrfsTer5 | p.C261Yfs*5 | O60941 | protein_coding | TCGA-B6-A0IA-01 | Breast | breast invasive carcinoma | Female | <65 | I/II | Unknown | Unknown | SD | ||
| DTNB | SNV | Missense_Mutation | rs749508731 | c.284N>A | p.Arg95His | p.R95H | O60941 | protein_coding | deleterious(0) | probably_damaging(0.988) | TCGA-EA-A3HU-01 | Cervix | cervical & endocervical cancer | Female | <65 | I/II | Unknown | Unknown | SD |
| DTNB | SNV | Missense_Mutation | c.917N>G | p.Ser306Cys | p.S306C | O60941 | protein_coding | deleterious(0) | probably_damaging(0.91) | TCGA-FU-A3EO-01 | Cervix | cervical & endocervical cancer | Female | <65 | I/II | Unknown | Unknown | SD | |
| DTNB | SNV | Missense_Mutation | c.1408G>C | p.Glu470Gln | p.E470Q | O60941 | protein_coding | tolerated(0.14) | benign(0.096) | TCGA-IR-A3LA-01 | Cervix | cervical & endocervical cancer | Female | <65 | I/II | Chemotherapy | cisplatin | CR | |
| DTNB | SNV | Missense_Mutation | c.1723G>T | p.Ala575Ser | p.A575S | O60941 | protein_coding | deleterious(0.03) | possibly_damaging(0.887) | TCGA-AA-3950-01 | Colorectum | colon adenocarcinoma | Female | >=65 | I/II | Unknown | Unknown | SD | |
| DTNB | SNV | Missense_Mutation | c.721G>A | p.Val241Met | p.V241M | O60941 | protein_coding | deleterious(0.03) | probably_damaging(0.988) | TCGA-AD-6895-01 | Colorectum | colon adenocarcinoma | Male | >=65 | III/IV | Unknown | Unknown | SD | |
| DTNB | SNV | Missense_Mutation | c.833G>A | p.Gly278Asp | p.G278D | O60941 | protein_coding | deleterious(0.03) | probably_damaging(0.986) | TCGA-AD-6964-01 | Colorectum | colon adenocarcinoma | Male | <65 | III/IV | Chemotherapy | folfox | PD | |
| DTNB | SNV | Missense_Mutation | novel | c.456N>A | p.Phe152Leu | p.F152L | O60941 | protein_coding | deleterious(0) | possibly_damaging(0.868) | TCGA-AZ-4315-01 | Colorectum | colon adenocarcinoma | Male | <65 | I/II | Unknown | Unknown | SD |
| Page: 1 2 3 4 5 6 7 |
Top |
Related drugs of malignant transformation related genes |
| Identification of chemicals and drugs interact with genes involved in malignant transfromation |
| (DGIdb 4.0) |
| Entrez ID | Symbol | Category | Interaction Types | Drug Claim Name | Drug Name | PMIDs |
| Page: 1 |

Copyright 2023-Present -The University of Texas Health Science Center at Houston |