
|
|||||
|
 | |
| |
| |
| |
| |
| |
|
Gene: DTNA |
Gene summary for DTNA |
| Gene information | Species | Human | Gene symbol | DTNA | Gene ID | 1837 |
| Gene name | dystrobrevin alpha | |
| Gene Alias | D18S892E | |
| Cytomap | 18q12.1 | |
| Gene Type | protein-coding | GO ID | GO:0003008 | UniProtAcc | Q9Y4J8 |
Top |
Malignant transformation analysis |
| Identification of the aberrant gene expression in precancerous and cancerous lesions by comparing the gene expression of stem-like cells in diseased tissues with normal stem cells |
| Entrez ID | Symbol | Replicates | Species | Organ | Tissue | Adj P-value | Log2FC | Malignancy |
| 1837 | DTNA | NAFLD1 | Human | Liver | NAFLD | 2.33e-04 | 8.72e-01 | -0.04 |
| 1837 | DTNA | HCC1_Meng | Human | Liver | HCC | 2.20e-44 | 2.84e-02 | 0.0246 |
| 1837 | DTNA | cirrhotic3 | Human | Liver | Cirrhotic | 1.60e-04 | 3.81e-02 | 0.0215 |
| 1837 | DTNA | HCC2 | Human | Liver | HCC | 2.68e-12 | 3.53e+00 | 0.5341 |
| 1837 | DTNA | Pt13.b | Human | Liver | HCC | 3.17e-07 | 2.43e-02 | 0.0251 |
| 1837 | DTNA | Pt14.a | Human | Liver | HCC | 2.82e-06 | 3.47e-01 | 0.0169 |
| 1837 | DTNA | Pt14.b | Human | Liver | HCC | 1.76e-05 | 2.20e-01 | 0.018 |
| 1837 | DTNA | S016 | Human | Liver | HCC | 1.41e-02 | 2.04e-02 | 0.2243 |
| 1837 | DTNA | S027 | Human | Liver | HCC | 4.05e-05 | 7.82e-01 | 0.2446 |
| 1837 | DTNA | S028 | Human | Liver | HCC | 8.49e-27 | 1.11e+00 | 0.2503 |
| 1837 | DTNA | S029 | Human | Liver | HCC | 6.54e-19 | 9.42e-01 | 0.2581 |
| 1837 | DTNA | RNA-P17T-P17T-2 | Human | Lung | IAC | 5.30e-08 | 7.78e-01 | 0.3371 |
| 1837 | DTNA | RNA-P17T-P17T-4 | Human | Lung | IAC | 1.13e-06 | 6.03e-01 | 0.343 |
| 1837 | DTNA | RNA-P17T-P17T-6 | Human | Lung | IAC | 2.66e-08 | 7.39e-01 | 0.3385 |
| 1837 | DTNA | RNA-P17T-P17T-8 | Human | Lung | IAC | 5.44e-06 | 7.25e-01 | 0.3329 |
| 1837 | DTNA | HTA12-15-2 | Human | Pancreas | PDAC | 4.79e-02 | 3.65e-01 | 0.2315 |
| 1837 | DTNA | HTA12-23-1 | Human | Pancreas | PDAC | 4.29e-05 | 7.29e-01 | 0.3405 |
| 1837 | DTNA | HTA12-25-1 | Human | Pancreas | PDAC | 1.23e-05 | 7.27e-01 | 0.313 |
| 1837 | DTNA | HTA12-26-1 | Human | Pancreas | PDAC | 8.94e-13 | 7.89e-01 | 0.3728 |
| 1837 | DTNA | HTA12-29-1 | Human | Pancreas | PDAC | 1.81e-31 | 8.33e-01 | 0.3722 |
| Page: 1 2 |
| Tissue | Expression Dynamics | Abbreviation |
| Liver | 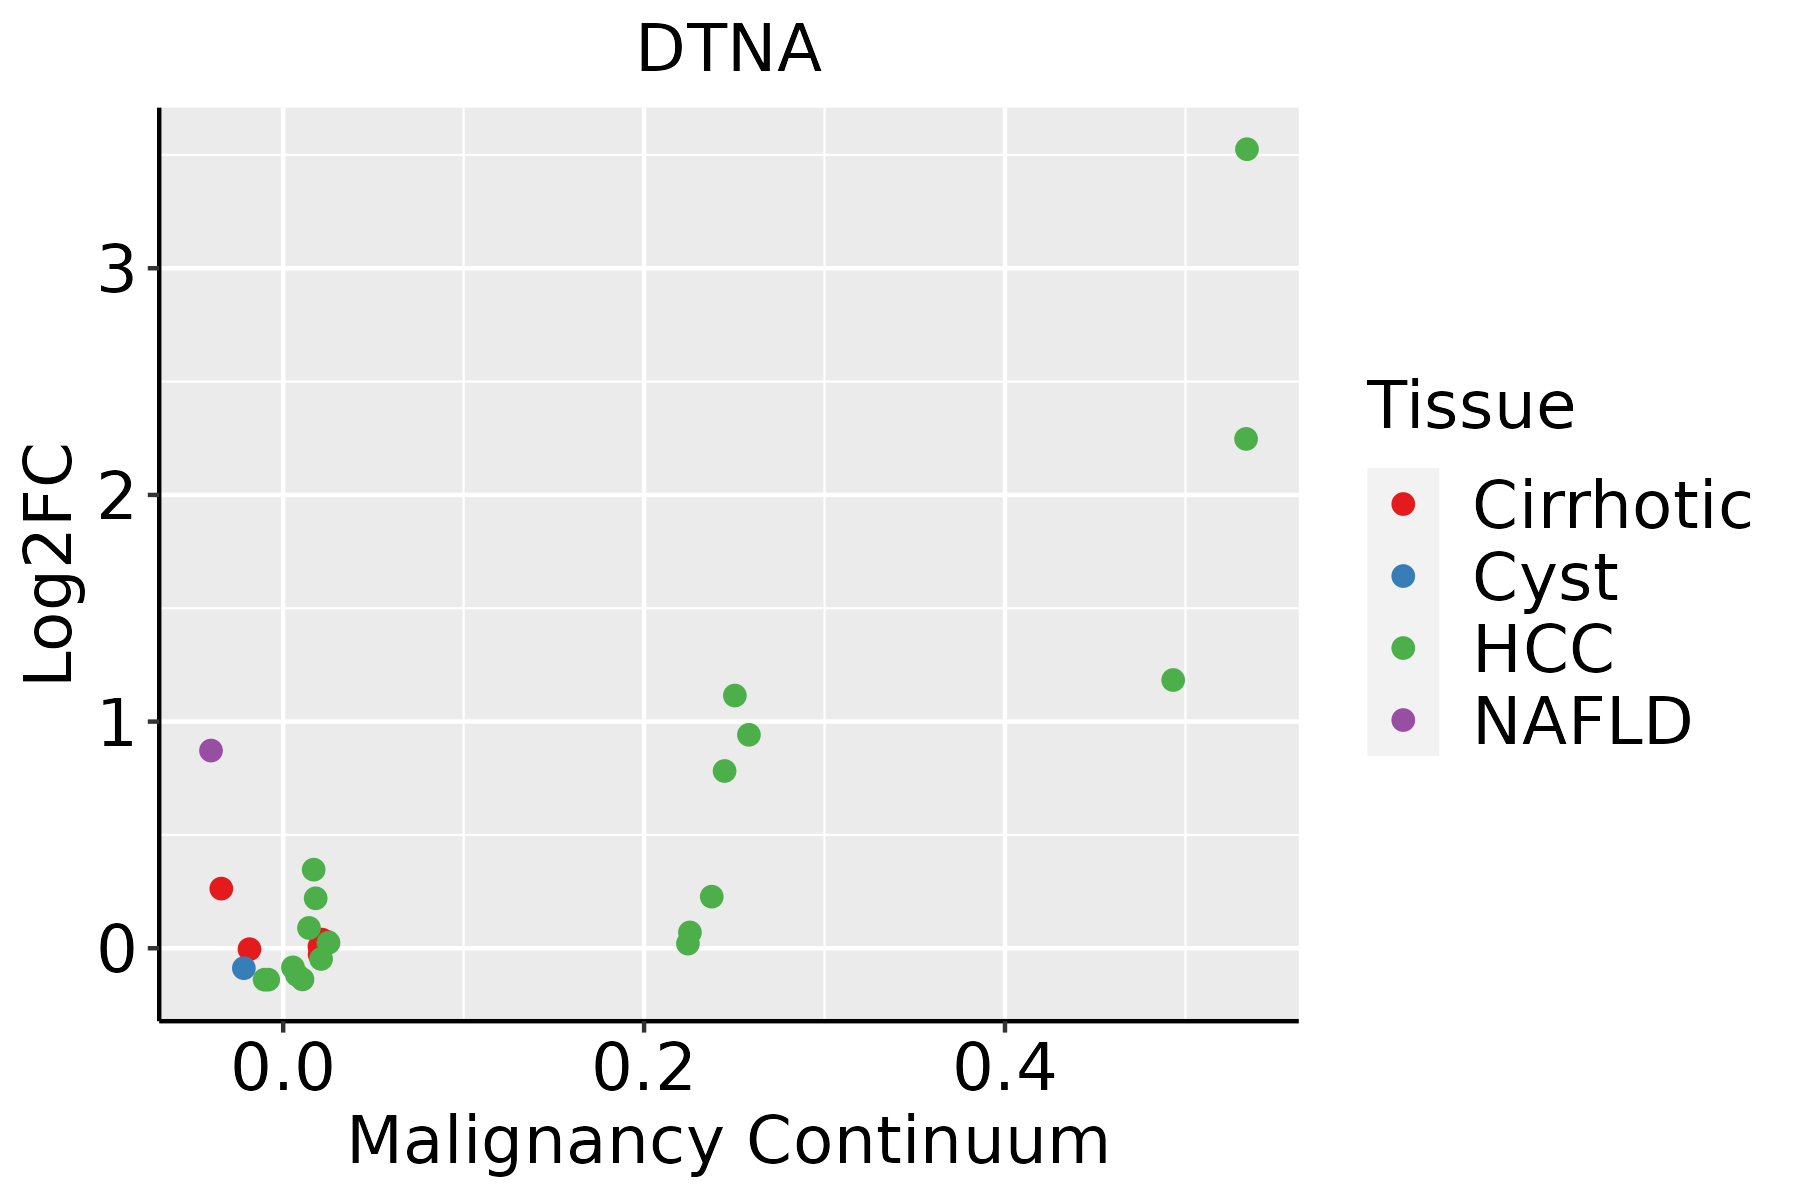 | HCC: Hepatocellular carcinoma |
| NAFLD: Non-alcoholic fatty liver disease | ||
| Lung |  | AAH: Atypical adenomatous hyperplasia |
| AIS: Adenocarcinoma in situ | ||
| IAC: Invasive lung adenocarcinoma | ||
| MIA: Minimally invasive adenocarcinoma | ||
| Thyroid |  | ATC: Anaplastic thyroid cancer |
| HT: Hashimoto's thyroiditis | ||
| PTC: Papillary thyroid cancer |
| ∗log2FC in expression of this searched gene in stem-like cells from each diseased tissue sample relative to stem-like cells in normal samples in each tissue plotted against the malignancy continuum. Samples are colored based on if they are from different disease stage. |
Top |
Malignant transformation related pathway analysis |
| Find out the enriched GO biological processes and KEGG pathways involved in transition from healthy to precancer to cancer |
| Tissue | Disease Stage | Enriched GO biological Processes |
| Colorectum | AD |  |
| Colorectum | SER |  |
| Colorectum | MSS |  |
| Colorectum | MSI-H |  |
| Colorectum | FAP |  |
| ∗Top 15 enriched GO BP terms are showed in the bar plot of each disease state in each tissue. Each row represents a significant GO biological process which is colored according to the -log10(p.adjust). |
| Page: 1 2 3 4 5 6 7 8 9 |
| GO ID | Tissue | Disease Stage | Description | Gene Ratio | Bg Ratio | pvalue | p.adjust | Count |
| GO:00030124 | Lung | IAC | muscle system process | 71/2061 | 452/18723 | 1.29e-03 | 1.45e-02 | 71 |
| Page: 1 |
| Pathway ID | Tissue | Disease Stage | Description | Gene Ratio | Bg Ratio | pvalue | p.adjust | qvalue | Count |
| Page: 1 |
Top |
Cell-cell communication analysis |
| Identification of potential cell-cell interactions between two cell types and their ligand-receptor pairs for different disease states |
| Ligand | Receptor | LRpair | Pathway | Tissue | Disease Stage |
| Page: 1 |
Top |
Single-cell gene regulatory network inference analysis |
| Find out the significant the regulons (TFs) and the target genes of each regulon across cell types for different disease states |
| TF | Cell Type | Tissue | Disease Stage | Target Gene | RSS | Regulon Activity |
| ∗The dot plots of a searched regulon are shown for all cell subpopulations in each disease state of each tissue based on the regulon specific score inferred using pySCENIC and by calculating the average expression. |
| Page: 1 |
Top |
Somatic mutation of malignant transformation related genes |
| Annotation of somatic variants for genes involved in malignant transformation |
| Hugo Symbol | Variant Class | Variant Classification | dbSNP RS | HGVSc | HGVSp | HGVSp Short | SWISSPROT | BIOTYPE | SIFT | PolyPhen | Tumor Sample Barcode | Tissue | Histology | Sex | Age | Stage | Therapy Types | Drugs | Outcome |
| DTNA | SNV | Missense_Mutation | c.135G>C | p.Gln45His | p.Q45H | Q9Y4J8 | protein_coding | deleterious(0.01) | probably_damaging(0.996) | TCGA-AC-A23H-01 | Breast | breast invasive carcinoma | Female | >=65 | I/II | Unknown | Unknown | PD | |
| DTNA | SNV | Missense_Mutation | novel | c.138N>T | p.Lys46Asn | p.K46N | Q9Y4J8 | protein_coding | deleterious(0) | probably_damaging(0.996) | TCGA-AN-A046-01 | Breast | breast invasive carcinoma | Female | >=65 | I/II | Unknown | Unknown | SD |
| DTNA | SNV | Missense_Mutation | novel | c.1390N>T | p.Arg464Cys | p.R464C | Q9Y4J8 | protein_coding | deleterious(0.02) | probably_damaging(0.998) | TCGA-C5-A1MN-01 | Cervix | cervical & endocervical cancer | Female | <65 | III/IV | Chemotherapy | cisplatin | SD |
| DTNA | SNV | Missense_Mutation | rs371363393 | c.1375N>T | p.Arg459Trp | p.R459W | Q9Y4J8 | protein_coding | deleterious(0) | probably_damaging(0.998) | TCGA-C5-A7CK-01 | Cervix | cervical & endocervical cancer | Female | <65 | I/II | Chemotherapy | cisplatin | SD |
| DTNA | SNV | Missense_Mutation | novel | c.1855G>C | p.Gly619Arg | p.G619R | Q9Y4J8 | protein_coding | tolerated_low_confidence(0.13) | probably_damaging(0.945) | TCGA-C5-A901-01 | Cervix | cervical & endocervical cancer | Female | <65 | I/II | Unknown | Unknown | SD |
| DTNA | SNV | Missense_Mutation | c.836C>G | p.Ser279Cys | p.S279C | Q9Y4J8 | protein_coding | deleterious(0.03) | probably_damaging(0.998) | TCGA-JW-A5VL-01 | Cervix | cervical & endocervical cancer | Female | <65 | I/II | Unknown | Unknown | SD | |
| DTNA | SNV | Missense_Mutation | c.257N>G | p.Ser86Cys | p.S86C | Q9Y4J8 | protein_coding | deleterious(0.02) | probably_damaging(0.998) | TCGA-Q1-A5R2-01 | Cervix | cervical & endocervical cancer | Female | <65 | I/II | Chemotherapy | cisplatin | PR | |
| DTNA | SNV | Missense_Mutation | rs764410940 | c.1300N>T | p.Arg434Trp | p.R434W | Q9Y4J8 | protein_coding | deleterious(0) | probably_damaging(0.998) | TCGA-AA-3864-01 | Colorectum | colon adenocarcinoma | Male | >=65 | I/II | Unknown | Unknown | SD |
| DTNA | SNV | Missense_Mutation | c.763N>T | p.Arg255Cys | p.R255C | Q9Y4J8 | protein_coding | deleterious(0) | probably_damaging(0.998) | TCGA-AA-3984-01 | Colorectum | colon adenocarcinoma | Female | <65 | I/II | Unknown | Unknown | SD | |
| DTNA | SNV | Missense_Mutation | novel | c.1636N>A | p.Ala546Thr | p.A546T | Q9Y4J8 | protein_coding | tolerated(0.11) | possibly_damaging(0.607) | TCGA-AU-3779-01 | Colorectum | colon adenocarcinoma | Female | >=65 | I/II | Unknown | Unknown | SD |
| Page: 1 2 3 4 5 6 7 8 9 10 11 |
Top |
Related drugs of malignant transformation related genes |
| Identification of chemicals and drugs interact with genes involved in malignant transfromation |
| (DGIdb 4.0) |
| Entrez ID | Symbol | Category | Interaction Types | Drug Claim Name | Drug Name | PMIDs |
| Page: 1 |

Copyright 2023-Present -The University of Texas Health Science Center at Houston |