
|
|||||
|
 | |
| |
| |
| |
| |
| |
|
Gene: DTL |
Gene summary for DTL |
| Gene information | Species | Human | Gene symbol | DTL | Gene ID | 51514 |
| Gene name | denticleless E3 ubiquitin protein ligase homolog | |
| Gene Alias | CDT2 | |
| Cytomap | 1q32.3 | |
| Gene Type | protein-coding | GO ID | GO:0000075 | UniProtAcc | Q9NZJ0 |
Top |
Malignant transformation analysis |
| Identification of the aberrant gene expression in precancerous and cancerous lesions by comparing the gene expression of stem-like cells in diseased tissues with normal stem cells |
| Entrez ID | Symbol | Replicates | Species | Organ | Tissue | Adj P-value | Log2FC | Malignancy |
| 51514 | DTL | HSIL_HPV_2 | Human | Cervix | HSIL_HPV | 7.01e-03 | 1.30e-01 | 0.0208 |
| 51514 | DTL | CCI_1 | Human | Cervix | CC | 1.61e-10 | 6.83e-01 | 0.528 |
| 51514 | DTL | CCI_2 | Human | Cervix | CC | 3.32e-03 | 4.78e-01 | 0.5249 |
| 51514 | DTL | CCI_3 | Human | Cervix | CC | 3.50e-06 | 5.61e-01 | 0.516 |
| 51514 | DTL | CCII_1 | Human | Cervix | CC | 1.61e-02 | 1.44e-01 | 0.3249 |
| 51514 | DTL | C04 | Human | Oral cavity | OSCC | 6.33e-06 | 3.26e-01 | 0.2633 |
| 51514 | DTL | C21 | Human | Oral cavity | OSCC | 9.02e-19 | 6.42e-01 | 0.2678 |
| 51514 | DTL | C30 | Human | Oral cavity | OSCC | 1.26e-09 | 5.57e-01 | 0.3055 |
| 51514 | DTL | C38 | Human | Oral cavity | OSCC | 3.61e-03 | 3.76e-01 | 0.172 |
| 51514 | DTL | C43 | Human | Oral cavity | OSCC | 2.80e-05 | 1.51e-01 | 0.1704 |
| 51514 | DTL | C46 | Human | Oral cavity | OSCC | 1.00e-07 | 2.07e-01 | 0.1673 |
| 51514 | DTL | C57 | Human | Oral cavity | OSCC | 1.02e-04 | 2.02e-01 | 0.1679 |
| 51514 | DTL | LN22 | Human | Oral cavity | OSCC | 2.01e-02 | 3.55e-01 | 0.1733 |
| 51514 | DTL | LN46 | Human | Oral cavity | OSCC | 2.17e-04 | 2.62e-01 | 0.1666 |
| 51514 | DTL | SYSMH3 | Human | Oral cavity | OSCC | 7.95e-06 | 2.95e-01 | 0.2442 |
| Page: 1 |
| Tissue | Expression Dynamics | Abbreviation |
| Cervix |  | CC: Cervix cancer |
| HSIL_HPV: HPV-infected high-grade squamous intraepithelial lesions | ||
| N_HPV: HPV-infected normal cervix | ||
| Oral Cavity | 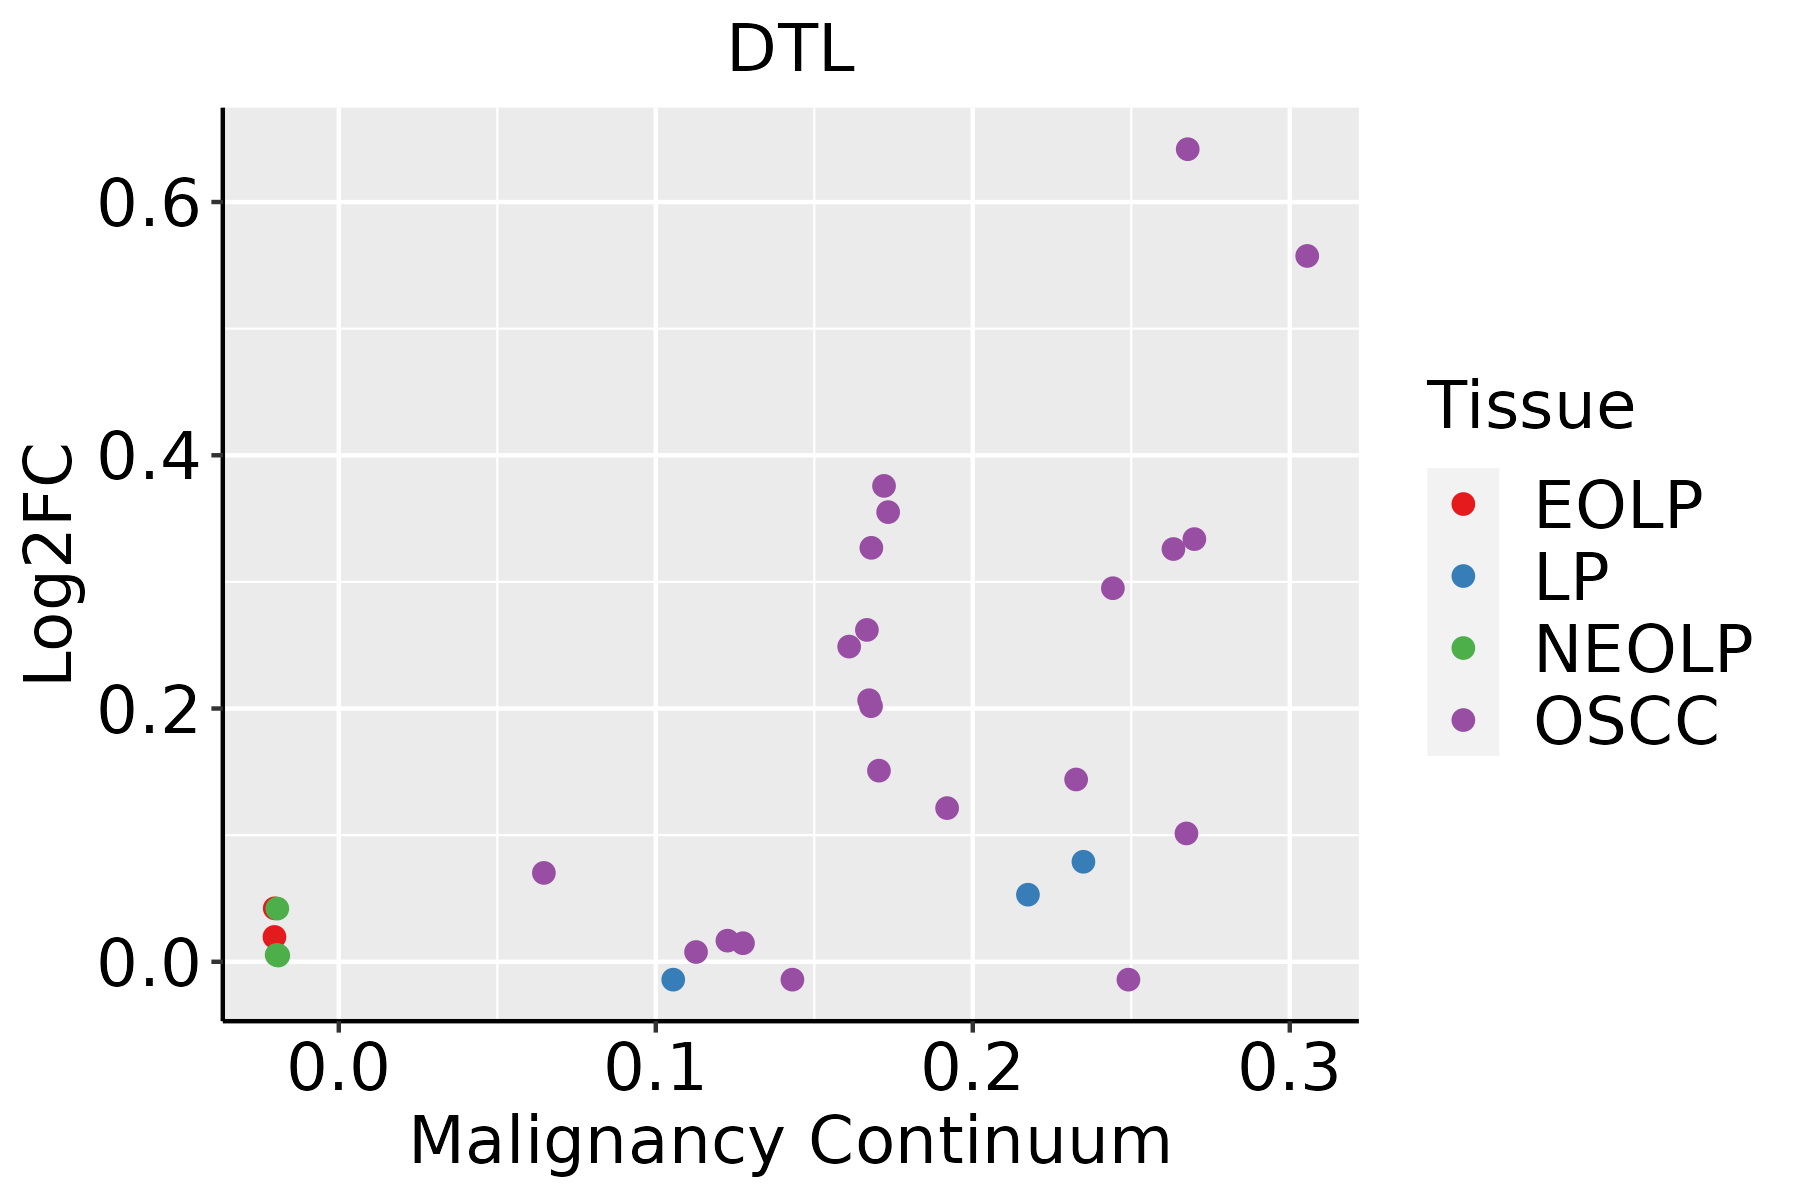 | EOLP: Erosive Oral lichen planus |
| LP: leukoplakia | ||
| NEOLP: Non-erosive oral lichen planus | ||
| OSCC: Oral squamous cell carcinoma |
| ∗log2FC in expression of this searched gene in stem-like cells from each diseased tissue sample relative to stem-like cells in normal samples in each tissue plotted against the malignancy continuum. Samples are colored based on if they are from different disease stage. |
Top |
Malignant transformation related pathway analysis |
| Find out the enriched GO biological processes and KEGG pathways involved in transition from healthy to precancer to cancer |
| Tissue | Disease Stage | Enriched GO biological Processes |
| Colorectum | AD |  |
| Colorectum | SER |  |
| Colorectum | MSS |  |
| Colorectum | MSI-H |  |
| Colorectum | FAP |  |
| ∗Top 15 enriched GO BP terms are showed in the bar plot of each disease state in each tissue. Each row represents a significant GO biological process which is colored according to the -log10(p.adjust). |
| Page: 1 2 3 4 5 6 7 8 9 |
| GO ID | Tissue | Disease Stage | Description | Gene Ratio | Bg Ratio | pvalue | p.adjust | Count |
| GO:004217610 | Cervix | CC | regulation of protein catabolic process | 104/2311 | 391/18723 | 9.39e-15 | 9.36e-12 | 104 |
| GO:004573210 | Cervix | CC | positive regulation of protein catabolic process | 65/2311 | 231/18723 | 7.44e-11 | 1.39e-08 | 65 |
| GO:000989610 | Cervix | CC | positive regulation of catabolic process | 109/2311 | 492/18723 | 5.26e-10 | 6.99e-08 | 109 |
| GO:00002097 | Cervix | CC | protein polyubiquitination | 58/2311 | 236/18723 | 1.57e-07 | 7.41e-06 | 58 |
| GO:00447725 | Cervix | CC | mitotic cell cycle phase transition | 89/2311 | 424/18723 | 2.70e-07 | 1.12e-05 | 89 |
| GO:00485118 | Cervix | CC | rhythmic process | 65/2311 | 298/18723 | 2.79e-06 | 8.04e-05 | 65 |
| GO:00457876 | Cervix | CC | positive regulation of cell cycle | 66/2311 | 313/18723 | 7.78e-06 | 1.81e-04 | 66 |
| GO:00073466 | Cervix | CC | regulation of mitotic cell cycle | 88/2311 | 457/18723 | 1.26e-05 | 2.60e-04 | 88 |
| GO:19019903 | Cervix | CC | regulation of mitotic cell cycle phase transition | 63/2311 | 299/18723 | 1.27e-05 | 2.60e-04 | 63 |
| GO:00459316 | Cervix | CC | positive regulation of mitotic cell cycle | 32/2311 | 121/18723 | 1.88e-05 | 3.47e-04 | 32 |
| GO:00093149 | Cervix | CC | response to radiation | 86/2311 | 456/18723 | 3.50e-05 | 5.63e-04 | 86 |
| GO:19019922 | Cervix | CC | positive regulation of mitotic cell cycle phase transition | 26/2311 | 93/18723 | 3.97e-05 | 6.18e-04 | 26 |
| GO:00900685 | Cervix | CC | positive regulation of cell cycle process | 50/2311 | 236/18723 | 8.25e-05 | 1.11e-03 | 50 |
| GO:19019873 | Cervix | CC | regulation of cell cycle phase transition | 74/2311 | 390/18723 | 9.80e-05 | 1.27e-03 | 74 |
| GO:19019892 | Cervix | CC | positive regulation of cell cycle phase transition | 28/2311 | 115/18723 | 2.82e-04 | 3.07e-03 | 28 |
| GO:00094112 | Cervix | CC | response to UV | 33/2311 | 149/18723 | 5.51e-04 | 5.29e-03 | 33 |
| GO:1902751 | Cervix | CC | positive regulation of cell cycle G2/M phase transition | 11/2311 | 30/18723 | 5.71e-04 | 5.45e-03 | 11 |
| GO:0010971 | Cervix | CC | positive regulation of G2/M transition of mitotic cell cycle | 10/2311 | 27/18723 | 9.25e-04 | 7.84e-03 | 10 |
| GO:00448392 | Cervix | CC | cell cycle G2/M phase transition | 31/2311 | 148/18723 | 2.07e-03 | 1.51e-02 | 31 |
| GO:00457862 | Cervix | CC | negative regulation of cell cycle | 67/2311 | 385/18723 | 2.21e-03 | 1.59e-02 | 67 |
| Page: 1 2 3 4 |
| Pathway ID | Tissue | Disease Stage | Description | Gene Ratio | Bg Ratio | pvalue | p.adjust | qvalue | Count |
| Page: 1 |
Top |
Cell-cell communication analysis |
| Identification of potential cell-cell interactions between two cell types and their ligand-receptor pairs for different disease states |
| Ligand | Receptor | LRpair | Pathway | Tissue | Disease Stage |
| Page: 1 |
Top |
Single-cell gene regulatory network inference analysis |
| Find out the significant the regulons (TFs) and the target genes of each regulon across cell types for different disease states |
| TF | Cell Type | Tissue | Disease Stage | Target Gene | RSS | Regulon Activity |
| ∗The dot plots of a searched regulon are shown for all cell subpopulations in each disease state of each tissue based on the regulon specific score inferred using pySCENIC and by calculating the average expression. |
| Page: 1 |
Top |
Somatic mutation of malignant transformation related genes |
| Annotation of somatic variants for genes involved in malignant transformation |
| Hugo Symbol | Variant Class | Variant Classification | dbSNP RS | HGVSc | HGVSp | HGVSp Short | SWISSPROT | BIOTYPE | SIFT | PolyPhen | Tumor Sample Barcode | Tissue | Histology | Sex | Age | Stage | Therapy Types | Drugs | Outcome |
| DTL | SNV | Missense_Mutation | novel | c.1328C>A | p.Ser443Tyr | p.S443Y | Q9NZJ0 | protein_coding | deleterious(0) | probably_damaging(0.971) | TCGA-AN-A046-01 | Breast | breast invasive carcinoma | Female | >=65 | I/II | Unknown | Unknown | SD |
| DTL | SNV | Missense_Mutation | rs766296682 | c.2033G>A | p.Arg678Gln | p.R678Q | Q9NZJ0 | protein_coding | tolerated(0.74) | benign(0.024) | TCGA-AN-A046-01 | Breast | breast invasive carcinoma | Female | >=65 | I/II | Unknown | Unknown | SD |
| DTL | SNV | Missense_Mutation | novel | c.809G>A | p.Arg270Gln | p.R270Q | Q9NZJ0 | protein_coding | deleterious(0.02) | probably_damaging(0.999) | TCGA-D8-A27V-01 | Breast | breast invasive carcinoma | Female | <65 | I/II | Hormone Therapy | tamoxiphen | SD |
| DTL | SNV | Missense_Mutation | c.128N>T | p.Tyr43Phe | p.Y43F | Q9NZJ0 | protein_coding | deleterious(0.04) | probably_damaging(0.942) | TCGA-E2-A1LA-01 | Breast | breast invasive carcinoma | Female | <65 | I/II | Hormone Therapy | arimidex | SD | |
| DTL | SNV | Missense_Mutation | c.1649G>A | p.Arg550Lys | p.R550K | Q9NZJ0 | protein_coding | tolerated(0.12) | benign(0.022) | TCGA-C5-A902-01 | Cervix | cervical & endocervical cancer | Female | <65 | I/II | Chemotherapy | cisplatin | SD | |
| DTL | SNV | Missense_Mutation | novel | c.1643N>A | p.Arg548Lys | p.R548K | Q9NZJ0 | protein_coding | tolerated(0.06) | benign(0.114) | TCGA-C5-A905-01 | Cervix | cervical & endocervical cancer | Female | <65 | I/II | Unknown | Unknown | SD |
| DTL | SNV | Missense_Mutation | c.1100N>A | p.Cys367Tyr | p.C367Y | Q9NZJ0 | protein_coding | deleterious(0) | possibly_damaging(0.836) | TCGA-AA-3811-01 | Colorectum | colon adenocarcinoma | Female | >=65 | III/IV | Unknown | Unknown | PD | |
| DTL | SNV | Missense_Mutation | novel | c.1079C>A | p.Ser360Tyr | p.S360Y | Q9NZJ0 | protein_coding | deleterious(0.02) | probably_damaging(0.982) | TCGA-AA-3977-01 | Colorectum | colon adenocarcinoma | Male | >=65 | I/II | Unknown | Unknown | SD |
| DTL | SNV | Missense_Mutation | c.1787A>C | p.Glu596Ala | p.E596A | Q9NZJ0 | protein_coding | tolerated(0.15) | benign(0.084) | TCGA-AA-A00N-01 | Colorectum | colon adenocarcinoma | Male | >=65 | I/II | Unknown | Unknown | PD | |
| DTL | SNV | Missense_Mutation | c.230N>A | p.Arg77Gln | p.R77Q | Q9NZJ0 | protein_coding | tolerated(0.06) | benign(0.173) | TCGA-CA-6717-01 | Colorectum | colon adenocarcinoma | Male | <65 | I/II | Chemotherapy | oxaliplatin | CR |
| Page: 1 2 3 4 5 |
Top |
Related drugs of malignant transformation related genes |
| Identification of chemicals and drugs interact with genes involved in malignant transfromation |
| (DGIdb 4.0) |
| Entrez ID | Symbol | Category | Interaction Types | Drug Claim Name | Drug Name | PMIDs |
| Page: 1 |

Copyright 2023-Present -The University of Texas Health Science Center at Houston |