
|
|||||
|
 | |
| |
| |
| |
| |
| |
|
Gene: DTD2 |
Gene summary for DTD2 |
| Gene information | Species | Human | Gene symbol | DTD2 | Gene ID | 112487 |
| Gene name | D-aminoacyl-tRNA deacylase 2 | |
| Gene Alias | ATD | |
| Cytomap | 14q12 | |
| Gene Type | protein-coding | GO ID | GO:0006139 | UniProtAcc | Q96FN9 |
Top |
Malignant transformation analysis |
| Identification of the aberrant gene expression in precancerous and cancerous lesions by comparing the gene expression of stem-like cells in diseased tissues with normal stem cells |
| Entrez ID | Symbol | Replicates | Species | Organ | Tissue | Adj P-value | Log2FC | Malignancy |
| 112487 | DTD2 | LZE2T | Human | Esophagus | ESCC | 1.15e-08 | 9.06e-01 | 0.082 |
| 112487 | DTD2 | LZE4T | Human | Esophagus | ESCC | 2.04e-14 | 4.99e-01 | 0.0811 |
| 112487 | DTD2 | LZE7T | Human | Esophagus | ESCC | 5.92e-05 | 2.78e-01 | 0.0667 |
| 112487 | DTD2 | LZE24T | Human | Esophagus | ESCC | 3.91e-06 | 2.16e-01 | 0.0596 |
| 112487 | DTD2 | LZE21T | Human | Esophagus | ESCC | 1.33e-04 | 2.30e-01 | 0.0655 |
| 112487 | DTD2 | LZE6T | Human | Esophagus | ESCC | 1.11e-04 | 2.12e-01 | 0.0845 |
| 112487 | DTD2 | P2T-E | Human | Esophagus | ESCC | 5.28e-08 | 2.25e-01 | 0.1177 |
| 112487 | DTD2 | P4T-E | Human | Esophagus | ESCC | 3.48e-06 | 1.86e-01 | 0.1323 |
| 112487 | DTD2 | P5T-E | Human | Esophagus | ESCC | 3.94e-11 | 2.94e-01 | 0.1327 |
| 112487 | DTD2 | P8T-E | Human | Esophagus | ESCC | 1.44e-18 | 3.15e-01 | 0.0889 |
| 112487 | DTD2 | P9T-E | Human | Esophagus | ESCC | 1.05e-07 | 3.03e-01 | 0.1131 |
| 112487 | DTD2 | P10T-E | Human | Esophagus | ESCC | 7.55e-18 | 3.29e-01 | 0.116 |
| 112487 | DTD2 | P11T-E | Human | Esophagus | ESCC | 1.48e-03 | 3.39e-01 | 0.1426 |
| 112487 | DTD2 | P12T-E | Human | Esophagus | ESCC | 6.26e-32 | 5.90e-01 | 0.1122 |
| 112487 | DTD2 | P15T-E | Human | Esophagus | ESCC | 1.04e-20 | 5.72e-01 | 0.1149 |
| 112487 | DTD2 | P16T-E | Human | Esophagus | ESCC | 1.01e-11 | 1.56e-01 | 0.1153 |
| 112487 | DTD2 | P17T-E | Human | Esophagus | ESCC | 5.48e-05 | 2.15e-01 | 0.1278 |
| 112487 | DTD2 | P19T-E | Human | Esophagus | ESCC | 4.42e-04 | 4.95e-01 | 0.1662 |
| 112487 | DTD2 | P20T-E | Human | Esophagus | ESCC | 4.08e-06 | 1.67e-01 | 0.1124 |
| 112487 | DTD2 | P21T-E | Human | Esophagus | ESCC | 1.20e-10 | 2.94e-01 | 0.1617 |
| Page: 1 2 3 4 |
| Tissue | Expression Dynamics | Abbreviation |
| Esophagus | 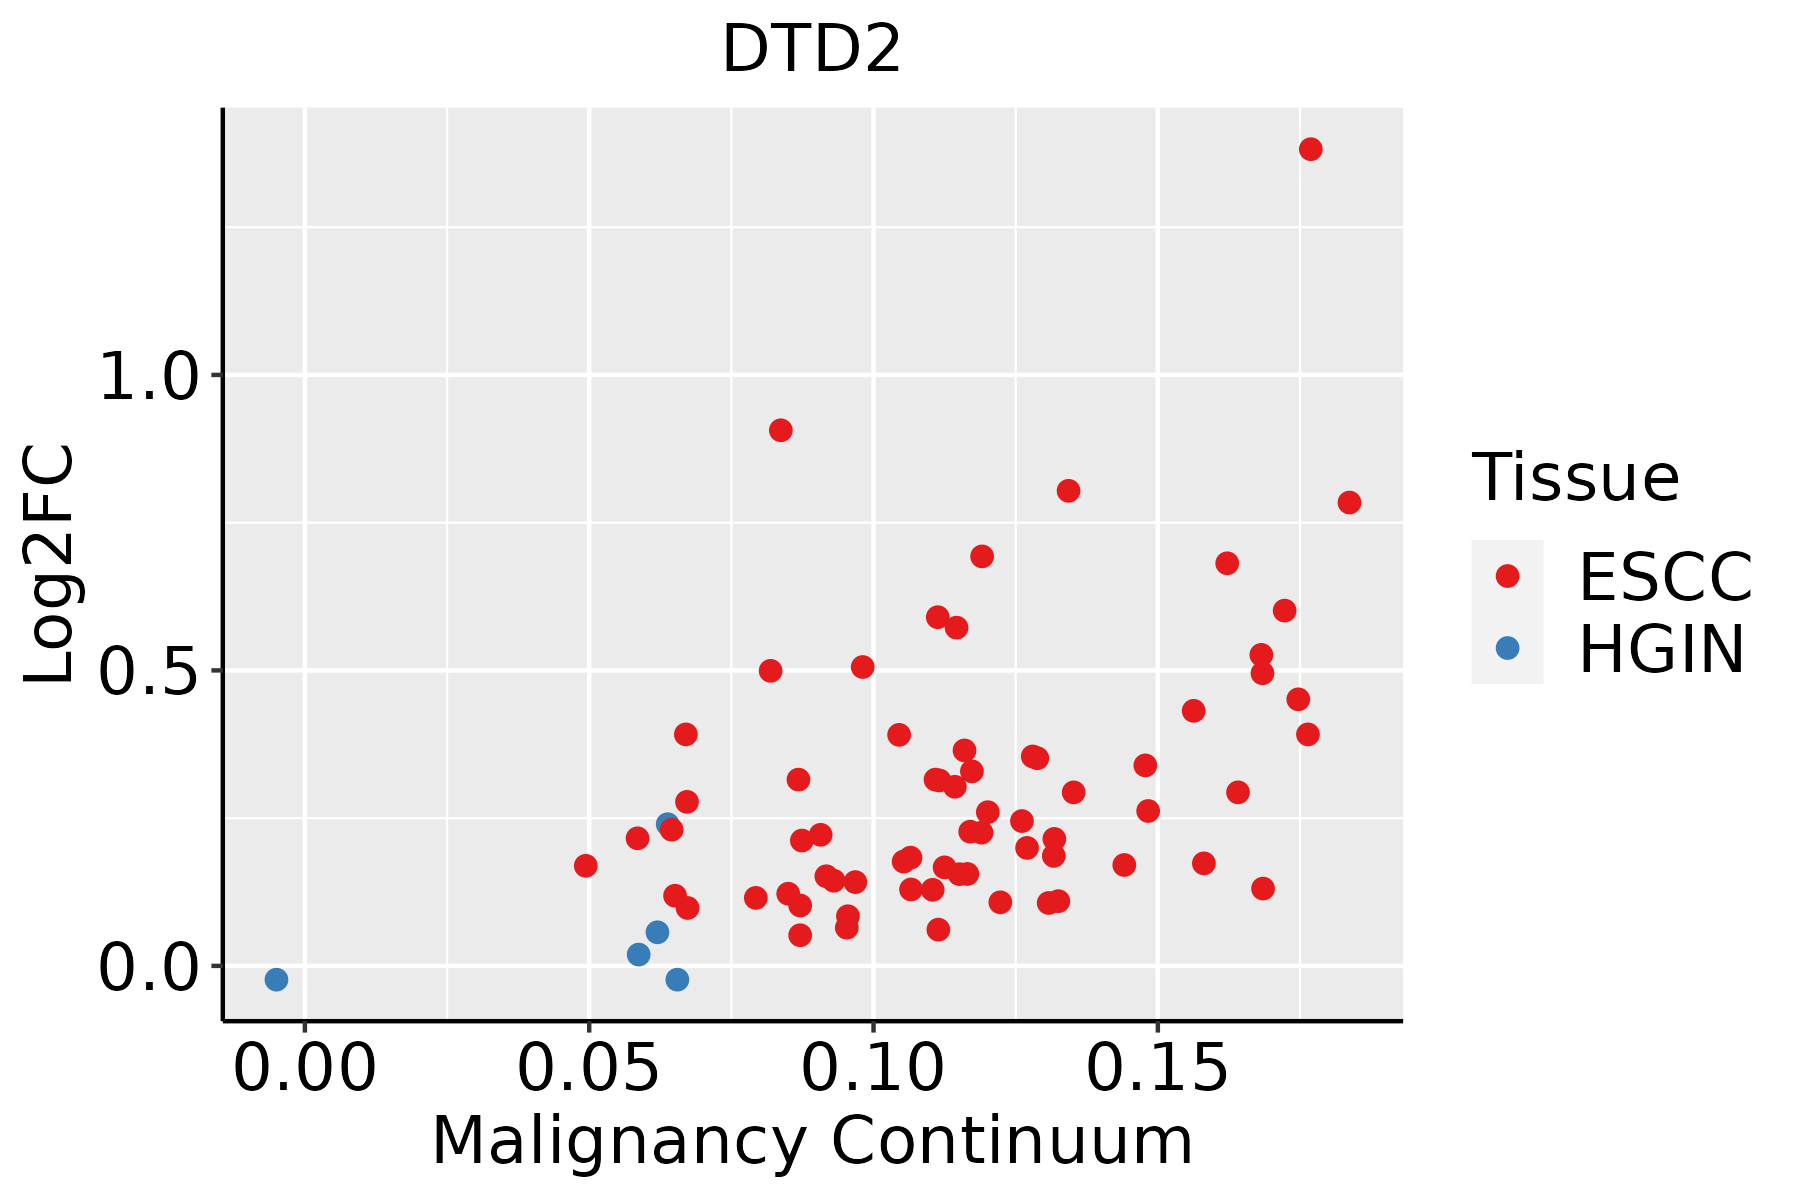 | ESCC: Esophageal squamous cell carcinoma |
| HGIN: High-grade intraepithelial neoplasias | ||
| LGIN: Low-grade intraepithelial neoplasias | ||
| Liver | 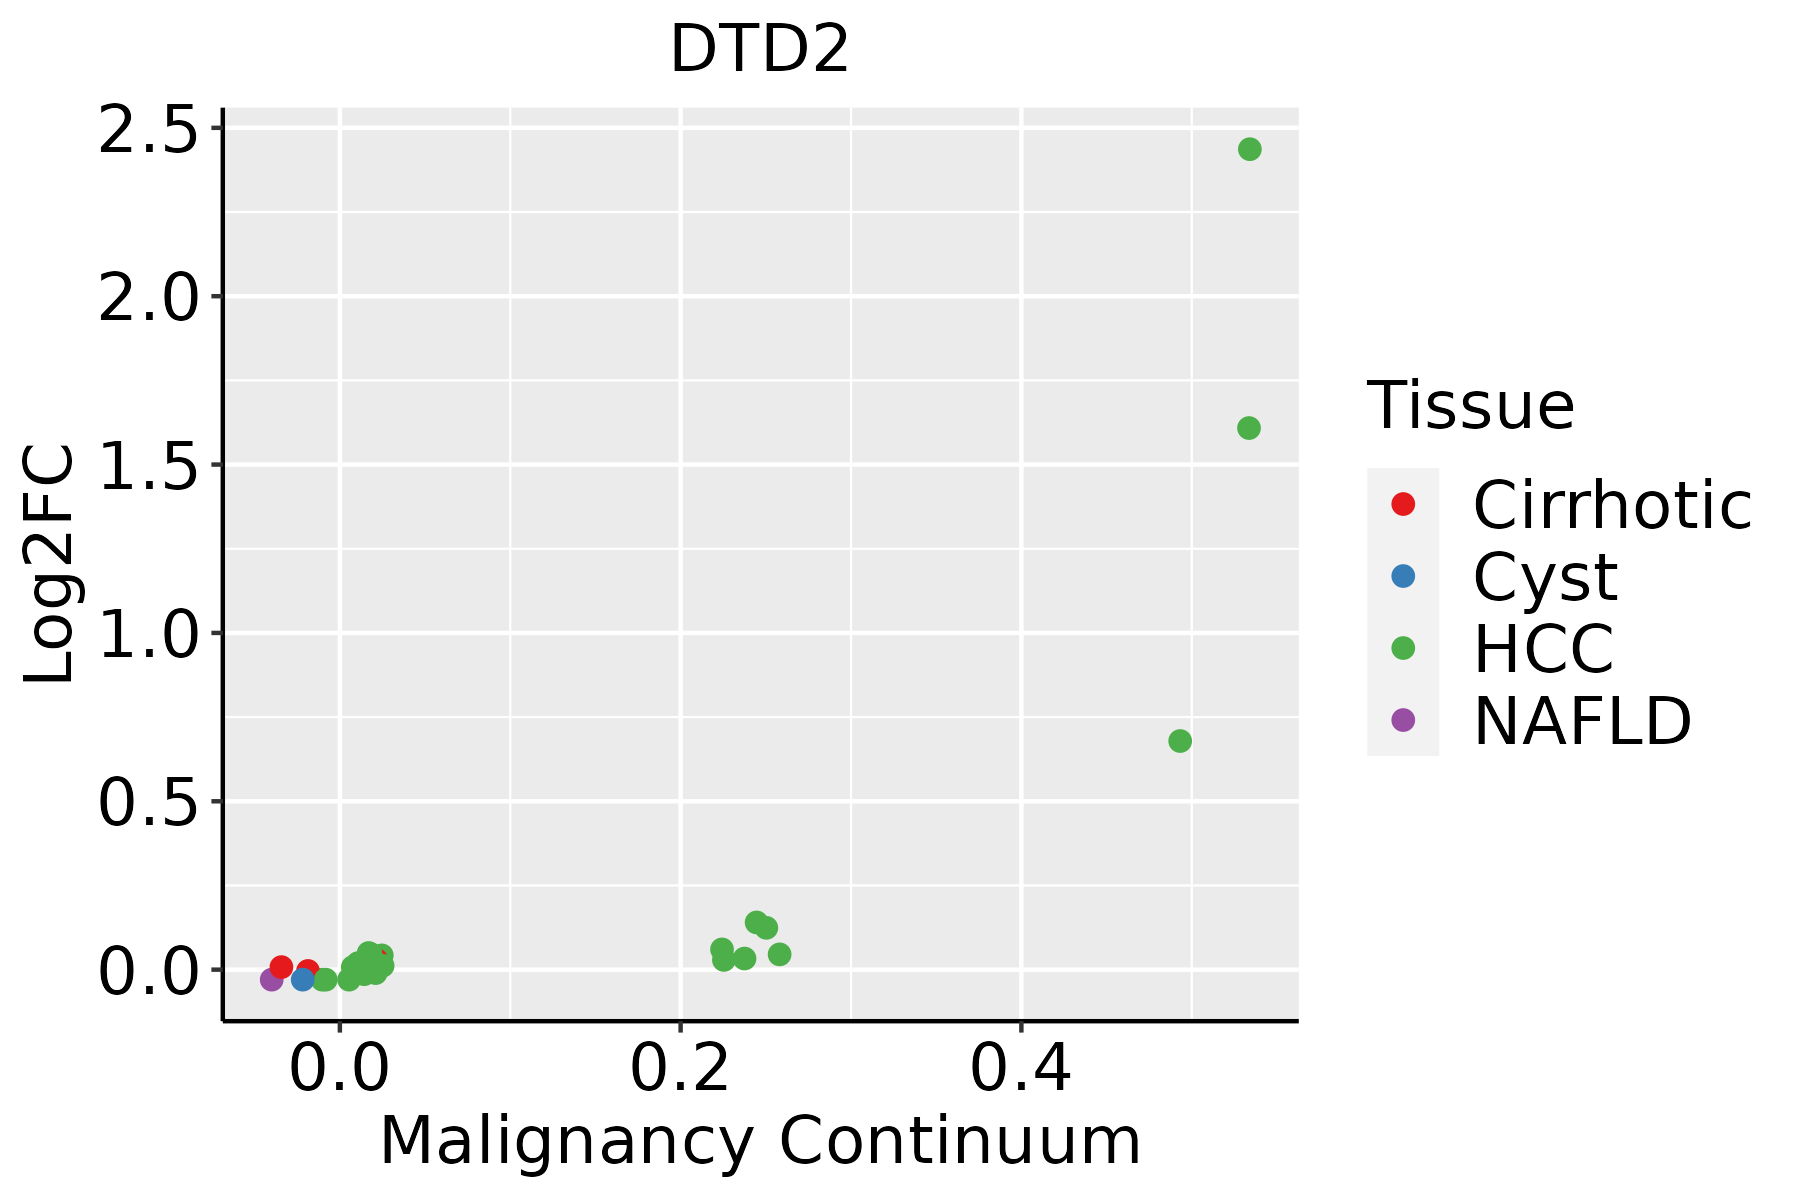 | HCC: Hepatocellular carcinoma |
| NAFLD: Non-alcoholic fatty liver disease | ||
| Oral Cavity | 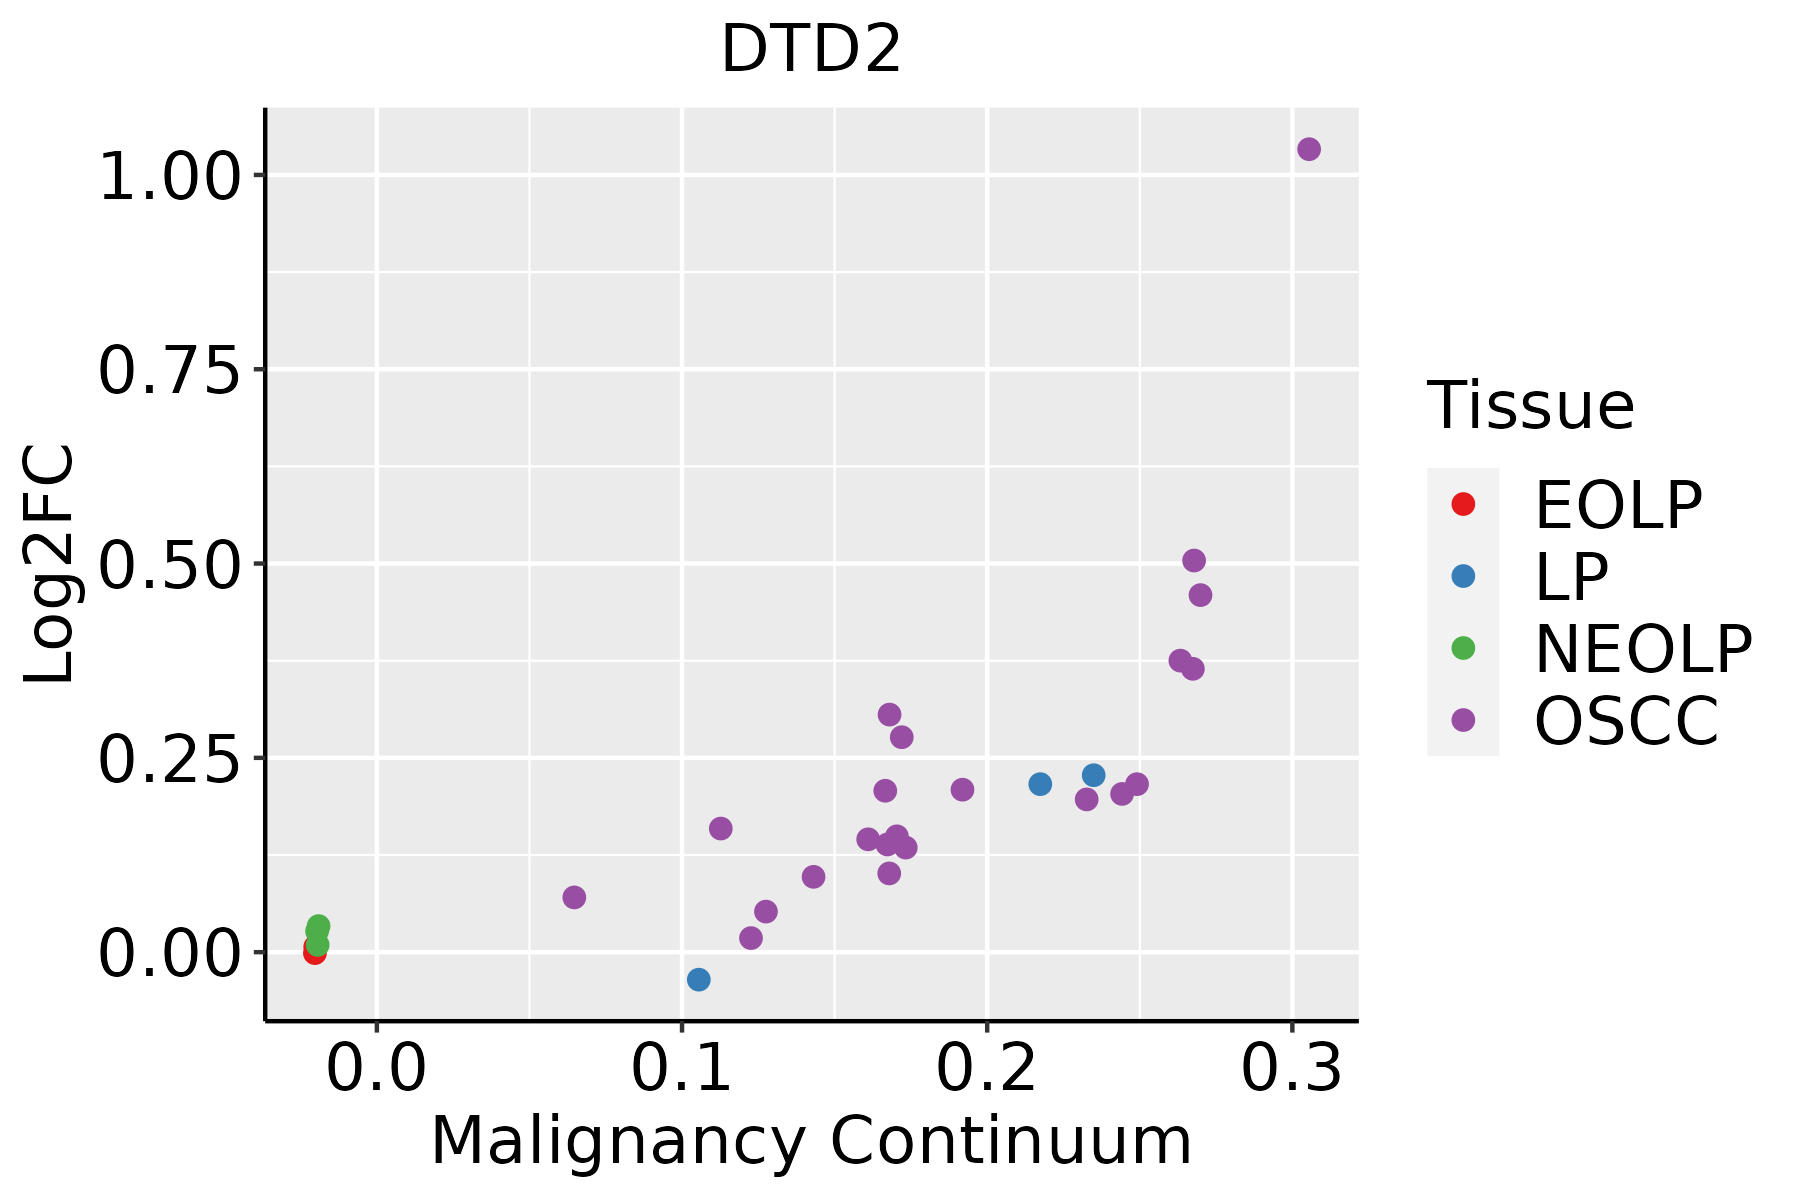 | EOLP: Erosive Oral lichen planus |
| LP: leukoplakia | ||
| NEOLP: Non-erosive oral lichen planus | ||
| OSCC: Oral squamous cell carcinoma |
| ∗log2FC in expression of this searched gene in stem-like cells from each diseased tissue sample relative to stem-like cells in normal samples in each tissue plotted against the malignancy continuum. Samples are colored based on if they are from different disease stage. |
Top |
Malignant transformation related pathway analysis |
| Find out the enriched GO biological processes and KEGG pathways involved in transition from healthy to precancer to cancer |
| Tissue | Disease Stage | Enriched GO biological Processes |
| Colorectum | AD |  |
| Colorectum | SER |  |
| Colorectum | MSS |  |
| Colorectum | MSI-H |  |
| Colorectum | FAP |  |
| ∗Top 15 enriched GO BP terms are showed in the bar plot of each disease state in each tissue. Each row represents a significant GO biological process which is colored according to the -log10(p.adjust). |
| Page: 1 2 3 4 5 6 7 8 9 |
| GO ID | Tissue | Disease Stage | Description | Gene Ratio | Bg Ratio | pvalue | p.adjust | Count |
| GO:003466012 | Esophagus | ESCC | ncRNA metabolic process | 346/8552 | 485/18723 | 4.35e-31 | 2.51e-28 | 346 |
| GO:00063992 | Esophagus | ESCC | tRNA metabolic process | 122/8552 | 179/18723 | 9.03e-10 | 2.19e-08 | 122 |
| GO:00346601 | Liver | HCC | ncRNA metabolic process | 332/7958 | 485/18723 | 1.48e-31 | 7.80e-29 | 332 |
| GO:0006399 | Liver | HCC | tRNA metabolic process | 108/7958 | 179/18723 | 1.07e-06 | 1.59e-05 | 108 |
| GO:00346605 | Oral cavity | OSCC | ncRNA metabolic process | 296/7305 | 485/18723 | 2.94e-23 | 6.65e-21 | 296 |
| GO:00063991 | Oral cavity | OSCC | tRNA metabolic process | 101/7305 | 179/18723 | 1.65e-06 | 2.15e-05 | 101 |
| Page: 1 |
| Pathway ID | Tissue | Disease Stage | Description | Gene Ratio | Bg Ratio | pvalue | p.adjust | qvalue | Count |
| Page: 1 |
Top |
Cell-cell communication analysis |
| Identification of potential cell-cell interactions between two cell types and their ligand-receptor pairs for different disease states |
| Ligand | Receptor | LRpair | Pathway | Tissue | Disease Stage |
| Page: 1 |
Top |
Single-cell gene regulatory network inference analysis |
| Find out the significant the regulons (TFs) and the target genes of each regulon across cell types for different disease states |
| TF | Cell Type | Tissue | Disease Stage | Target Gene | RSS | Regulon Activity |
| ∗The dot plots of a searched regulon are shown for all cell subpopulations in each disease state of each tissue based on the regulon specific score inferred using pySCENIC and by calculating the average expression. |
| Page: 1 |
Top |
Somatic mutation of malignant transformation related genes |
| Annotation of somatic variants for genes involved in malignant transformation |
| Hugo Symbol | Variant Class | Variant Classification | dbSNP RS | HGVSc | HGVSp | HGVSp Short | SWISSPROT | BIOTYPE | SIFT | PolyPhen | Tumor Sample Barcode | Tissue | Histology | Sex | Age | Stage | Therapy Types | Drugs | Outcome |
| DTD2 | SNV | Missense_Mutation | c.359C>T | p.Ser120Phe | p.S120F | Q96FN9 | protein_coding | deleterious(0) | possibly_damaging(0.825) | TCGA-AA-A01P-01 | Colorectum | colon adenocarcinoma | Female | >=65 | III/IV | Unknown | Unknown | PD | |
| DTD2 | SNV | Missense_Mutation | novel | c.26A>G | p.Gln9Arg | p.Q9R | Q96FN9 | protein_coding | tolerated(0.54) | benign(0.014) | TCGA-AZ-4313-01 | Colorectum | colon adenocarcinoma | Female | <65 | I/II | Unknown | Unknown | SD |
| DTD2 | SNV | Missense_Mutation | novel | c.437G>A | p.Gly146Asp | p.G146D | Q96FN9 | protein_coding | deleterious(0.01) | probably_damaging(0.999) | TCGA-AG-A002-01 | Colorectum | rectum adenocarcinoma | Male | <65 | I/II | Unknown | Unknown | SD |
| DTD2 | SNV | Missense_Mutation | novel | c.373N>A | p.Leu125Ile | p.L125I | Q96FN9 | protein_coding | tolerated(0.13) | benign(0.281) | TCGA-AX-A2HC-01 | Endometrium | uterine corpus endometrioid carcinoma | Female | <65 | III/IV | Chemotherapy | paclitaxel | PD |
| DTD2 | SNV | Missense_Mutation | novel | c.205N>A | p.Leu69Ile | p.L69I | Q96FN9 | protein_coding | tolerated(0.07) | probably_damaging(0.99) | TCGA-AX-A2IN-01 | Endometrium | uterine corpus endometrioid carcinoma | Female | <65 | I/II | Unknown | Unknown | PD |
| DTD2 | SNV | Missense_Mutation | c.326N>T | p.Asn109Ile | p.N109I | Q96FN9 | protein_coding | deleterious(0) | probably_damaging(0.949) | TCGA-B5-A0K0-01 | Endometrium | uterine corpus endometrioid carcinoma | Female | <65 | I/II | Unknown | Unknown | SD | |
| DTD2 | SNV | Missense_Mutation | c.161N>C | p.Lys54Thr | p.K54T | Q96FN9 | protein_coding | tolerated(0.1) | benign(0.006) | TCGA-B5-A3FA-01 | Endometrium | uterine corpus endometrioid carcinoma | Female | >=65 | I/II | Unknown | Unknown | SD | |
| DTD2 | SNV | Missense_Mutation | novel | c.410N>T | p.Ala137Val | p.A137V | Q96FN9 | protein_coding | tolerated(0.3) | benign(0.01) | TCGA-BG-A2L7-01 | Endometrium | uterine corpus endometrioid carcinoma | Female | >=65 | I/II | Chemotherapy | carboplatin | CR |
| DTD2 | SNV | Missense_Mutation | novel | c.262N>A | p.Leu88Ile | p.L88I | Q96FN9 | protein_coding | deleterious(0) | probably_damaging(0.999) | TCGA-BK-A6W3-01 | Endometrium | uterine corpus endometrioid carcinoma | Female | <65 | I/II | Unknown | Unknown | SD |
| DTD2 | SNV | Missense_Mutation | c.334N>G | p.Lys112Glu | p.K112E | Q96FN9 | protein_coding | deleterious(0.01) | possibly_damaging(0.896) | TCGA-BS-A0UJ-01 | Endometrium | uterine corpus endometrioid carcinoma | Female | >=65 | I/II | Unknown | Unknown | SD |
| Page: 1 2 |
Top |
Related drugs of malignant transformation related genes |
| Identification of chemicals and drugs interact with genes involved in malignant transfromation |
| (DGIdb 4.0) |
| Entrez ID | Symbol | Category | Interaction Types | Drug Claim Name | Drug Name | PMIDs |
| Page: 1 |

Copyright 2023-Present -The University of Texas Health Science Center at Houston |