
|
|||||
|
 | |
| |
| |
| |
| |
| |
|
Gene: DSTYK |
Gene summary for DSTYK |
| Gene information | Species | Human | Gene symbol | DSTYK | Gene ID | 25778 |
| Gene name | dual serine/threonine and tyrosine protein kinase | |
| Gene Alias | CAKUT1 | |
| Cytomap | 1q32.1 | |
| Gene Type | protein-coding | GO ID | GO:0000165 | UniProtAcc | Q6XUX3 |
Top |
Malignant transformation analysis |
| Identification of the aberrant gene expression in precancerous and cancerous lesions by comparing the gene expression of stem-like cells in diseased tissues with normal stem cells |
| Entrez ID | Symbol | Replicates | Species | Organ | Tissue | Adj P-value | Log2FC | Malignancy |
| 25778 | DSTYK | LZE4T | Human | Esophagus | ESCC | 8.43e-06 | 1.78e-01 | 0.0811 |
| 25778 | DSTYK | LZE24T | Human | Esophagus | ESCC | 4.39e-10 | 1.58e-01 | 0.0596 |
| 25778 | DSTYK | LZE21T | Human | Esophagus | ESCC | 4.50e-03 | 1.56e-01 | 0.0655 |
| 25778 | DSTYK | P2T-E | Human | Esophagus | ESCC | 2.94e-18 | 3.30e-01 | 0.1177 |
| 25778 | DSTYK | P4T-E | Human | Esophagus | ESCC | 3.07e-03 | 1.35e-01 | 0.1323 |
| 25778 | DSTYK | P5T-E | Human | Esophagus | ESCC | 3.43e-05 | 1.23e-01 | 0.1327 |
| 25778 | DSTYK | P8T-E | Human | Esophagus | ESCC | 3.96e-07 | 1.18e-01 | 0.0889 |
| 25778 | DSTYK | P9T-E | Human | Esophagus | ESCC | 5.74e-04 | 1.79e-01 | 0.1131 |
| 25778 | DSTYK | P10T-E | Human | Esophagus | ESCC | 6.96e-10 | 2.12e-01 | 0.116 |
| 25778 | DSTYK | P12T-E | Human | Esophagus | ESCC | 1.98e-08 | 1.89e-01 | 0.1122 |
| 25778 | DSTYK | P15T-E | Human | Esophagus | ESCC | 1.72e-11 | 2.72e-01 | 0.1149 |
| 25778 | DSTYK | P16T-E | Human | Esophagus | ESCC | 4.28e-11 | 1.51e-01 | 0.1153 |
| 25778 | DSTYK | P17T-E | Human | Esophagus | ESCC | 1.04e-03 | 1.16e-01 | 0.1278 |
| 25778 | DSTYK | P20T-E | Human | Esophagus | ESCC | 1.61e-02 | 7.24e-02 | 0.1124 |
| 25778 | DSTYK | P21T-E | Human | Esophagus | ESCC | 1.30e-02 | 1.31e-01 | 0.1617 |
| 25778 | DSTYK | P22T-E | Human | Esophagus | ESCC | 5.55e-10 | 2.13e-01 | 0.1236 |
| 25778 | DSTYK | P23T-E | Human | Esophagus | ESCC | 1.87e-07 | 1.68e-01 | 0.108 |
| 25778 | DSTYK | P24T-E | Human | Esophagus | ESCC | 5.36e-05 | 1.02e-01 | 0.1287 |
| 25778 | DSTYK | P26T-E | Human | Esophagus | ESCC | 8.69e-12 | 2.96e-01 | 0.1276 |
| 25778 | DSTYK | P27T-E | Human | Esophagus | ESCC | 1.30e-03 | 1.12e-01 | 0.1055 |
| Page: 1 2 3 |
| Tissue | Expression Dynamics | Abbreviation |
| Esophagus |  | ESCC: Esophageal squamous cell carcinoma |
| HGIN: High-grade intraepithelial neoplasias | ||
| LGIN: Low-grade intraepithelial neoplasias | ||
| Liver | 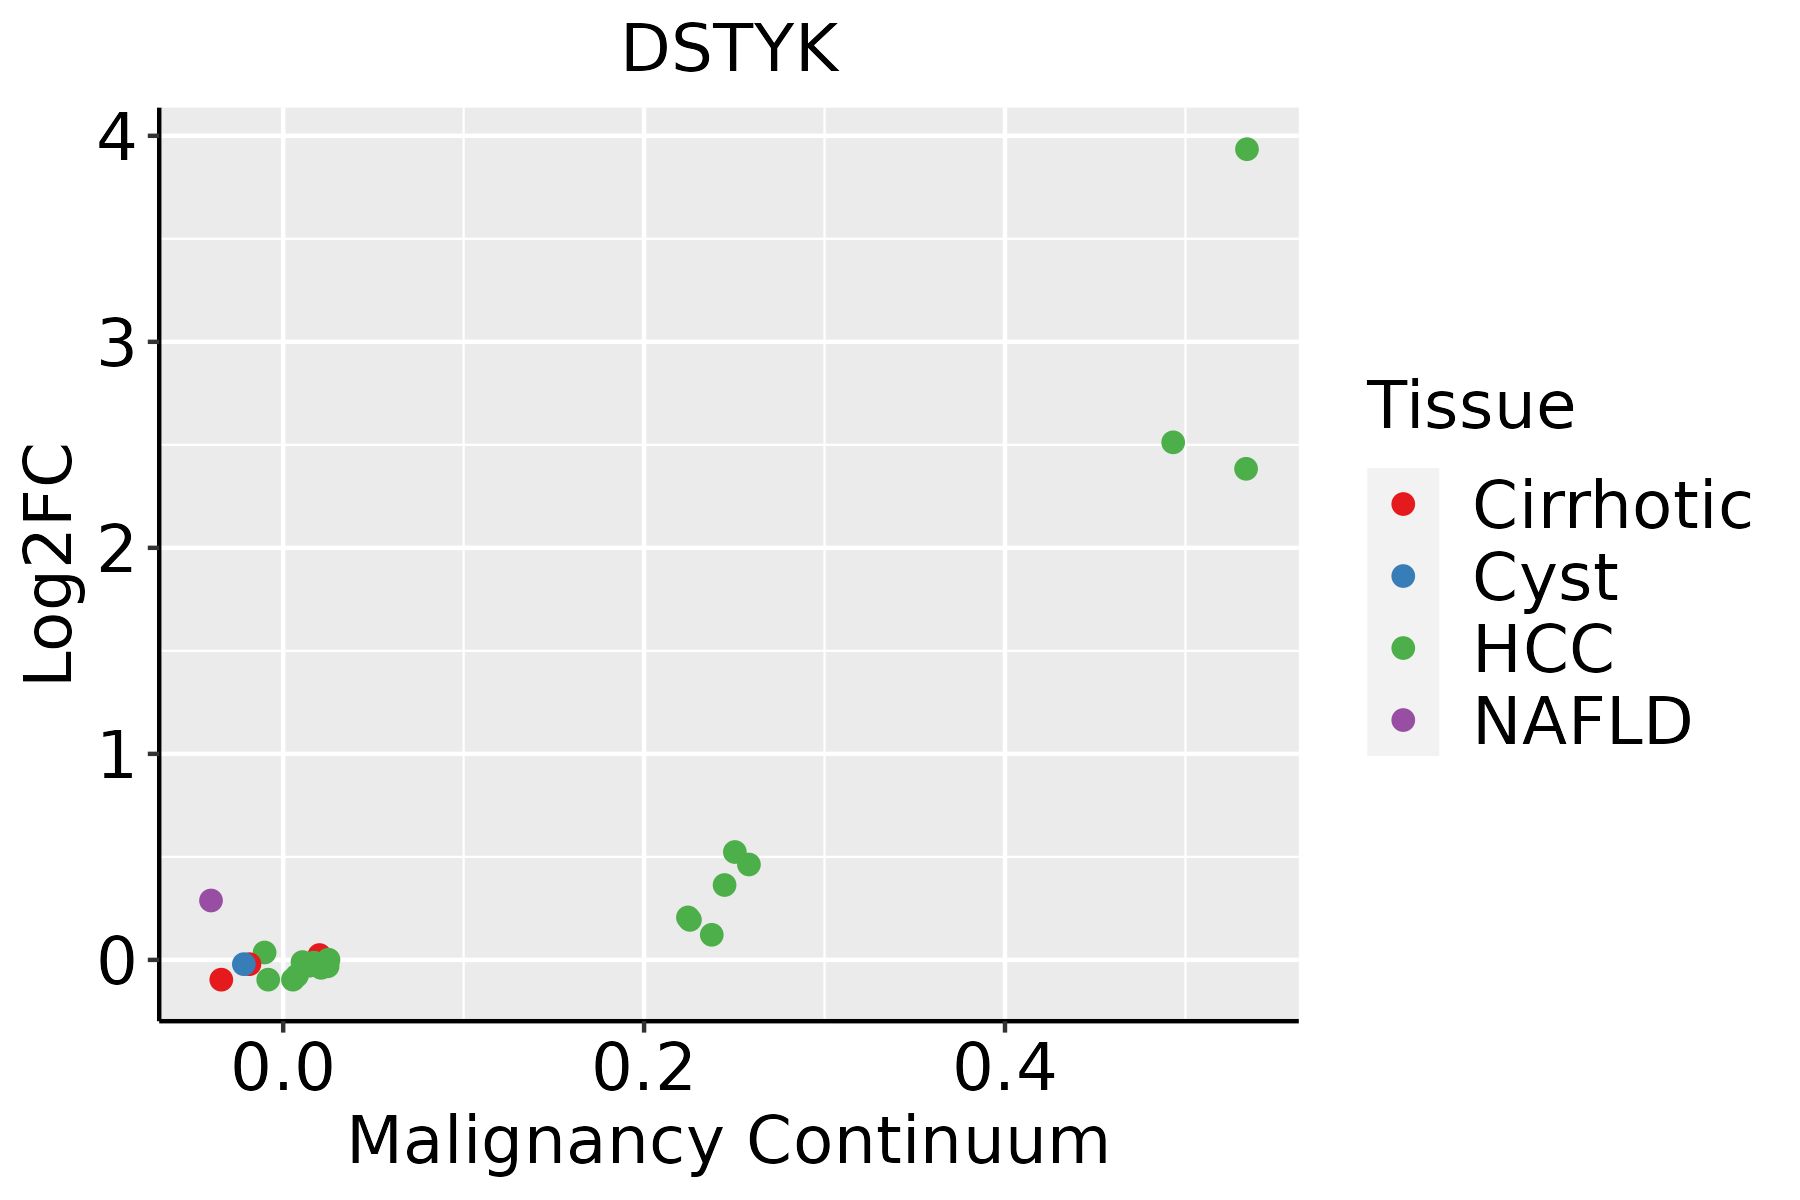 | HCC: Hepatocellular carcinoma |
| NAFLD: Non-alcoholic fatty liver disease |
| ∗log2FC in expression of this searched gene in stem-like cells from each diseased tissue sample relative to stem-like cells in normal samples in each tissue plotted against the malignancy continuum. Samples are colored based on if they are from different disease stage. |
Top |
Malignant transformation related pathway analysis |
| Find out the enriched GO biological processes and KEGG pathways involved in transition from healthy to precancer to cancer |
| Tissue | Disease Stage | Enriched GO biological Processes |
| Colorectum | AD |  |
| Colorectum | SER |  |
| Colorectum | MSS |  |
| Colorectum | MSI-H |  |
| Colorectum | FAP |  |
| ∗Top 15 enriched GO BP terms are showed in the bar plot of each disease state in each tissue. Each row represents a significant GO biological process which is colored according to the -log10(p.adjust). |
| Page: 1 2 3 4 5 6 7 8 9 |
| GO ID | Tissue | Disease Stage | Description | Gene Ratio | Bg Ratio | pvalue | p.adjust | Count |
| GO:003367420 | Esophagus | ESCC | positive regulation of kinase activity | 260/8552 | 467/18723 | 7.26e-06 | 7.22e-05 | 260 |
| GO:00182124 | Esophagus | ESCC | peptidyl-tyrosine modification | 202/8552 | 378/18723 | 1.34e-03 | 6.39e-03 | 202 |
| GO:00181084 | Esophagus | ESCC | peptidyl-tyrosine phosphorylation | 200/8552 | 375/18723 | 1.60e-03 | 7.45e-03 | 200 |
| GO:003367411 | Liver | HCC | positive regulation of kinase activity | 230/7958 | 467/18723 | 1.72e-03 | 8.95e-03 | 230 |
| Page: 1 |
| Pathway ID | Tissue | Disease Stage | Description | Gene Ratio | Bg Ratio | pvalue | p.adjust | qvalue | Count |
| Page: 1 |
Top |
Cell-cell communication analysis |
| Identification of potential cell-cell interactions between two cell types and their ligand-receptor pairs for different disease states |
| Ligand | Receptor | LRpair | Pathway | Tissue | Disease Stage |
| Page: 1 |
Top |
Single-cell gene regulatory network inference analysis |
| Find out the significant the regulons (TFs) and the target genes of each regulon across cell types for different disease states |
| TF | Cell Type | Tissue | Disease Stage | Target Gene | RSS | Regulon Activity |
| ∗The dot plots of a searched regulon are shown for all cell subpopulations in each disease state of each tissue based on the regulon specific score inferred using pySCENIC and by calculating the average expression. |
| Page: 1 |
Top |
Somatic mutation of malignant transformation related genes |
| Annotation of somatic variants for genes involved in malignant transformation |
| Hugo Symbol | Variant Class | Variant Classification | dbSNP RS | HGVSc | HGVSp | HGVSp Short | SWISSPROT | BIOTYPE | SIFT | PolyPhen | Tumor Sample Barcode | Tissue | Histology | Sex | Age | Stage | Therapy Types | Drugs | Outcome |
| DSTYK | SNV | Missense_Mutation | novel | c.2140C>A | p.His714Asn | p.H714N | Q6XUX3 | protein_coding | tolerated(0.05) | possibly_damaging(0.786) | TCGA-A2-A25A-01 | Breast | breast invasive carcinoma | Female | <65 | I/II | Unspecific | Cytoxan | SD |
| DSTYK | SNV | Missense_Mutation | c.2667N>C | p.Trp889Cys | p.W889C | Q6XUX3 | protein_coding | deleterious(0) | probably_damaging(1) | TCGA-A8-A09W-01 | Breast | breast invasive carcinoma | Female | >=65 | III/IV | Unknown | Unknown | SD | |
| DSTYK | SNV | Missense_Mutation | rs778420247 | c.895N>A | p.Glu299Lys | p.E299K | Q6XUX3 | protein_coding | tolerated(0.12) | benign(0.085) | TCGA-BH-A0HF-01 | Breast | breast invasive carcinoma | Female | >=65 | I/II | Hormone Therapy | arimidex | SD |
| DSTYK | SNV | Missense_Mutation | c.1822N>A | p.Glu608Lys | p.E608K | Q6XUX3 | protein_coding | deleterious(0.04) | probably_damaging(0.948) | TCGA-BH-A0HP-01 | Breast | breast invasive carcinoma | Female | >=65 | III/IV | Chemotherapy | doxorubicin | SD | |
| DSTYK | SNV | Missense_Mutation | c.2341N>G | p.Lys781Glu | p.K781E | Q6XUX3 | protein_coding | deleterious(0) | benign(0.386) | TCGA-D8-A1XK-01 | Breast | breast invasive carcinoma | Female | <65 | I/II | Chemotherapy | doxorubicine+cyclophosphamide | SD | |
| DSTYK | insertion | Nonsense_Mutation | novel | c.2018_2019insCCTGTAAAGCAATGGAAATAAATCTTCCTGAGGGACCTAGA | p.Gly674LeufsTer2 | p.G674Lfs*2 | Q6XUX3 | protein_coding | TCGA-A2-A04Y-01 | Breast | breast invasive carcinoma | Female | <65 | I/II | Chemotherapy | cytoxan | SD | ||
| DSTYK | insertion | Frame_Shift_Ins | novel | c.2259_2260insGGGTTTTGCCATGTTGGCCAGGCTGGTCTCCAACA | p.Arg754GlyfsTer16 | p.R754Gfs*16 | Q6XUX3 | protein_coding | TCGA-A8-A08H-01 | Breast | breast invasive carcinoma | Female | >=65 | I/II | Unknown | Unknown | SD | ||
| DSTYK | insertion | Nonsense_Mutation | novel | c.1185_1186insCCATGAGAC | p.Arg395_Lys396insProTerAsp | p.R395_K396insP*D | Q6XUX3 | protein_coding | TCGA-AR-A0U0-01 | Breast | breast invasive carcinoma | Female | >=65 | I/II | Unknown | Unknown | SD | ||
| DSTYK | insertion | Frame_Shift_Ins | novel | c.2683_2684insTGTGTGTG | p.Lys895MetfsTer19 | p.K895Mfs*19 | Q6XUX3 | protein_coding | TCGA-BH-A0BJ-01 | Breast | breast invasive carcinoma | Female | <65 | I/II | Chemotherapy | doxorubicin | SD | ||
| DSTYK | insertion | Frame_Shift_Ins | novel | c.2682_2683insTGTATGCATATATTTGTGTGTATATGTATAT | p.Lys895CysfsTer11 | p.K895Cfs*11 | Q6XUX3 | protein_coding | TCGA-BH-A0BJ-01 | Breast | breast invasive carcinoma | Female | <65 | I/II | Chemotherapy | doxorubicin | SD |
| Page: 1 2 3 4 5 6 7 8 9 10 11 |
Top |
Related drugs of malignant transformation related genes |
| Identification of chemicals and drugs interact with genes involved in malignant transfromation |
| (DGIdb 4.0) |
| Entrez ID | Symbol | Category | Interaction Types | Drug Claim Name | Drug Name | PMIDs |
| Page: 1 |

Copyright 2023-Present -The University of Texas Health Science Center at Houston |