Schematic overview of the cellular and molecular mechanisms involved in the cancer progression, including the proposed cellular and molecular mechanisms in cancer cells trajectory. AT1: alveolar type 1 cells; AT2: alveolar type 2 cells; AAH: atypical adenomatous hyperplasia; AIS: adenocarcinoma in situ; MIA: minimally invasive adenocarcinoma; IA: invasive adenocarcinoma; EMT: epithelial-mesenchymal transition

Home

Download

Statistics

Help

Contact

Center for Computational Systems Medicine
leaf

Gene summary

leaf

Malignant transformation analysis

leaf

Malignant transformation related pathway analysis

leaf

Cell-cell communication analysis

leaf

Single-cell gene regulatory network inference analysis

leaf

Somatic mutation of malignant transformation related genes

leaf

Related drugs of malignant transformation related genes

Gene: DST

Gene summary for DST

check button Gene summary.

Gene informationSpeciesHuman
Gene symbol

DST

Gene ID

667

Gene namedystonin
Gene AliasBP240
Cytomap6p12.1
Gene Typeprotein-coding
GO ID

GO:0000226

UniProtAcc

B4DSS9


Top

Malignant transformation analysis

check button Identification of the aberrant gene expression in precancerous and cancerous lesions by comparing the gene expression of stem-like cells in diseased tissues with normal stem cells
check button Malignant transformation involving gene list.
Entrez IDSymbolReplicatesSpeciesOrganTissueAdj P-valueLog2FCMalignancy
667DSTGSM4909281HumanBreastIDC2.92e-03-3.62e-010.21
667DSTGSM4909282HumanBreastIDC3.84e-17-5.25e-01-0.0288
667DSTGSM4909286HumanBreastIDC1.03e-06-3.84e-010.1081
667DSTGSM4909287HumanBreastIDC1.34e-08-4.01e-010.2057
667DSTGSM4909290HumanBreastIDC1.17e-08-4.62e-010.2096
667DSTGSM4909293HumanBreastIDC3.47e-11-4.92e-010.1581
667DSTGSM4909294HumanBreastIDC2.89e-05-4.28e-010.2022
667DSTGSM4909296HumanBreastIDC1.18e-17-5.60e-010.1524
667DSTGSM4909297HumanBreastIDC2.00e-12-5.14e-010.1517
667DSTGSM4909298HumanBreastIDC1.93e-02-3.56e-010.1551
667DSTGSM4909301HumanBreastIDC2.86e-05-4.36e-010.1577
667DSTGSM4909302HumanBreastIDC1.83e-15-4.79e-010.1545
667DSTGSM4909303HumanBreastIDC7.43e-03-4.71e-010.0438
667DSTGSM4909304HumanBreastIDC2.01e-22-6.00e-010.1636
667DSTGSM4909305HumanBreastIDC8.32e-04-3.64e-010.0436
667DSTGSM4909306HumanBreastIDC5.79e-17-5.62e-010.1564
667DSTGSM4909307HumanBreastIDC3.63e-03-3.62e-010.1569
667DSTGSM4909308HumanBreastIDC2.15e-08-4.20e-010.158
667DSTGSM4909309HumanBreastIDC3.83e-06-3.24e-010.0483
667DSTGSM4909311HumanBreastIDC5.66e-29-5.93e-010.1534
Page: 1 2 3 4 5 6 7 8 9 10 11 12 13 14 15 

check button Transcriptomic changes along malignancy continuum.
TissueExpression DynamicsAbbreviation
BreastThe image shows the transcriptomic changes along malignancy continuum.log2FC in expression of this searched gene in stem-like cells from each diseased tissue sample relative to stem-like cells in normal samples in each tissue plotted against the malignancy continuum. Samples are colored based on if they are from different disease stage.IDC: Invasive ductal carcinoma
DCIS: Ductal carcinoma in situ
Precancer(BRCA1-mut): Precancerous lesion from BRCA1 mutation carriers
CervixThe image shows the transcriptomic changes along malignancy continuum.log2FC in expression of this searched gene in stem-like cells from each diseased tissue sample relative to stem-like cells in normal samples in each tissue plotted against the malignancy continuum. Samples are colored based on if they are from different disease stage.CC: Cervix cancer
HSIL_HPV: HPV-infected high-grade squamous intraepithelial lesions
N_HPV: HPV-infected normal cervix
Colorectum (GSE201348)The image shows the transcriptomic changes along malignancy continuum.log2FC in expression of this searched gene in stem-like cells from each diseased tissue sample relative to stem-like cells in normal samples in each tissue plotted against the malignancy continuum. Samples are colored based on if they are from different disease stage.FAP: Familial adenomatous polyposis
CRC: Colorectal cancer
Colorectum (HTA11)The image shows the transcriptomic changes along malignancy continuum.log2FC in expression of this searched gene in stem-like cells from each diseased tissue sample relative to stem-like cells in normal samples in each tissue plotted against the malignancy continuum. Samples are colored based on if they are from different disease stage.AD: Adenomas
SER: Sessile serrated lesions
MSI-H: Microsatellite-high colorectal cancer
MSS: Microsatellite stable colorectal cancer
EsophagusThe image shows the transcriptomic changes along malignancy continuum.log2FC in expression of this searched gene in stem-like cells from each diseased tissue sample relative to stem-like cells in normal samples in each tissue plotted against the malignancy continuum. Samples are colored based on if they are from different disease stage.
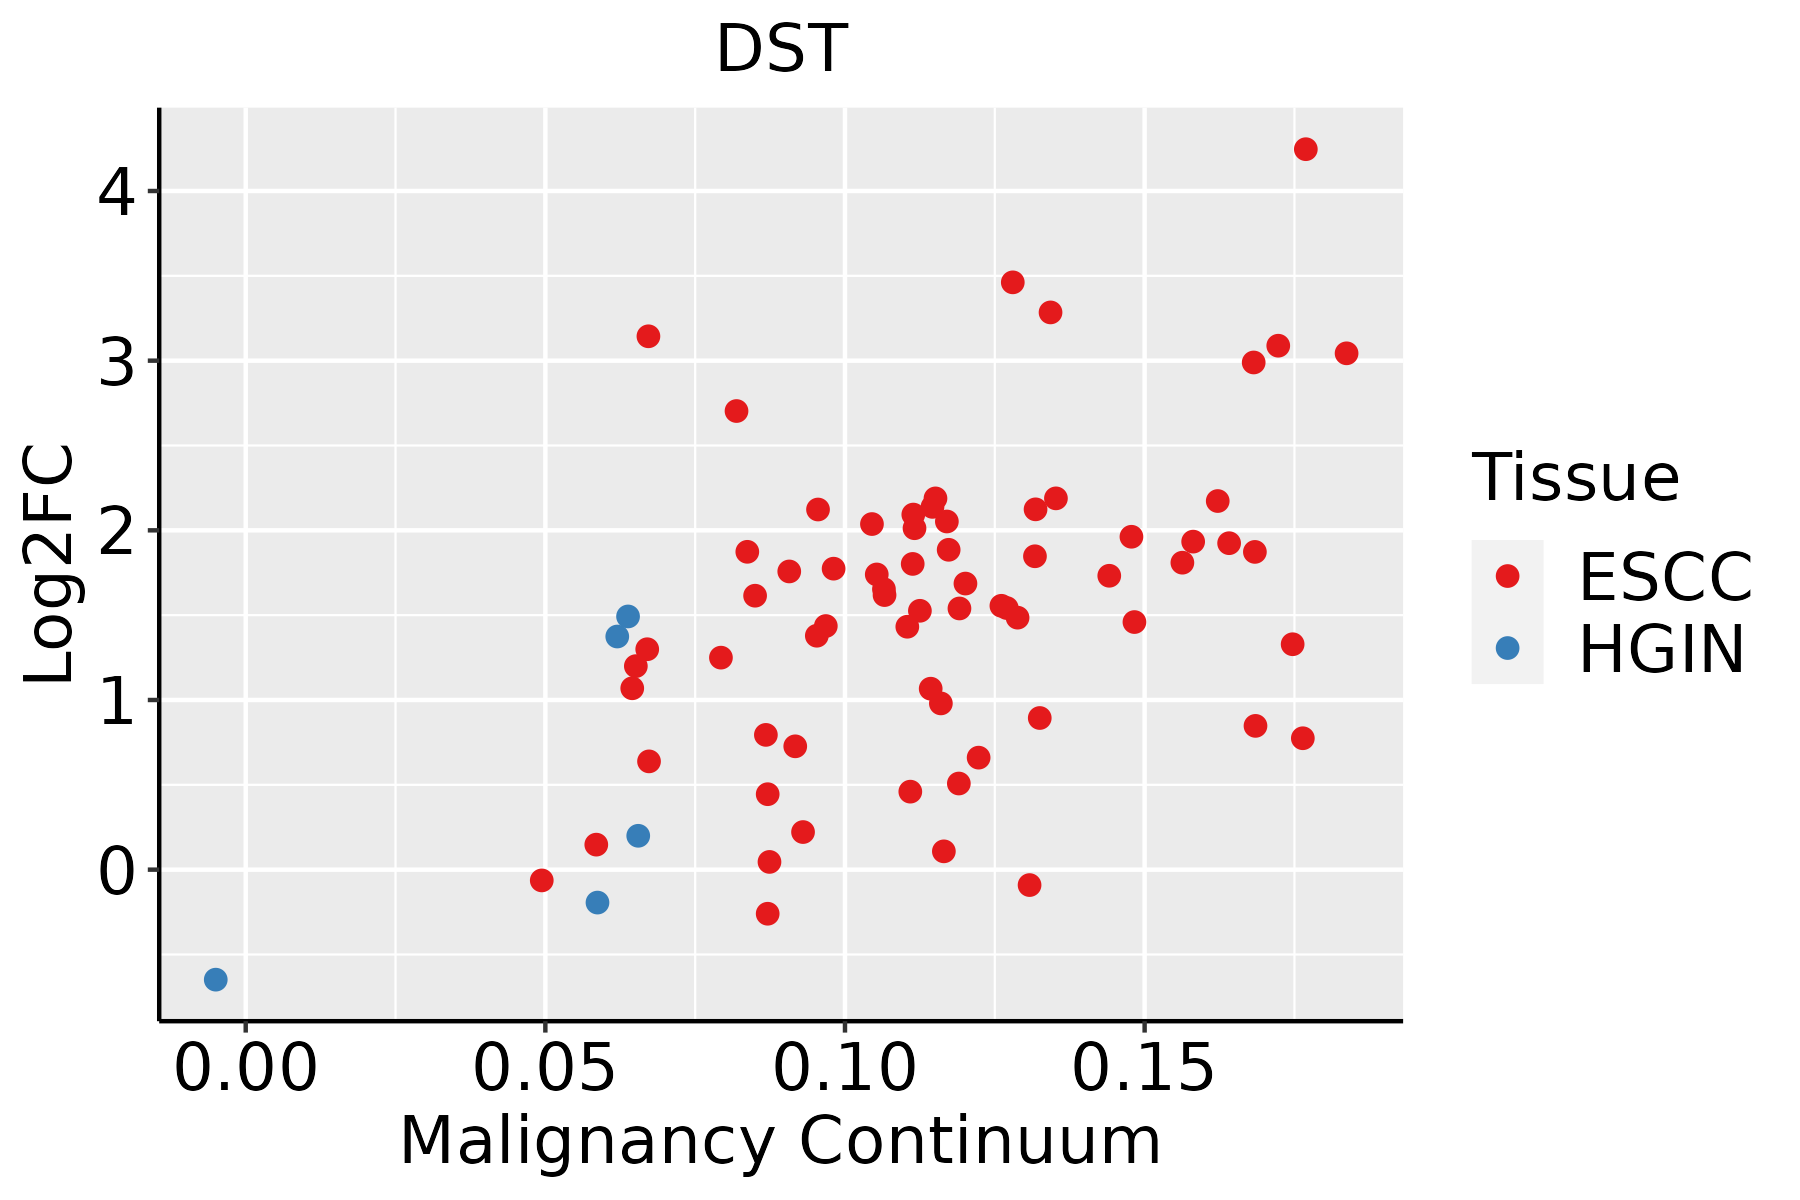
ESCC: Esophageal squamous cell carcinoma
HGIN: High-grade intraepithelial neoplasias
LGIN: Low-grade intraepithelial neoplasias
GCThe image shows the transcriptomic changes along malignancy continuum.log2FC in expression of this searched gene in stem-like cells from each diseased tissue sample relative to stem-like cells in normal samples in each tissue plotted against the malignancy continuum. Samples are colored based on if they are from different disease stage.
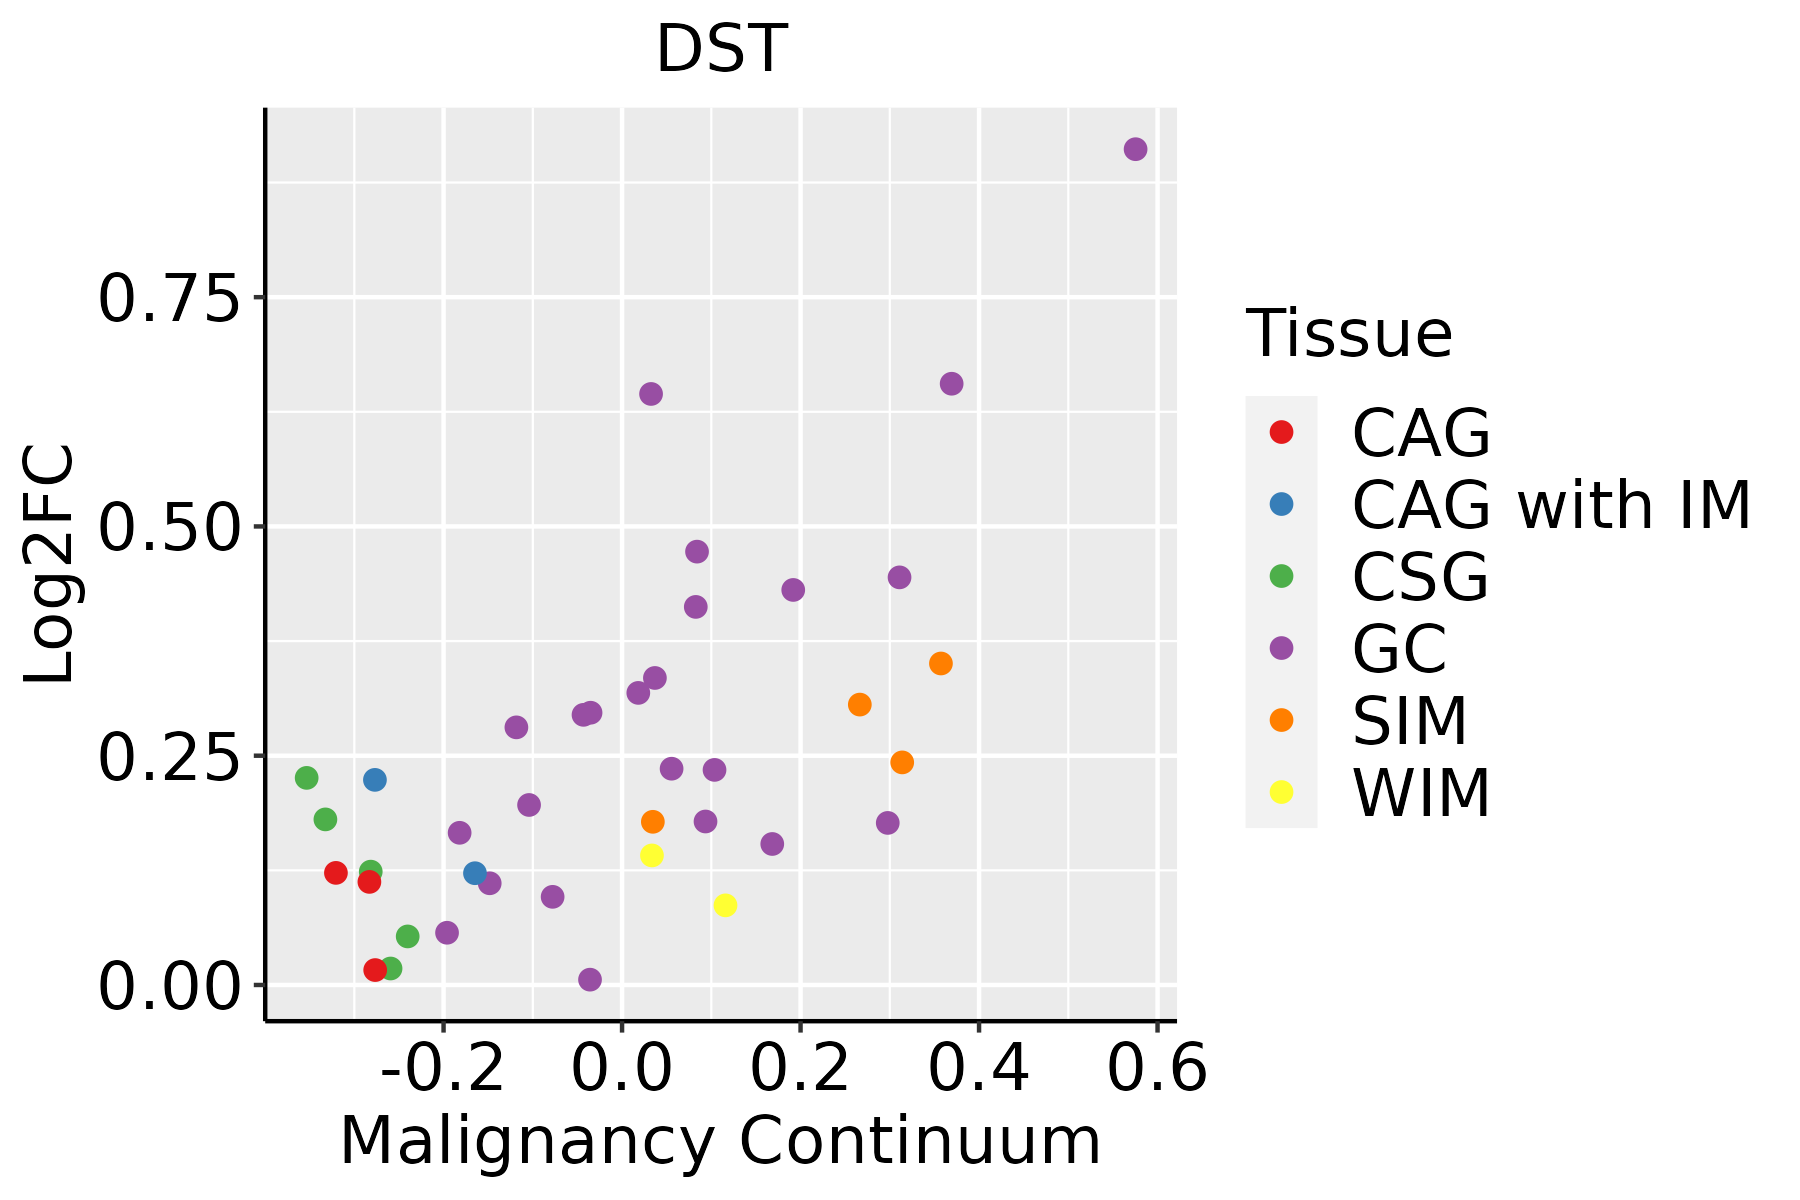
CAG: Chronic atrophic gastritis
CAG with IM: Chronic atrophic gastritis with intestinal metaplasia
CSG: Chronic superficial gastritis
GC: Gastric cancer
SIM: Severe intestinal metaplasia
WIM: Wild intestinal metaplasia
LiverThe image shows the transcriptomic changes along malignancy continuum.log2FC in expression of this searched gene in stem-like cells from each diseased tissue sample relative to stem-like cells in normal samples in each tissue plotted against the malignancy continuum. Samples are colored based on if they are from different disease stage.HCC: Hepatocellular carcinoma
NAFLD: Non-alcoholic fatty liver disease
LungThe image shows the transcriptomic changes along malignancy continuum.log2FC in expression of this searched gene in stem-like cells from each diseased tissue sample relative to stem-like cells in normal samples in each tissue plotted against the malignancy continuum. Samples are colored based on if they are from different disease stage.
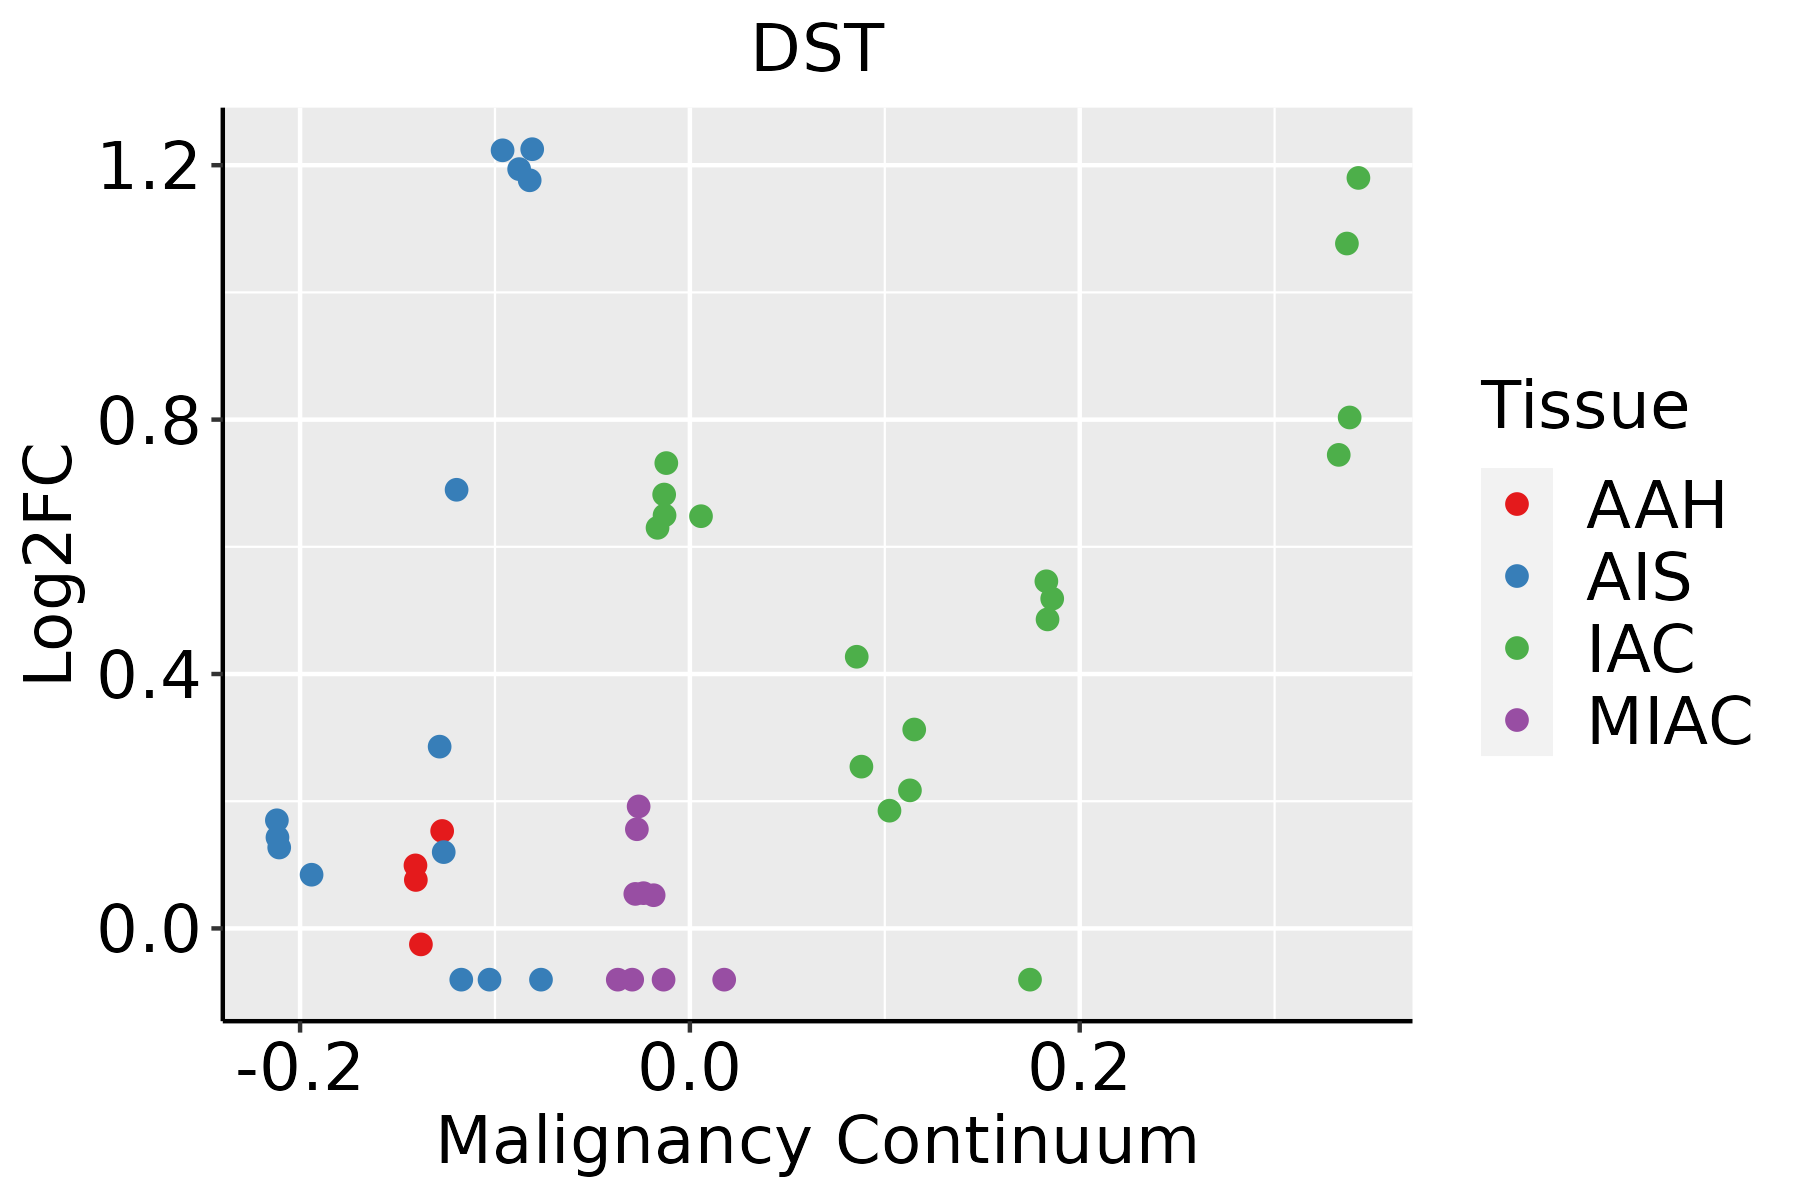
AAH: Atypical adenomatous hyperplasia
AIS: Adenocarcinoma in situ
IAC: Invasive lung adenocarcinoma
MIA: Minimally invasive adenocarcinoma
Oral CavityThe image shows the transcriptomic changes along malignancy continuum.log2FC in expression of this searched gene in stem-like cells from each diseased tissue sample relative to stem-like cells in normal samples in each tissue plotted against the malignancy continuum. Samples are colored based on if they are from different disease stage.EOLP: Erosive Oral lichen planus
LP: leukoplakia
NEOLP: Non-erosive oral lichen planus
OSCC: Oral squamous cell carcinoma
ProstateThe image shows the transcriptomic changes along malignancy continuum.log2FC in expression of this searched gene in stem-like cells from each diseased tissue sample relative to stem-like cells in normal samples in each tissue plotted against the malignancy continuum. Samples are colored based on if they are from different disease stage.
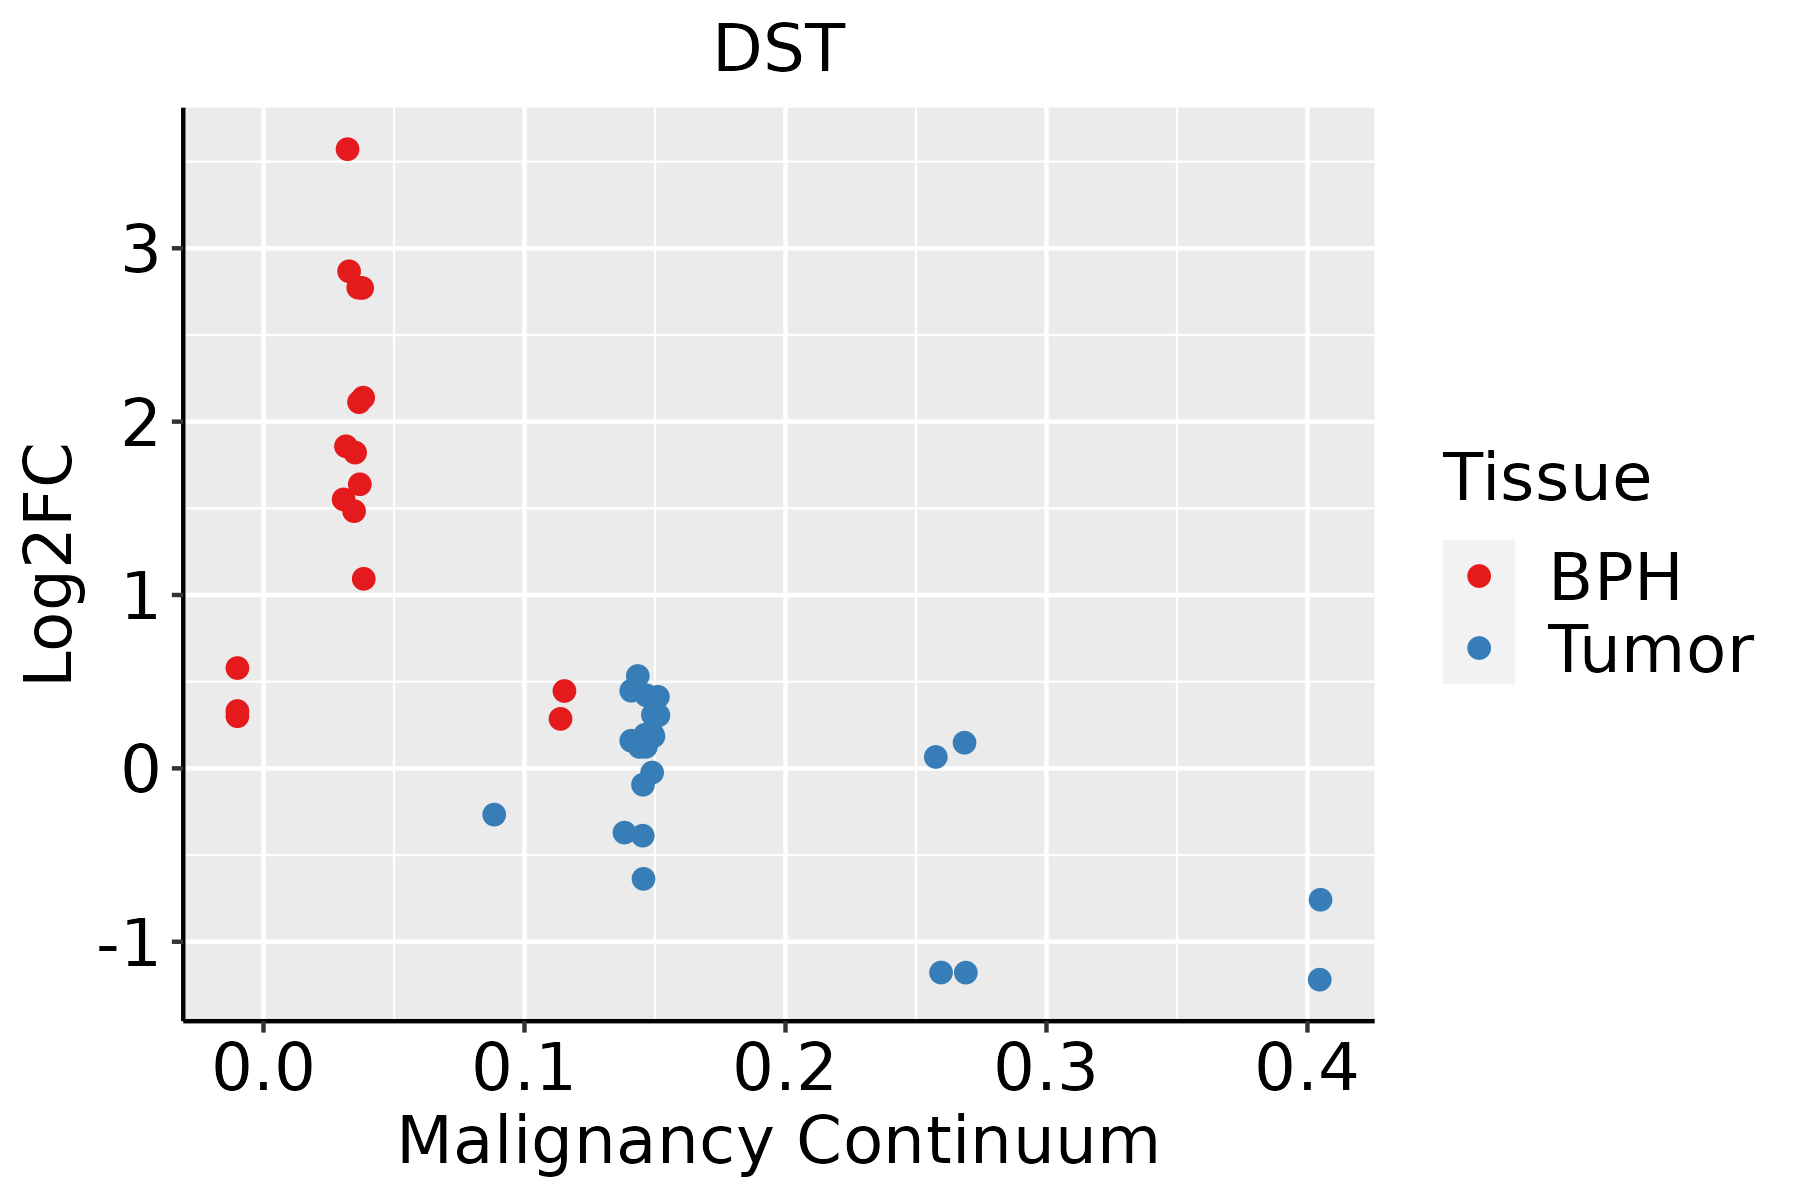
BPH: Benign Prostatic Hyperplasia
SkinThe image shows the transcriptomic changes along malignancy continuum.log2FC in expression of this searched gene in stem-like cells from each diseased tissue sample relative to stem-like cells in normal samples in each tissue plotted against the malignancy continuum. Samples are colored based on if they are from different disease stage.AK: Actinic keratosis
cSCC: Cutaneous squamous cell carcinoma
SCCIS:squamous cell carcinoma in situ
ThyroidThe image shows the transcriptomic changes along malignancy continuum.log2FC in expression of this searched gene in stem-like cells from each diseased tissue sample relative to stem-like cells in normal samples in each tissue plotted against the malignancy continuum. Samples are colored based on if they are from different disease stage.ATC: Anaplastic thyroid cancer
HT: Hashimoto's thyroiditis
PTC: Papillary thyroid cancer
∗log2FC in expression of this searched gene in stem-like cells from each diseased tissue sample relative to stem-like cells in normal samples in each tissue plotted against the malignancy continuum. Samples are colored based on if they are from different disease stage.

Top

Malignant transformation related pathway analysis

check buttonFind out the enriched GO biological processes and KEGG pathways involved in transition from healthy to precancer to cancer
check button Figure of enriched GO biological processes.
TissueDisease StageEnriched GO biological Processes
ColorectumADGO analysis - Figure of enriched GO biological processes: Top 15 enriched GO BP terms are showed in the bar plot of each disease state in each tissue. Each row represents a significant GO biological process which is colored according to the -log10(p.adjust).
ColorectumSERGO analysis - Figure of enriched GO biological processes: Top 15 enriched GO BP terms are showed in the bar plot of each disease state in each tissue. Each row represents a significant GO biological process which is colored according to the -log10(p.adjust).
ColorectumMSSGO analysis - Figure of enriched GO biological processes: Top 15 enriched GO BP terms are showed in the bar plot of each disease state in each tissue. Each row represents a significant GO biological process which is colored according to the -log10(p.adjust).
ColorectumMSI-HGO analysis - Figure of enriched GO biological processes: Top 15 enriched GO BP terms are showed in the bar plot of each disease state in each tissue. Each row represents a significant GO biological process which is colored according to the -log10(p.adjust).
ColorectumFAPGO analysis - Figure of enriched GO biological processes: Top 15 enriched GO BP terms are showed in the bar plot of each disease state in each tissue. Each row represents a significant GO biological process which is colored according to the -log10(p.adjust).
∗Top 15 enriched GO BP terms are showed in the bar plot of each disease state in each tissue. Each row represents a significant GO biological process which is colored according to the -log10(p.adjust).
Page: 1 2 3 4 5 6 7 8 9 

check button Enriched GO biological processes.
GO IDTissueDisease StageDescriptionGene RatioBg Ratiopvaluep.adjustCount
GO:00420609BreastPrecancerwound healing48/1080422/187235.48e-061.63e-0448
GO:19029059BreastPrecancerpositive regulation of supramolecular fiber organization28/1080209/187232.79e-056.28e-0428
GO:19029039BreastPrecancerregulation of supramolecular fiber organization42/1080383/187234.92e-051.04e-0342
GO:00329709BreastPrecancerregulation of actin filament-based process42/1080397/187231.11e-042.01e-0342
GO:00514959BreastPrecancerpositive regulation of cytoskeleton organization28/1080226/187231.13e-042.04e-0328
GO:0045104BreastPrecancerintermediate filament cytoskeleton organization11/108051/187231.26e-042.22e-0311
GO:0045103BreastPrecancerintermediate filament-based process11/108052/187231.52e-042.60e-0311
GO:00070159BreastPrecanceractin filament organization44/1080442/187233.02e-044.35e-0344
GO:00224119BreastPrecancercellular component disassembly44/1080443/187233.17e-044.51e-0344
GO:00329569BreastPrecancerregulation of actin cytoskeleton organization36/1080358/187238.56e-049.88e-0336
GO:01100539BreastPrecancerregulation of actin filament organization29/1080278/187231.50e-031.55e-0229
GO:00071638BreastPrecancerestablishment or maintenance of cell polarity23/1080218/187233.82e-033.06e-0223
GO:01501158BreastPrecancercell-substrate junction organization13/1080101/187235.30e-033.94e-0213
GO:190290514BreastIDCpositive regulation of supramolecular fiber organization37/1434209/187231.33e-065.75e-0537
GO:003297014BreastIDCregulation of actin filament-based process56/1434397/187236.37e-061.99e-0456
GO:190290314BreastIDCregulation of supramolecular fiber organization54/1434383/187239.40e-062.66e-0454
GO:005149513BreastIDCpositive regulation of cytoskeleton organization35/1434226/187235.04e-051.09e-0335
GO:004206014BreastIDCwound healing55/1434422/187237.27e-051.45e-0355
GO:003295614BreastIDCregulation of actin cytoskeleton organization48/1434358/187231.03e-041.96e-0348
GO:000701514BreastIDCactin filament organization55/1434442/187232.45e-043.84e-0355
Page: 1 2 3 4 5 6 7 8 9 10 11 12 13 14 15 16 17 18 19 20 21 22 23 24 25 26 27 28 29 30 31 32 33 34 35 36 

check button Enriched KEGG pathways.
Pathway IDTissueDisease StageDescriptionGene RatioBg Ratiopvaluep.adjustqvalueCount
Page: 1 

Top

Cell-cell communication analysis

check buttonIdentification of potential cell-cell interactions between two cell types and their ligand-receptor pairs for different disease states
LigandReceptorLRpairPathwayTissueDisease Stage
Page: 1 

Top

Single-cell gene regulatory network inference analysis

check buttonFind out the significant the regulons (TFs) and the target genes of each regulon across cell types for different disease states
TFCell TypeTissueDisease StageTarget GeneRSSRegulon Activity
∗The dot plots of a searched regulon are shown for all cell subpopulations in each disease state of each tissue based on the regulon specific score inferred using pySCENIC and by calculating the average expression.
Page: 1 

Top

Somatic mutation of malignant transformation related genes

check buttonAnnotation of somatic variants for genes involved in malignant transformation
Hugo SymbolVariant ClassVariant ClassificationdbSNP RSHGVScHGVSpHGVSp ShortSWISSPROTBIOTYPESIFTPolyPhenTumor Sample BarcodeTissueHistologySexAgeStageTherapy TypesDrugsOutcome
DSTSNVMissense_Mutationnovelc.3443N>Tp.Glu1148Valp.E1148Vprotein_codingdeleterious(0)probably_damaging(0.999)TCGA-A2-A0CR-01Breastbreast invasive carcinomaFemale<65I/IIChemotherapyadriamycinCR
DSTSNVMissense_Mutationnovelc.3442N>Cp.Glu1148Glnp.E1148Qprotein_codingdeleterious(0)probably_damaging(0.998)TCGA-A2-A0CR-01Breastbreast invasive carcinomaFemale<65I/IIChemotherapyadriamycinCR
DSTSNVMissense_Mutationc.10900N>Ap.Gln3634Lysp.Q3634Kprotein_codingdeleterious(0.02)benign(0.054)TCGA-A2-A1FZ-01Breastbreast invasive carcinomaFemale<65I/IIUnspecificArimidexSD
DSTSNVMissense_Mutationc.6277N>Ap.Glu2093Lysp.E2093Kprotein_codingtolerated(0.09)benign(0.087)TCGA-A8-A06X-01Breastbreast invasive carcinomaFemale>=65I/IIUnknownUnknownSD
DSTSNVMissense_Mutationc.15809C>Ap.Ser5270Tyrp.S5270Yprotein_codingdeleterious(0)probably_damaging(0.999)TCGA-A8-A09W-01Breastbreast invasive carcinomaFemale>=65III/IVUnknownUnknownSD
DSTSNVMissense_Mutationc.9694N>Tp.Gly3232Trpp.G3232Wprotein_codingdeleterious(0.01)probably_damaging(0.914)TCGA-A8-A09Z-01Breastbreast invasive carcinomaFemale>=65I/IIUnknownUnknownSD
DSTSNVMissense_Mutationrs758278474c.7219G>Ap.Ala2407Thrp.A2407Tprotein_codingtolerated(0.54)benign(0.011)TCGA-AC-A23H-01Breastbreast invasive carcinomaFemale>=65I/IIUnknownUnknownPD
DSTSNVMissense_Mutationc.6166G>Cp.Ala2056Prop.A2056Pprotein_codingtolerated(0.44)possibly_damaging(0.72)TCGA-AC-A23H-01Breastbreast invasive carcinomaFemale>=65I/IIUnknownUnknownPD
DSTSNVMissense_Mutationrs772972201c.8893G>Ap.Val2965Ilep.V2965Iprotein_codingtolerated(0.05)benign(0.273)TCGA-AN-A046-01Breastbreast invasive carcinomaFemale>=65I/IIUnknownUnknownSD
DSTSNVMissense_Mutationc.5275G>Ap.Glu1759Lysp.E1759Kprotein_codingtolerated(0.43)benign(0.404)TCGA-AN-A046-01Breastbreast invasive carcinomaFemale>=65I/IIUnknownUnknownSD
Page: 1 2 3 4 5 6 7 8 9 10 11 12 13 14 15 16 17 18 19 20 21 22 23 24 25 26 27 28 29 30 31 32 33 34 35 36 37 38 39 40 41 42 43 44 45 46 47 48 49 50 51 52 53 54 55 56 57 58 59 60 61 62 63 64 65 

Top

Related drugs of malignant transformation related genes

check buttonIdentification of chemicals and drugs interact with genes involved in malignant transfromation
(DGIdb 4.0)
Entrez IDSymbolCategoryInteraction TypesDrug Claim NameDrug NamePMIDs
Page: 1