
|
|||||
|
 | |
| |
| |
| |
| |
| |
|
Gene: DSN1 |
Gene summary for DSN1 |
| Gene information | Species | Human | Gene symbol | DSN1 | Gene ID | 79980 |
| Gene name | DSN1 component of MIS12 kinetochore complex | |
| Gene Alias | C20orf172 | |
| Cytomap | 20q11.23 | |
| Gene Type | protein-coding | GO ID | GO:0000070 | UniProtAcc | Q9H410 |
Top |
Malignant transformation analysis |
| Identification of the aberrant gene expression in precancerous and cancerous lesions by comparing the gene expression of stem-like cells in diseased tissues with normal stem cells |
| Entrez ID | Symbol | Replicates | Species | Organ | Tissue | Adj P-value | Log2FC | Malignancy |
| 79980 | DSN1 | LZE7T | Human | Esophagus | ESCC | 7.16e-06 | 2.82e-01 | 0.0667 |
| 79980 | DSN1 | LZE24T | Human | Esophagus | ESCC | 6.81e-22 | 6.15e-01 | 0.0596 |
| 79980 | DSN1 | P1T-E | Human | Esophagus | ESCC | 5.67e-06 | 3.96e-01 | 0.0875 |
| 79980 | DSN1 | P2T-E | Human | Esophagus | ESCC | 5.27e-18 | 5.21e-01 | 0.1177 |
| 79980 | DSN1 | P4T-E | Human | Esophagus | ESCC | 5.57e-05 | 1.84e-01 | 0.1323 |
| 79980 | DSN1 | P5T-E | Human | Esophagus | ESCC | 3.71e-09 | 1.62e-01 | 0.1327 |
| 79980 | DSN1 | P8T-E | Human | Esophagus | ESCC | 1.21e-11 | 3.37e-01 | 0.0889 |
| 79980 | DSN1 | P9T-E | Human | Esophagus | ESCC | 1.76e-06 | 2.21e-01 | 0.1131 |
| 79980 | DSN1 | P10T-E | Human | Esophagus | ESCC | 2.60e-09 | 3.06e-01 | 0.116 |
| 79980 | DSN1 | P11T-E | Human | Esophagus | ESCC | 5.44e-05 | 2.32e-01 | 0.1426 |
| 79980 | DSN1 | P12T-E | Human | Esophagus | ESCC | 2.43e-22 | 4.20e-01 | 0.1122 |
| 79980 | DSN1 | P15T-E | Human | Esophagus | ESCC | 6.20e-07 | 2.55e-01 | 0.1149 |
| 79980 | DSN1 | P16T-E | Human | Esophagus | ESCC | 3.77e-16 | 3.59e-01 | 0.1153 |
| 79980 | DSN1 | P17T-E | Human | Esophagus | ESCC | 5.44e-06 | 2.03e-01 | 0.1278 |
| 79980 | DSN1 | P20T-E | Human | Esophagus | ESCC | 2.89e-09 | 2.77e-01 | 0.1124 |
| 79980 | DSN1 | P21T-E | Human | Esophagus | ESCC | 1.72e-16 | 5.01e-01 | 0.1617 |
| 79980 | DSN1 | P22T-E | Human | Esophagus | ESCC | 1.25e-06 | 1.63e-01 | 0.1236 |
| 79980 | DSN1 | P23T-E | Human | Esophagus | ESCC | 2.15e-10 | 3.04e-01 | 0.108 |
| 79980 | DSN1 | P24T-E | Human | Esophagus | ESCC | 6.42e-08 | 2.35e-01 | 0.1287 |
| 79980 | DSN1 | P26T-E | Human | Esophagus | ESCC | 1.66e-12 | 3.57e-01 | 0.1276 |
| Page: 1 2 3 4 |
| Tissue | Expression Dynamics | Abbreviation |
| Esophagus | 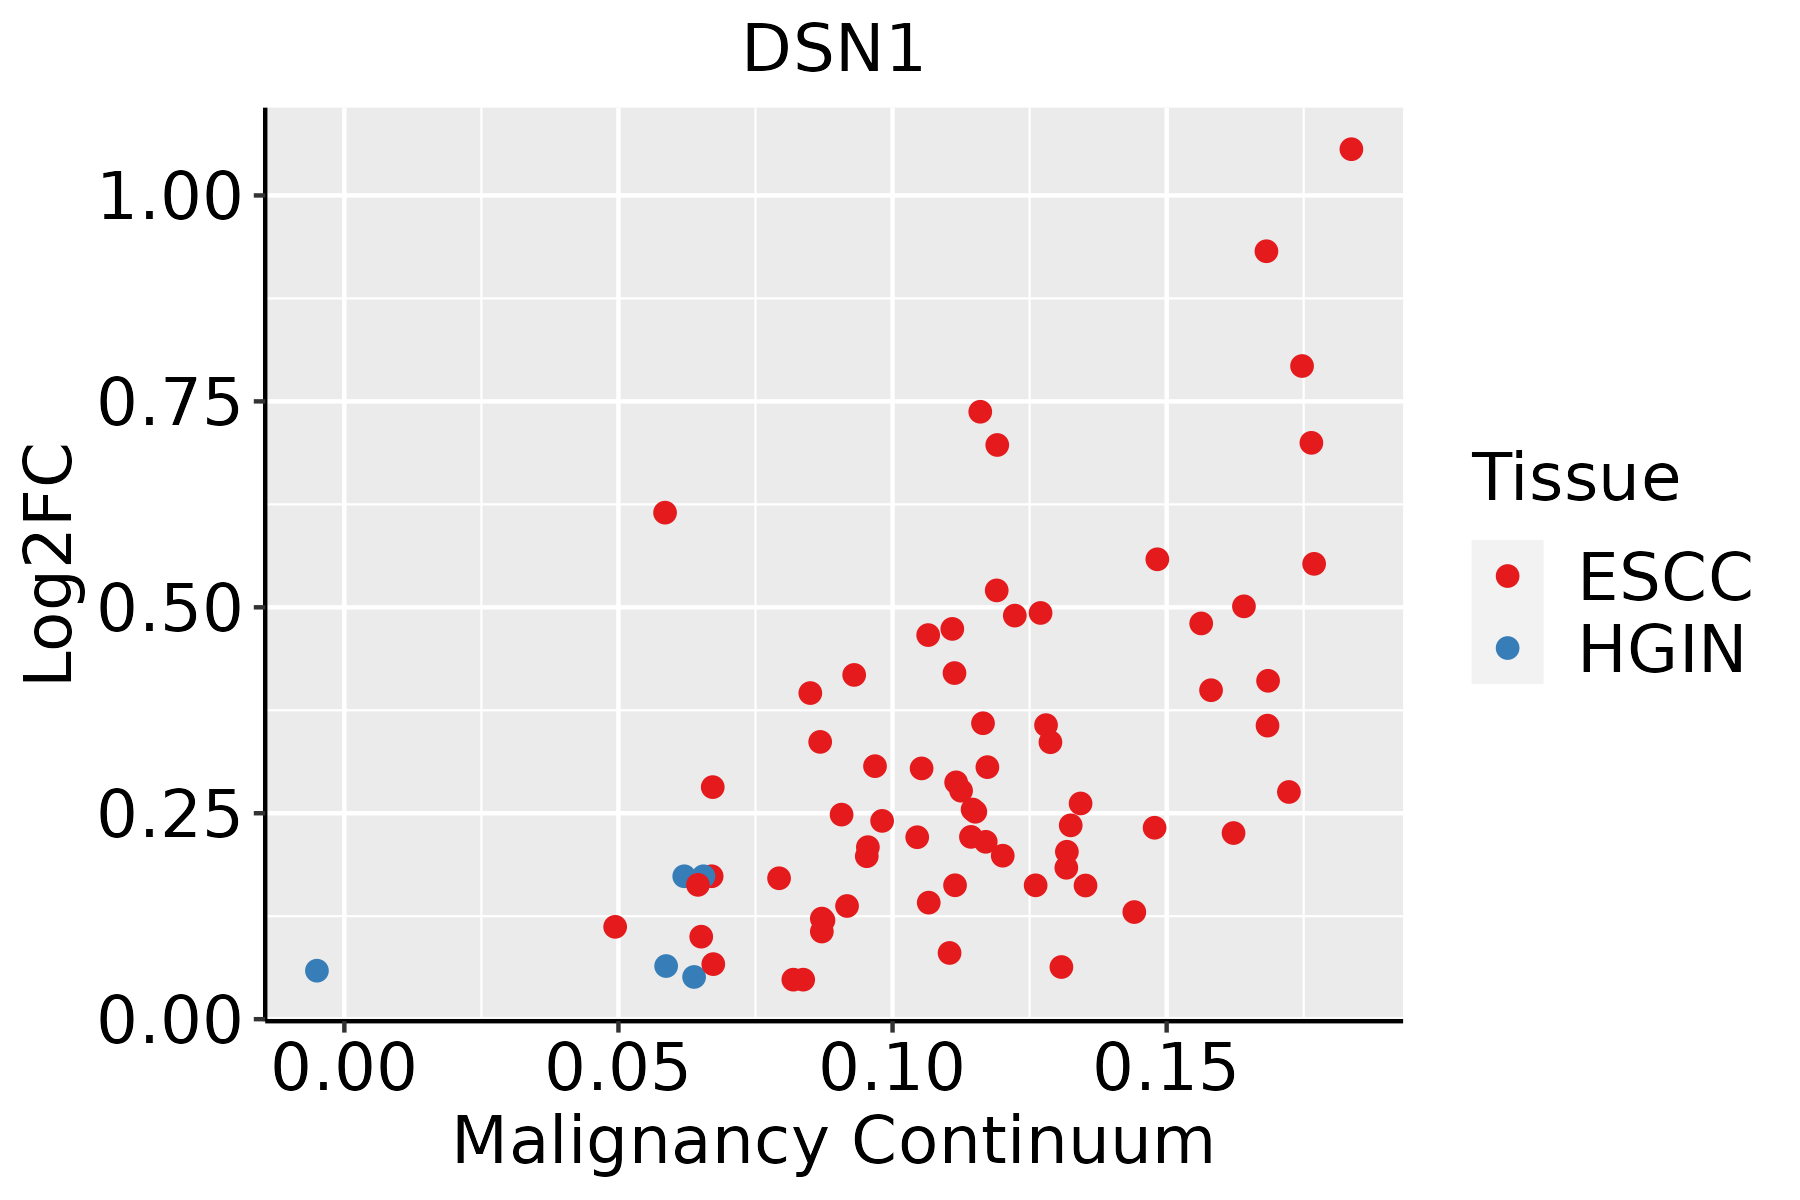 | ESCC: Esophageal squamous cell carcinoma |
| HGIN: High-grade intraepithelial neoplasias | ||
| LGIN: Low-grade intraepithelial neoplasias | ||
| Liver | 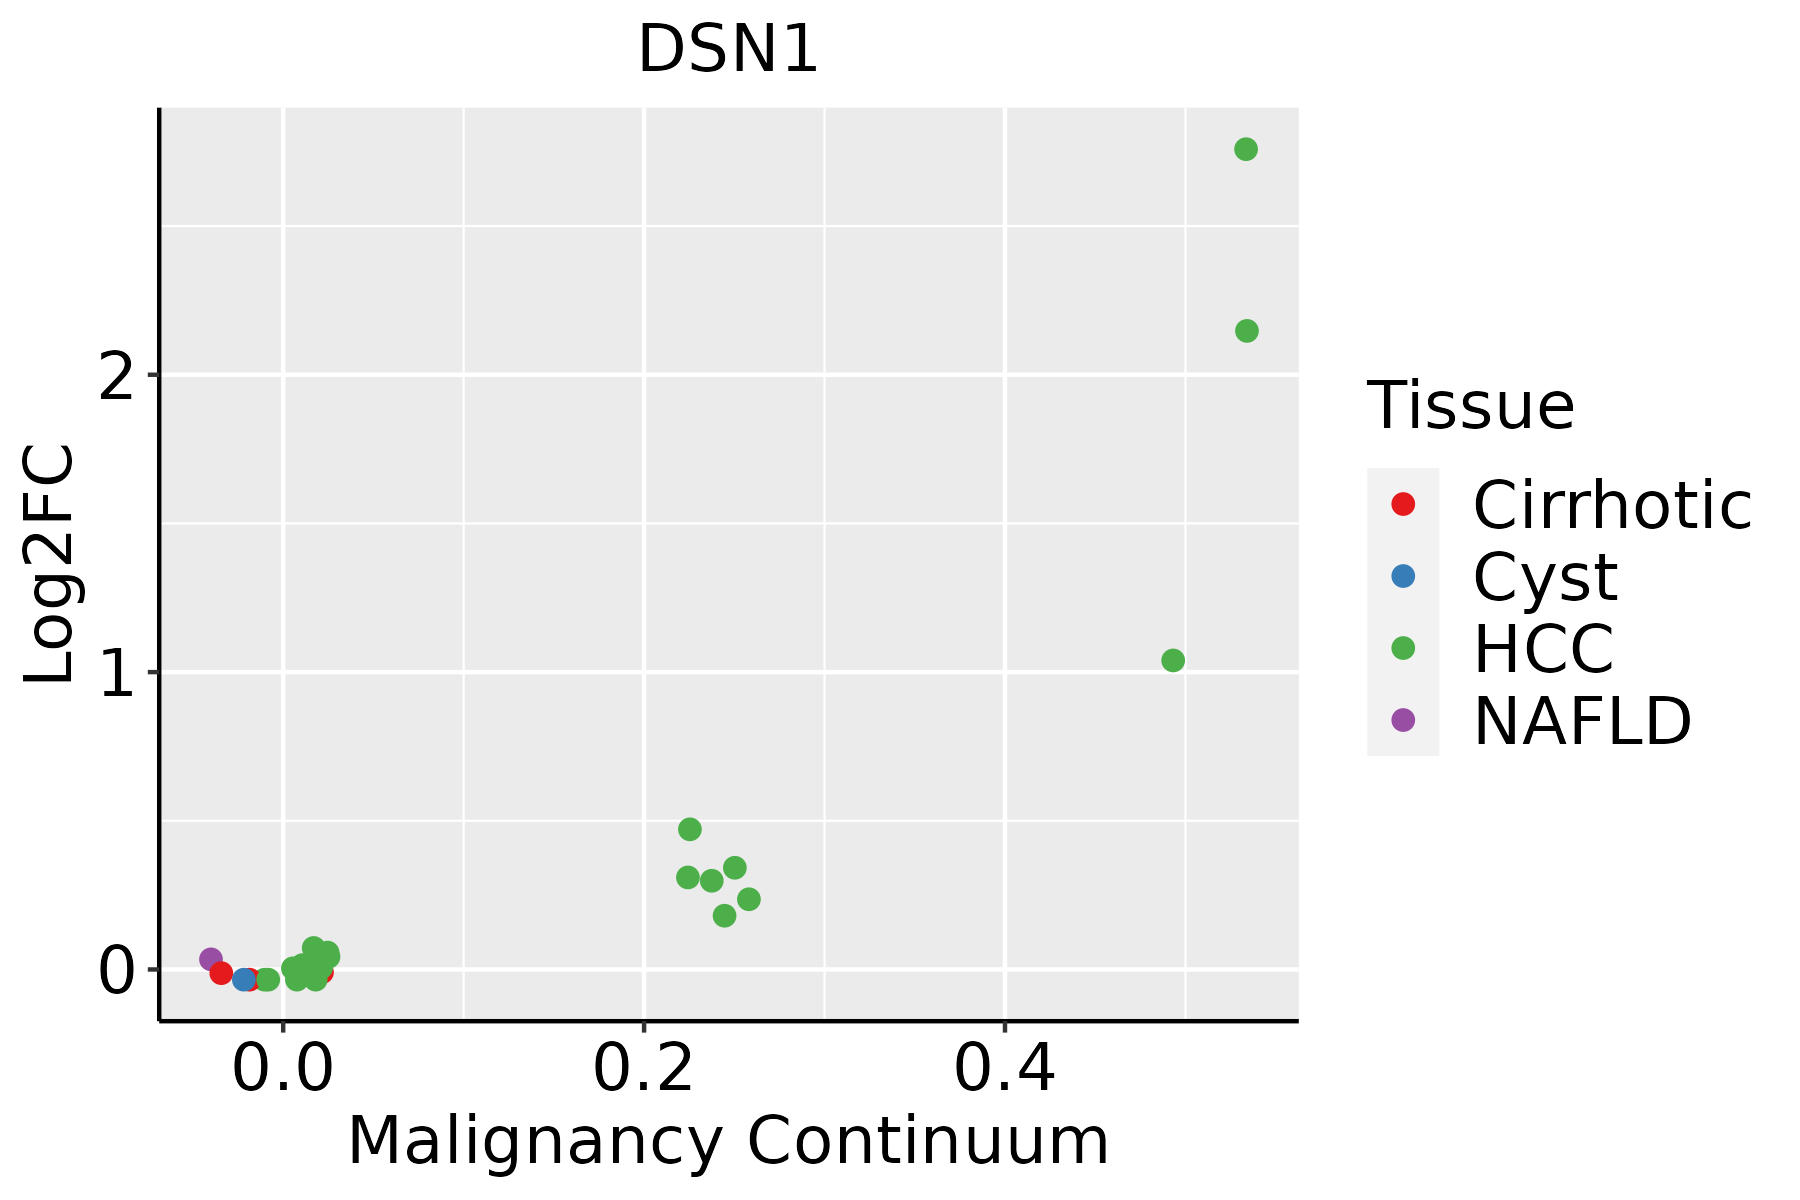 | HCC: Hepatocellular carcinoma |
| NAFLD: Non-alcoholic fatty liver disease | ||
| Oral Cavity | 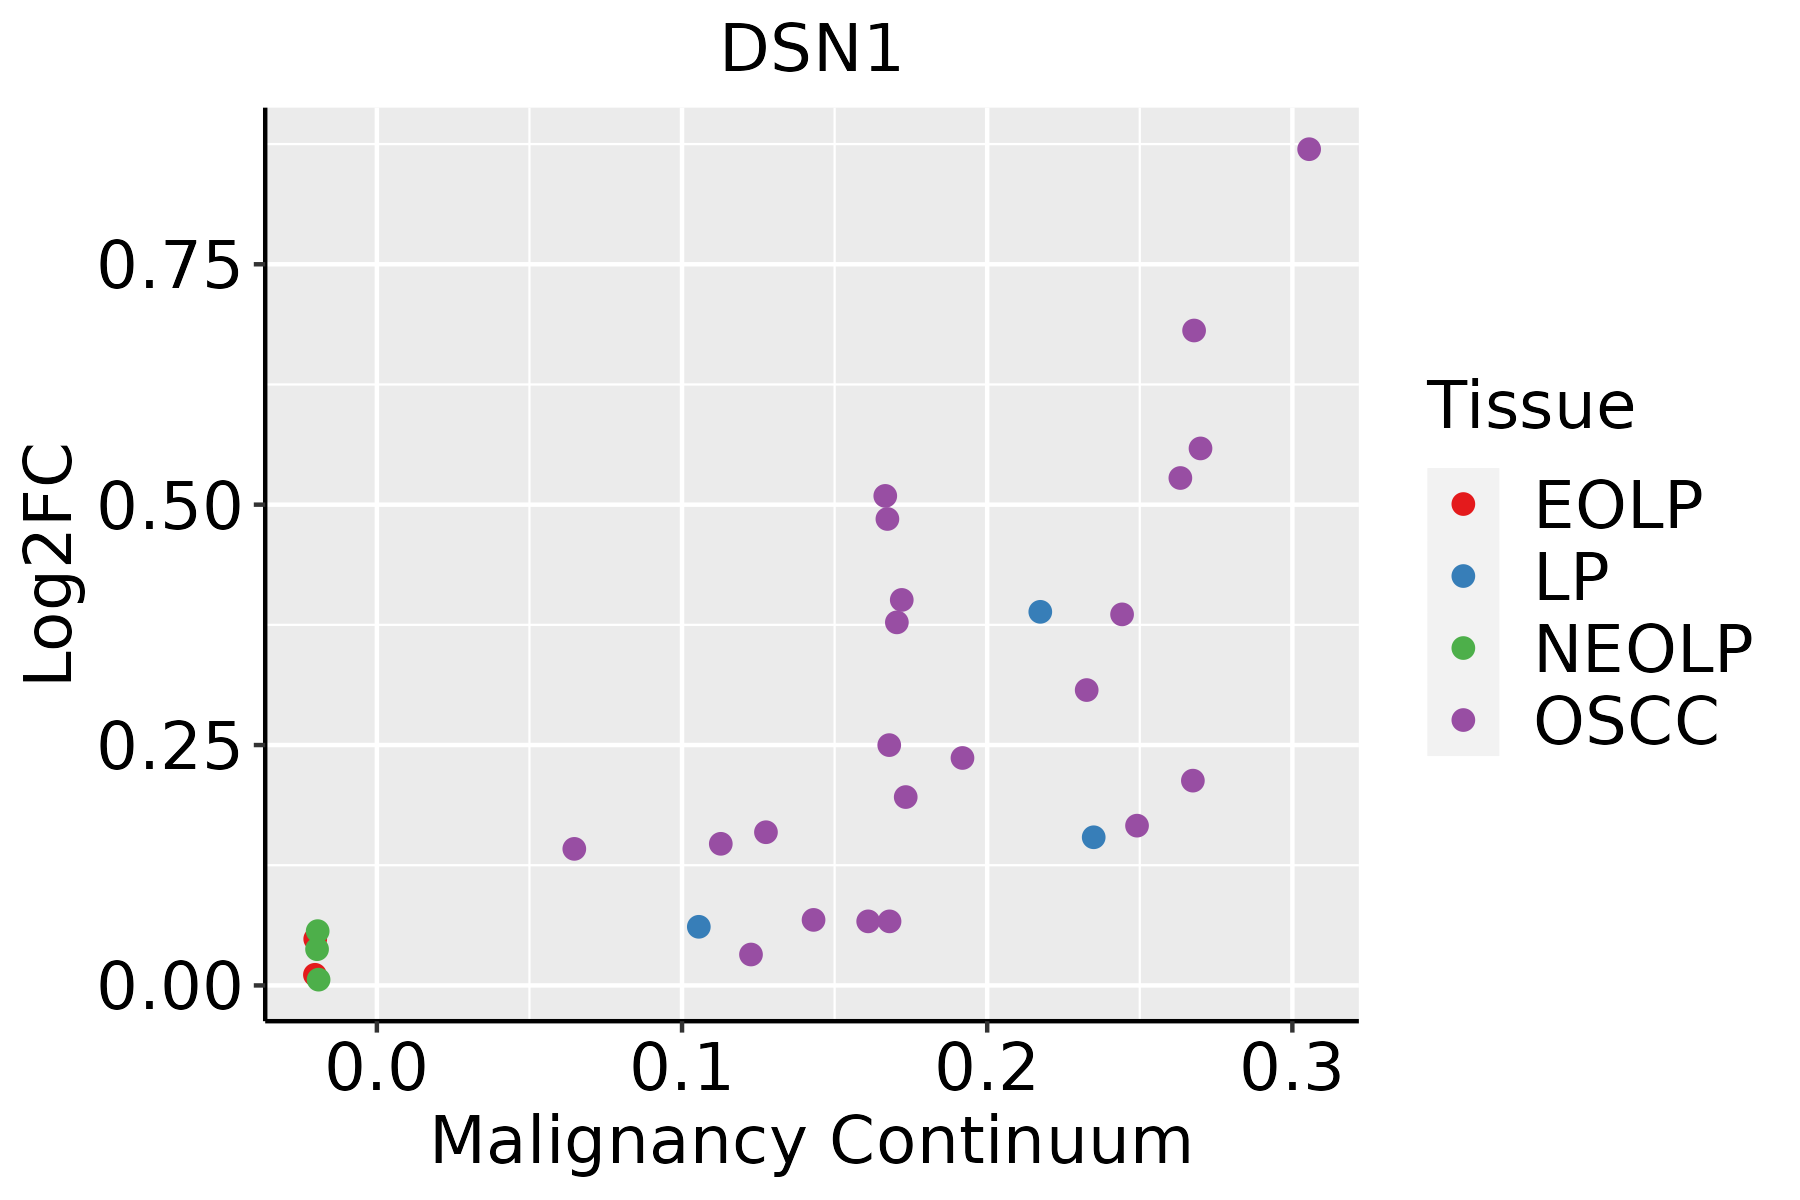 | EOLP: Erosive Oral lichen planus |
| LP: leukoplakia | ||
| NEOLP: Non-erosive oral lichen planus | ||
| OSCC: Oral squamous cell carcinoma |
| ∗log2FC in expression of this searched gene in stem-like cells from each diseased tissue sample relative to stem-like cells in normal samples in each tissue plotted against the malignancy continuum. Samples are colored based on if they are from different disease stage. |
Top |
Malignant transformation related pathway analysis |
| Find out the enriched GO biological processes and KEGG pathways involved in transition from healthy to precancer to cancer |
| Tissue | Disease Stage | Enriched GO biological Processes |
| Colorectum | AD |  |
| Colorectum | SER |  |
| Colorectum | MSS |  |
| Colorectum | MSI-H |  |
| Colorectum | FAP |  |
| ∗Top 15 enriched GO BP terms are showed in the bar plot of each disease state in each tissue. Each row represents a significant GO biological process which is colored according to the -log10(p.adjust). |
| Page: 1 2 3 4 5 6 7 8 9 |
| GO ID | Tissue | Disease Stage | Description | Gene Ratio | Bg Ratio | pvalue | p.adjust | Count |
| GO:014001414 | Esophagus | ESCC | mitotic nuclear division | 218/8552 | 287/18723 | 6.17e-26 | 1.78e-23 | 218 |
| GO:000007011 | Esophagus | ESCC | mitotic sister chromatid segregation | 138/8552 | 168/18723 | 1.37e-22 | 2.63e-20 | 138 |
| GO:00008194 | Esophagus | ESCC | sister chromatid segregation | 157/8552 | 202/18723 | 8.41e-21 | 1.33e-18 | 157 |
| GO:000705911 | Esophagus | ESCC | chromosome segregation | 238/8552 | 346/18723 | 1.72e-18 | 1.82e-16 | 238 |
| GO:00482853 | Esophagus | ESCC | organelle fission | 301/8552 | 488/18723 | 4.64e-13 | 2.12e-11 | 301 |
| GO:00988133 | Esophagus | ESCC | nuclear chromosome segregation | 187/8552 | 281/18723 | 1.00e-12 | 4.36e-11 | 187 |
| GO:00002802 | Esophagus | ESCC | nuclear division | 270/8552 | 439/18723 | 1.17e-11 | 4.24e-10 | 270 |
| GO:014001411 | Liver | HCC | mitotic nuclear division | 174/7958 | 287/18723 | 3.74e-10 | 1.23e-08 | 174 |
| GO:0000070 | Liver | HCC | mitotic sister chromatid segregation | 110/7958 | 168/18723 | 1.42e-09 | 4.25e-08 | 110 |
| GO:00008191 | Liver | HCC | sister chromatid segregation | 128/7958 | 202/18723 | 1.59e-09 | 4.73e-08 | 128 |
| GO:0007059 | Liver | HCC | chromosome segregation | 197/7958 | 346/18723 | 3.57e-08 | 7.87e-07 | 197 |
| GO:0098813 | Liver | HCC | nuclear chromosome segregation | 157/7958 | 281/18723 | 3.82e-06 | 4.95e-05 | 157 |
| GO:0048285 | Liver | HCC | organelle fission | 254/7958 | 488/18723 | 1.07e-05 | 1.23e-04 | 254 |
| GO:0000280 | Liver | HCC | nuclear division | 220/7958 | 439/18723 | 6.90e-04 | 4.25e-03 | 220 |
| GO:01400145 | Oral cavity | OSCC | mitotic nuclear division | 191/7305 | 287/18723 | 1.99e-21 | 3.70e-19 | 191 |
| GO:00000702 | Oral cavity | OSCC | mitotic sister chromatid segregation | 118/7305 | 168/18723 | 1.89e-16 | 1.48e-14 | 118 |
| GO:00008193 | Oral cavity | OSCC | sister chromatid segregation | 135/7305 | 202/18723 | 8.88e-16 | 6.52e-14 | 135 |
| GO:00070592 | Oral cavity | OSCC | chromosome segregation | 206/7305 | 346/18723 | 5.82e-15 | 3.76e-13 | 206 |
| GO:00482852 | Oral cavity | OSCC | organelle fission | 265/7305 | 488/18723 | 3.22e-12 | 1.27e-10 | 265 |
| GO:00002801 | Oral cavity | OSCC | nuclear division | 237/7305 | 439/18723 | 9.62e-11 | 2.90e-09 | 237 |
| Page: 1 2 |
| Pathway ID | Tissue | Disease Stage | Description | Gene Ratio | Bg Ratio | pvalue | p.adjust | qvalue | Count |
| Page: 1 |
Top |
Cell-cell communication analysis |
| Identification of potential cell-cell interactions between two cell types and their ligand-receptor pairs for different disease states |
| Ligand | Receptor | LRpair | Pathway | Tissue | Disease Stage |
| Page: 1 |
Top |
Single-cell gene regulatory network inference analysis |
| Find out the significant the regulons (TFs) and the target genes of each regulon across cell types for different disease states |
| TF | Cell Type | Tissue | Disease Stage | Target Gene | RSS | Regulon Activity |
| ∗The dot plots of a searched regulon are shown for all cell subpopulations in each disease state of each tissue based on the regulon specific score inferred using pySCENIC and by calculating the average expression. |
| Page: 1 |
Top |
Somatic mutation of malignant transformation related genes |
| Annotation of somatic variants for genes involved in malignant transformation |
| Hugo Symbol | Variant Class | Variant Classification | dbSNP RS | HGVSc | HGVSp | HGVSp Short | SWISSPROT | BIOTYPE | SIFT | PolyPhen | Tumor Sample Barcode | Tissue | Histology | Sex | Age | Stage | Therapy Types | Drugs | Outcome |
| DSN1 | SNV | Missense_Mutation | c.188G>A | p.Gly63Glu | p.G63E | Q9H410 | protein_coding | tolerated_low_confidence(1) | benign(0) | TCGA-AO-A128-01 | Breast | breast invasive carcinoma | Female | <65 | I/II | Chemotherapy | doxorubicin | SD | |
| DSN1 | SNV | Missense_Mutation | novel | c.658T>G | p.Leu220Val | p.L220V | Q9H410 | protein_coding | tolerated(0.37) | possibly_damaging(0.519) | TCGA-BH-A5J0-01 | Breast | breast invasive carcinoma | Female | <65 | I/II | Unknown | Unknown | SD |
| DSN1 | SNV | Missense_Mutation | novel | c.535N>A | p.Ala179Thr | p.A179T | Q9H410 | protein_coding | tolerated(0.78) | benign(0.007) | TCGA-2W-A8YY-01 | Cervix | cervical & endocervical cancer | Female | <65 | I/II | Chemotherapy | cisplatin | CR |
| DSN1 | SNV | Missense_Mutation | rs758441579 | c.373A>G | p.Ser125Gly | p.S125G | Q9H410 | protein_coding | deleterious(0.02) | probably_damaging(0.996) | TCGA-DS-A1OC-01 | Cervix | cervical & endocervical cancer | Female | <65 | I/II | Chemotherapy | gemcitabine | SD |
| DSN1 | SNV | Missense_Mutation | c.841C>A | p.Gln281Lys | p.Q281K | Q9H410 | protein_coding | deleterious(0) | possibly_damaging(0.672) | TCGA-EK-A2RN-01 | Cervix | cervical & endocervical cancer | Female | <65 | I/II | Unknown | Unknown | SD | |
| DSN1 | SNV | Missense_Mutation | c.520N>A | p.Glu174Lys | p.E174K | Q9H410 | protein_coding | tolerated(0.09) | probably_damaging(0.975) | TCGA-IR-A3LA-01 | Cervix | cervical & endocervical cancer | Female | <65 | I/II | Chemotherapy | cisplatin | CR | |
| DSN1 | SNV | Missense_Mutation | rs552571192 | c.142N>A | p.Val48Ile | p.V48I | Q9H410 | protein_coding | tolerated_low_confidence(0.51) | benign(0.003) | TCGA-A6-A565-01 | Colorectum | colon adenocarcinoma | Female | <65 | III/IV | Unspecific | 5FU | PD |
| DSN1 | SNV | Missense_Mutation | c.150N>T | p.Glu50Asp | p.E50D | Q9H410 | protein_coding | deleterious_low_confidence(0.02) | benign(0.018) | TCGA-AA-3977-01 | Colorectum | colon adenocarcinoma | Male | >=65 | I/II | Unknown | Unknown | SD | |
| DSN1 | SNV | Missense_Mutation | c.335N>A | p.Pro112His | p.P112H | Q9H410 | protein_coding | deleterious(0) | probably_damaging(0.967) | TCGA-AZ-4615-01 | Colorectum | colon adenocarcinoma | Male | >=65 | III/IV | Chemotherapy | xeloda | PD | |
| DSN1 | SNV | Missense_Mutation | rs761761654 | c.665N>A | p.Arg222His | p.R222H | Q9H410 | protein_coding | tolerated(0.25) | probably_damaging(0.973) | TCGA-G4-6588-01 | Colorectum | colon adenocarcinoma | Female | <65 | I/II | Unknown | Unknown | SD |
| Page: 1 2 3 |
Top |
Related drugs of malignant transformation related genes |
| Identification of chemicals and drugs interact with genes involved in malignant transfromation |
| (DGIdb 4.0) |
| Entrez ID | Symbol | Category | Interaction Types | Drug Claim Name | Drug Name | PMIDs |
| Page: 1 |

Copyright 2023-Present -The University of Texas Health Science Center at Houston |