
|
|||||
|
 | |
| |
| |
| |
| |
| |
|
Gene: DSG2 |
Gene summary for DSG2 |
| Gene information | Species | Human | Gene symbol | DSG2 | Gene ID | 1829 |
| Gene name | desmoglein 2 | |
| Gene Alias | CDHF5 | |
| Cytomap | 18q12.1 | |
| Gene Type | protein-coding | GO ID | GO:0001508 | UniProtAcc | Q14126 |
Top |
Malignant transformation analysis |
| Identification of the aberrant gene expression in precancerous and cancerous lesions by comparing the gene expression of stem-like cells in diseased tissues with normal stem cells |
| Entrez ID | Symbol | Replicates | Species | Organ | Tissue | Adj P-value | Log2FC | Malignancy |
| 1829 | DSG2 | HTA11_1938_2000001011 | Human | Colorectum | AD | 1.72e-05 | 6.78e-01 | -0.0811 |
| 1829 | DSG2 | HTA11_78_2000001011 | Human | Colorectum | AD | 5.26e-07 | 7.27e-01 | -0.1088 |
| 1829 | DSG2 | HTA11_347_2000001011 | Human | Colorectum | AD | 2.12e-24 | 9.43e-01 | -0.1954 |
| 1829 | DSG2 | HTA11_411_2000001011 | Human | Colorectum | SER | 1.19e-02 | 9.98e-01 | -0.2602 |
| 1829 | DSG2 | HTA11_6801_2000001011 | Human | Colorectum | SER | 4.90e-02 | 7.10e-01 | 0.0171 |
| 1829 | DSG2 | HTA11_99999970781_79442 | Human | Colorectum | MSS | 1.46e-05 | 6.17e-01 | 0.294 |
| 1829 | DSG2 | HTA11_99999965104_69814 | Human | Colorectum | MSS | 8.26e-15 | 9.70e-01 | 0.281 |
| 1829 | DSG2 | F007 | Human | Colorectum | FAP | 1.23e-06 | -4.30e-01 | 0.1176 |
| 1829 | DSG2 | A001-C-207 | Human | Colorectum | FAP | 2.24e-05 | -2.61e-01 | 0.1278 |
| 1829 | DSG2 | A015-C-203 | Human | Colorectum | FAP | 8.39e-23 | -3.79e-01 | -0.1294 |
| 1829 | DSG2 | A015-C-204 | Human | Colorectum | FAP | 8.04e-08 | -2.37e-01 | -0.0228 |
| 1829 | DSG2 | A014-C-040 | Human | Colorectum | FAP | 5.29e-07 | -5.84e-01 | -0.1184 |
| 1829 | DSG2 | A002-C-201 | Human | Colorectum | FAP | 6.50e-15 | -3.12e-01 | 0.0324 |
| 1829 | DSG2 | A002-C-203 | Human | Colorectum | FAP | 2.83e-03 | -7.05e-02 | 0.2786 |
| 1829 | DSG2 | A001-C-119 | Human | Colorectum | FAP | 1.47e-08 | -4.15e-01 | -0.1557 |
| 1829 | DSG2 | A001-C-108 | Human | Colorectum | FAP | 8.08e-15 | -2.54e-01 | -0.0272 |
| 1829 | DSG2 | A002-C-205 | Human | Colorectum | FAP | 7.55e-21 | -3.80e-01 | -0.1236 |
| 1829 | DSG2 | A014-C-108 | Human | Colorectum | FAP | 4.49e-03 | -3.50e-01 | -0.124 |
| 1829 | DSG2 | A001-C-104 | Human | Colorectum | FAP | 2.92e-03 | -2.44e-01 | 0.0184 |
| 1829 | DSG2 | A015-C-005 | Human | Colorectum | FAP | 7.71e-04 | -1.75e-01 | -0.0336 |
| Page: 1 2 3 4 5 6 7 8 9 |
| Tissue | Expression Dynamics | Abbreviation |
| Colorectum (GSE201348) |  | FAP: Familial adenomatous polyposis |
| CRC: Colorectal cancer | ||
| Colorectum (HTA11) |  | AD: Adenomas |
| SER: Sessile serrated lesions | ||
| MSI-H: Microsatellite-high colorectal cancer | ||
| MSS: Microsatellite stable colorectal cancer | ||
| Esophagus | 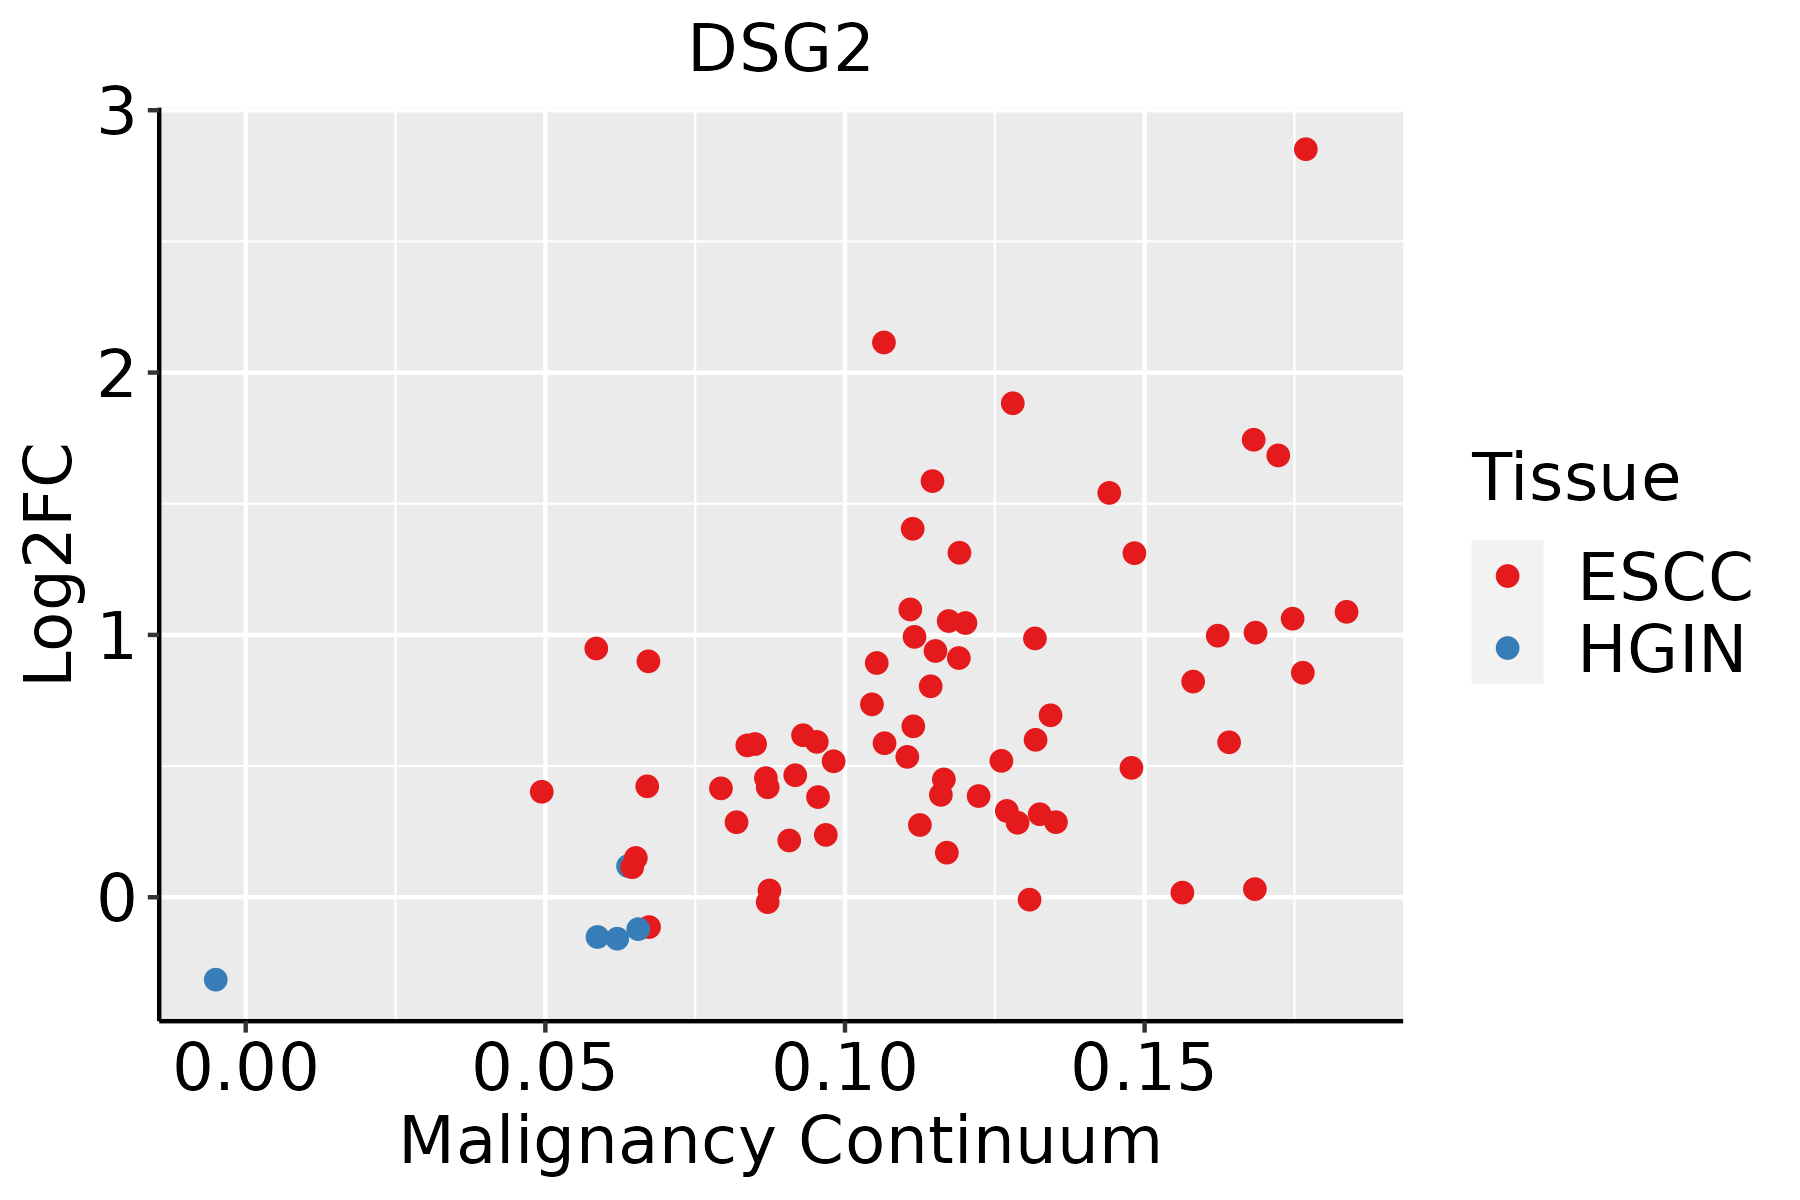 | ESCC: Esophageal squamous cell carcinoma |
| HGIN: High-grade intraepithelial neoplasias | ||
| LGIN: Low-grade intraepithelial neoplasias | ||
| Liver |  | HCC: Hepatocellular carcinoma |
| NAFLD: Non-alcoholic fatty liver disease | ||
| Oral Cavity | 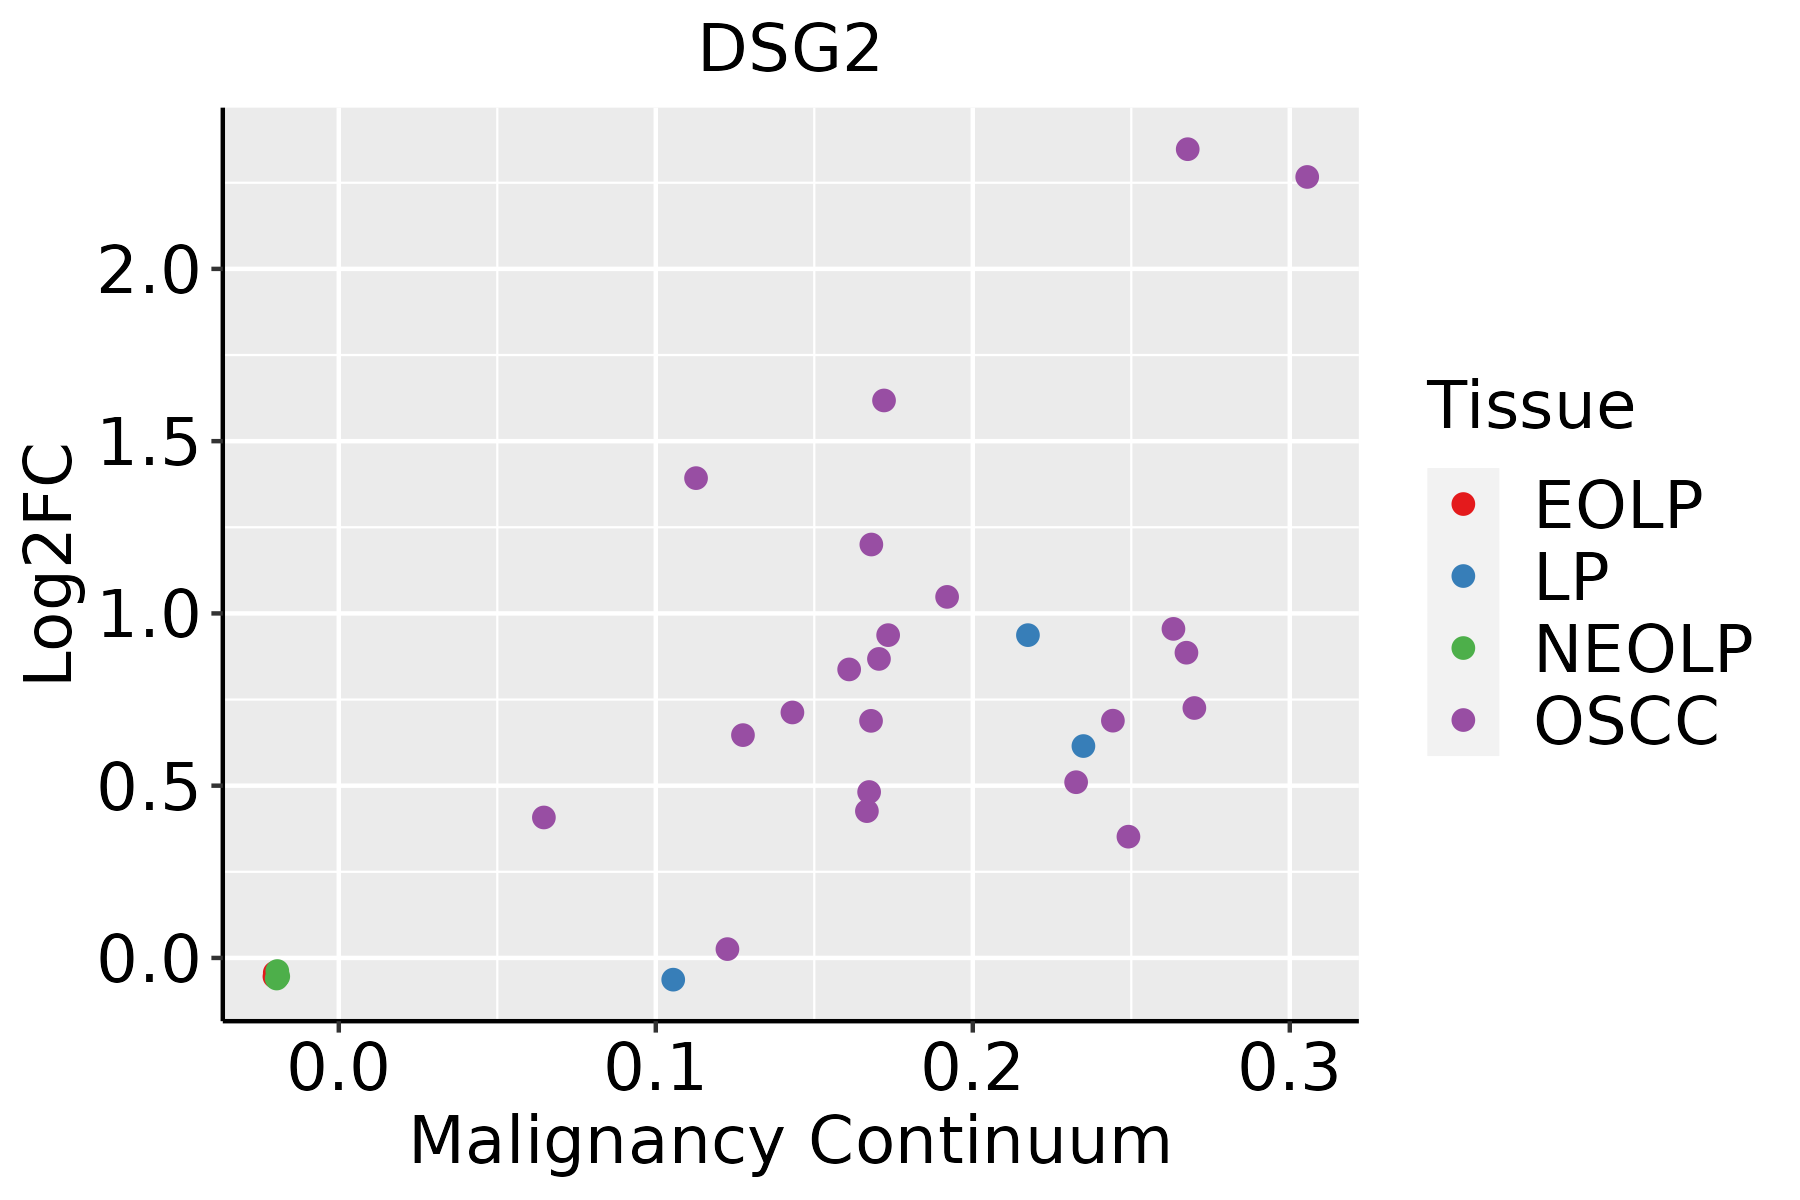 | EOLP: Erosive Oral lichen planus |
| LP: leukoplakia | ||
| NEOLP: Non-erosive oral lichen planus | ||
| OSCC: Oral squamous cell carcinoma | ||
| Prostate |  | BPH: Benign Prostatic Hyperplasia |
| Skin | 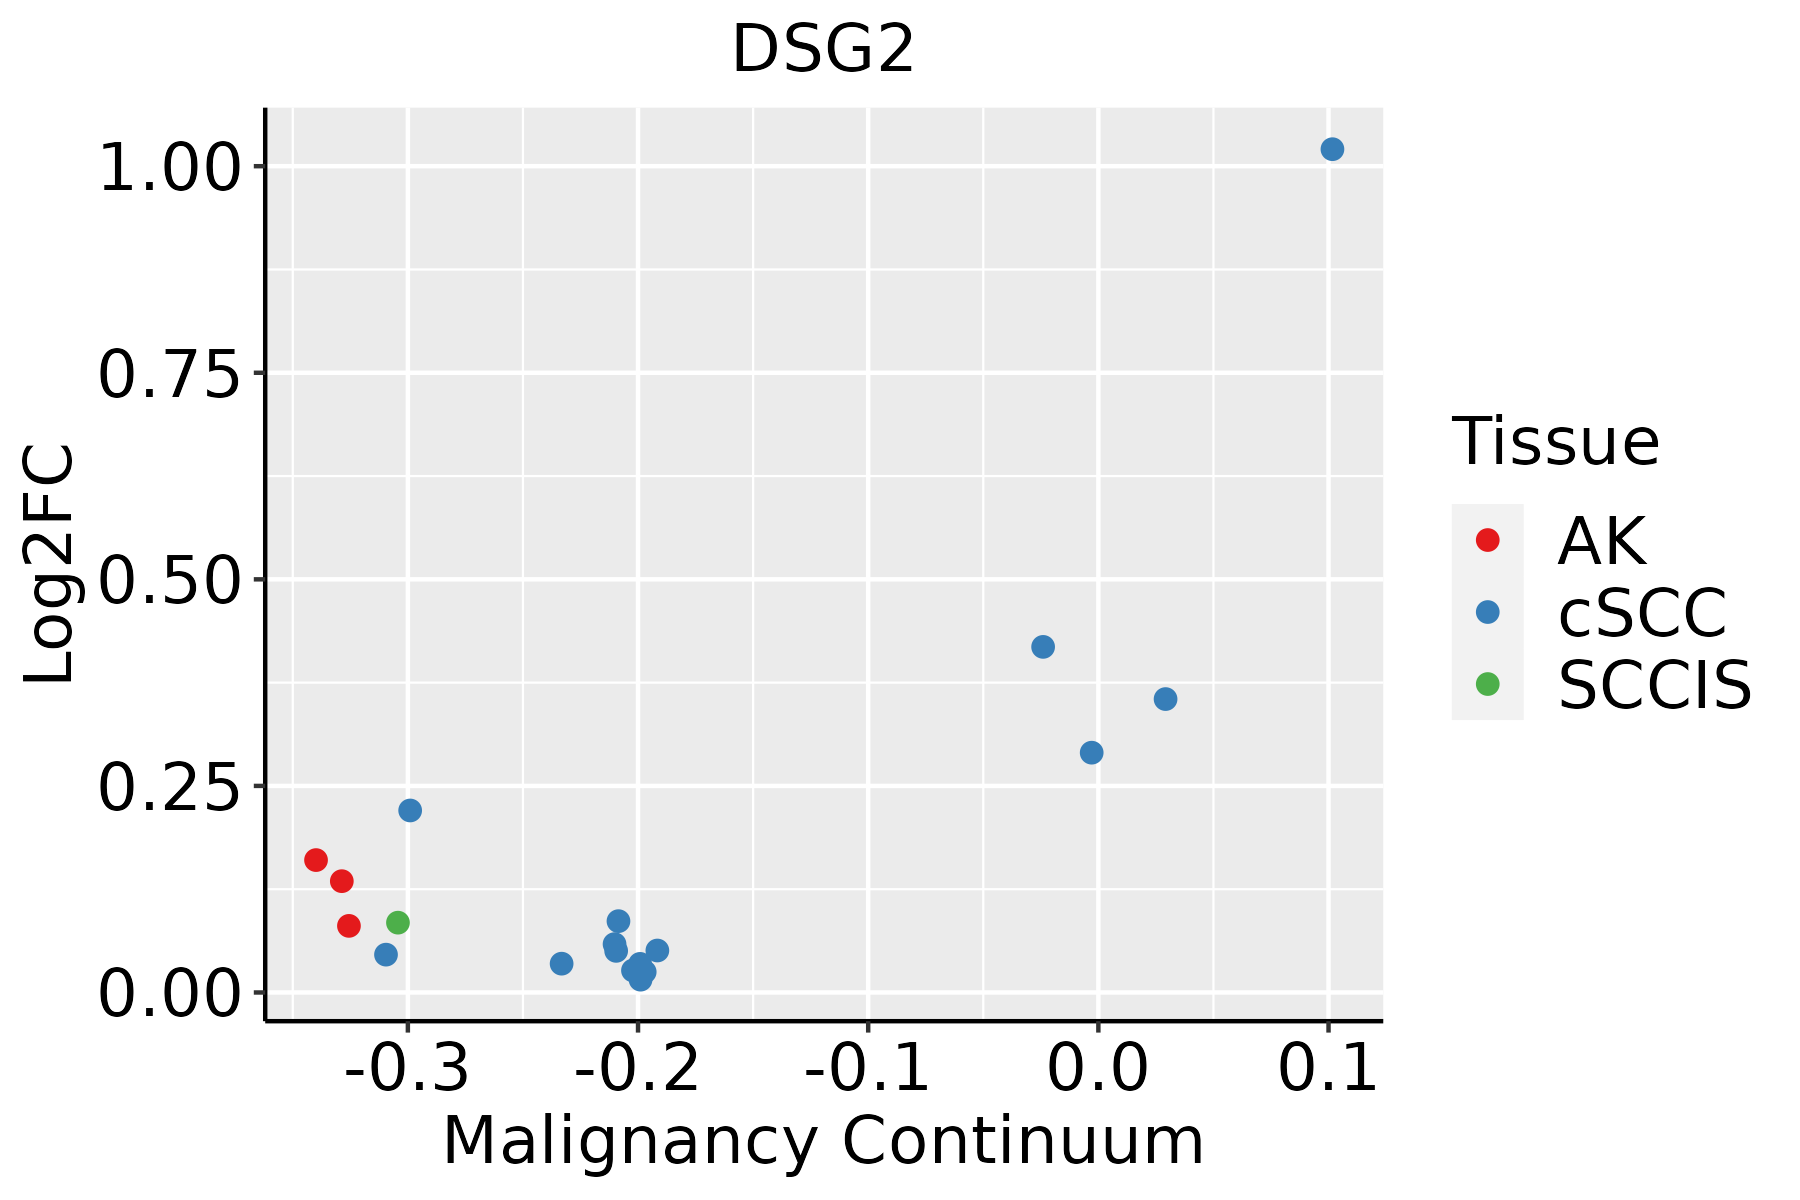 | AK: Actinic keratosis |
| cSCC: Cutaneous squamous cell carcinoma | ||
| SCCIS:squamous cell carcinoma in situ | ||
| Thyroid | 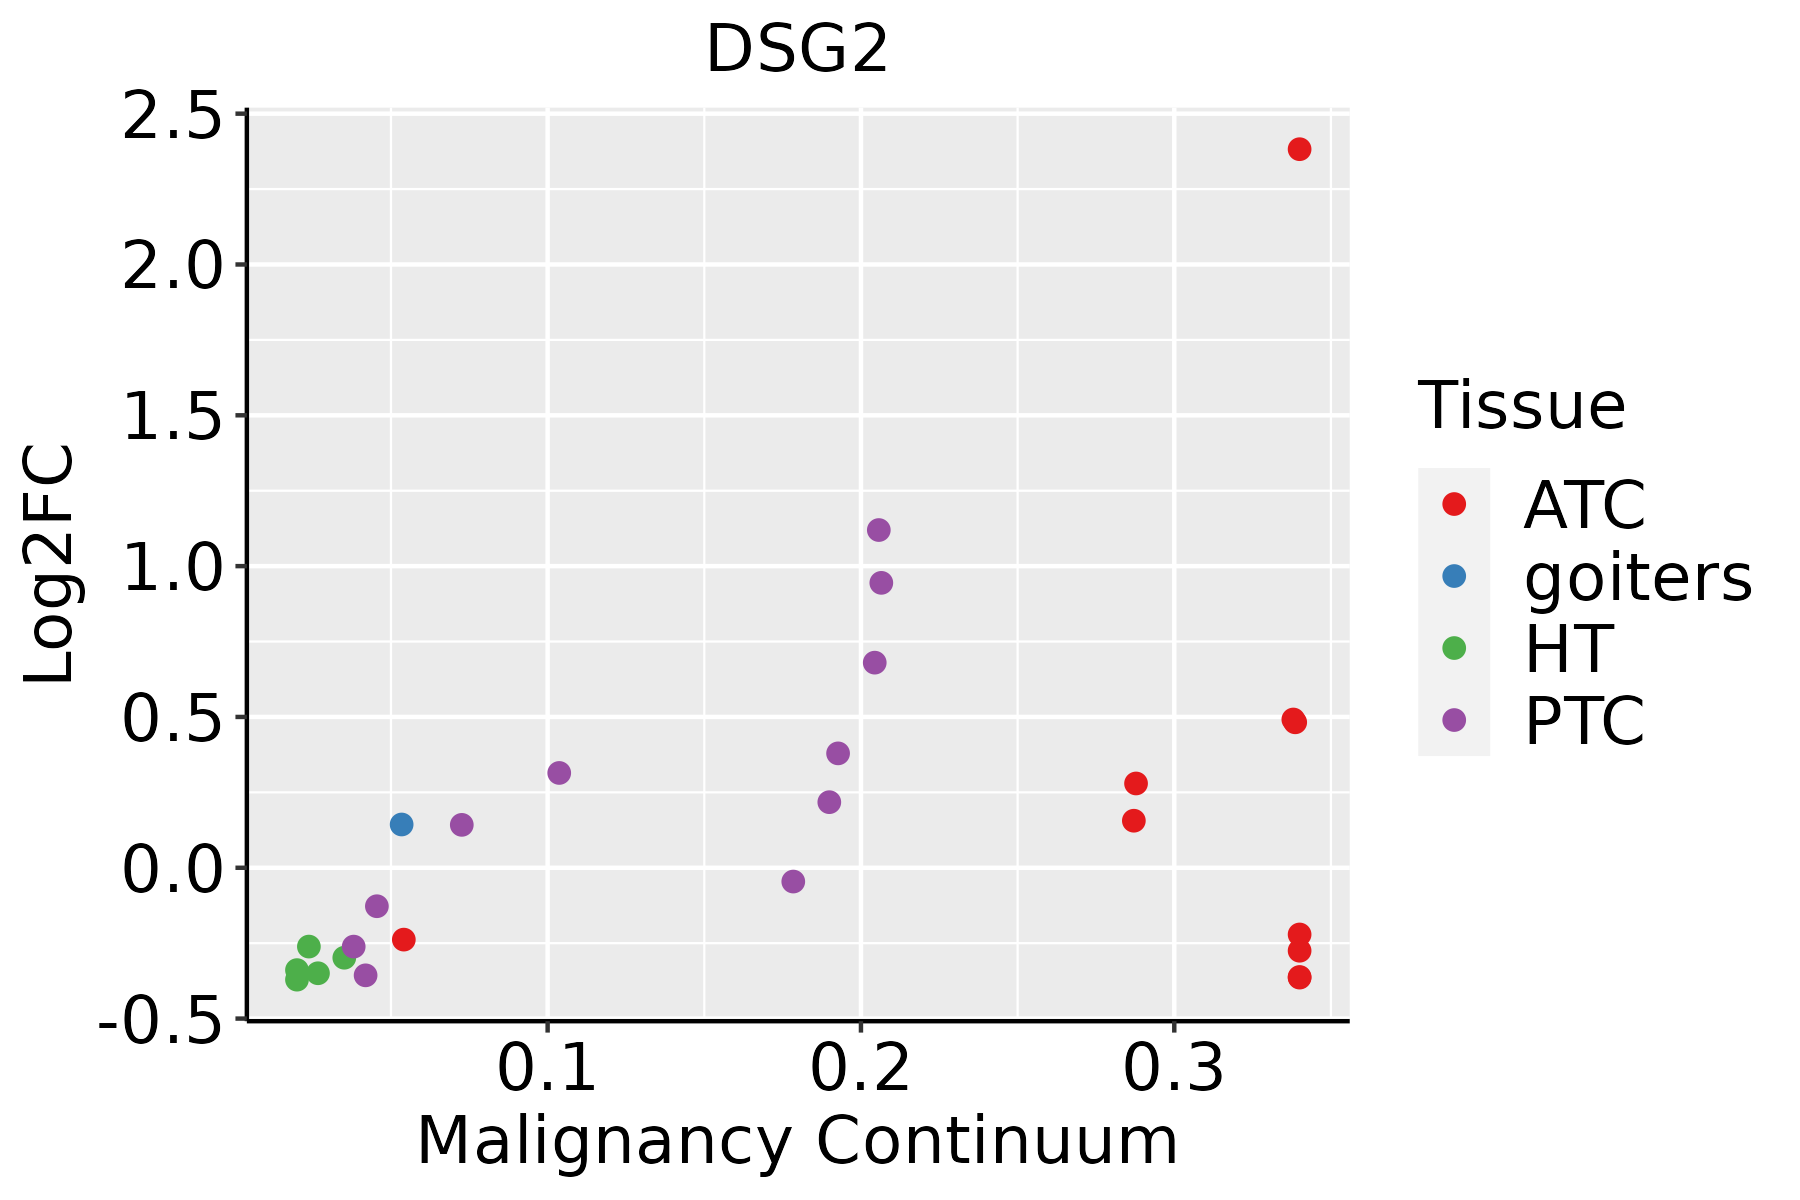 | ATC: Anaplastic thyroid cancer |
| HT: Hashimoto's thyroiditis | ||
| PTC: Papillary thyroid cancer |
| ∗log2FC in expression of this searched gene in stem-like cells from each diseased tissue sample relative to stem-like cells in normal samples in each tissue plotted against the malignancy continuum. Samples are colored based on if they are from different disease stage. |
Top |
Malignant transformation related pathway analysis |
| Find out the enriched GO biological processes and KEGG pathways involved in transition from healthy to precancer to cancer |
| Tissue | Disease Stage | Enriched GO biological Processes |
| Colorectum | AD |  |
| Colorectum | SER |  |
| Colorectum | MSS |  |
| Colorectum | MSI-H |  |
| Colorectum | FAP |  |
| ∗Top 15 enriched GO BP terms are showed in the bar plot of each disease state in each tissue. Each row represents a significant GO biological process which is colored according to the -log10(p.adjust). |
| Page: 1 2 3 4 5 6 7 8 9 |
| GO ID | Tissue | Disease Stage | Description | Gene Ratio | Bg Ratio | pvalue | p.adjust | Count |
| GO:0032970 | Colorectum | AD | regulation of actin filament-based process | 142/3918 | 397/18723 | 4.05e-12 | 5.90e-10 | 142 |
| GO:0045216 | Colorectum | AD | cell-cell junction organization | 80/3918 | 200/18723 | 5.57e-10 | 4.58e-08 | 80 |
| GO:0034109 | Colorectum | AD | homotypic cell-cell adhesion | 40/3918 | 90/18723 | 4.37e-07 | 1.67e-05 | 40 |
| GO:0098901 | Colorectum | AD | regulation of cardiac muscle cell action potential | 15/3918 | 27/18723 | 8.20e-05 | 1.29e-03 | 15 |
| GO:0098911 | Colorectum | AD | regulation of ventricular cardiac muscle cell action potential | 9/3918 | 12/18723 | 9.01e-05 | 1.38e-03 | 9 |
| GO:0002934 | Colorectum | AD | desmosome organization | 8/3918 | 10/18723 | 1.09e-04 | 1.62e-03 | 8 |
| GO:0030048 | Colorectum | AD | actin filament-based movement | 44/3918 | 127/18723 | 2.31e-04 | 2.99e-03 | 44 |
| GO:0090257 | Colorectum | AD | regulation of muscle system process | 73/3918 | 252/18723 | 1.46e-03 | 1.24e-02 | 73 |
| GO:0086004 | Colorectum | AD | regulation of cardiac muscle cell contraction | 15/3918 | 34/18723 | 1.96e-03 | 1.58e-02 | 15 |
| GO:00329701 | Colorectum | SER | regulation of actin filament-based process | 115/2897 | 397/18723 | 4.16e-12 | 8.80e-10 | 115 |
| GO:00452161 | Colorectum | SER | cell-cell junction organization | 63/2897 | 200/18723 | 9.15e-09 | 7.80e-07 | 63 |
| GO:00341091 | Colorectum | SER | homotypic cell-cell adhesion | 32/2897 | 90/18723 | 2.23e-06 | 9.31e-05 | 32 |
| GO:00300481 | Colorectum | SER | actin filament-based movement | 38/2897 | 127/18723 | 2.80e-05 | 7.56e-04 | 38 |
| GO:00029341 | Colorectum | SER | desmosome organization | 7/2897 | 10/18723 | 1.64e-04 | 3.12e-03 | 7 |
| GO:00989011 | Colorectum | SER | regulation of cardiac muscle cell action potential | 12/2897 | 27/18723 | 3.27e-04 | 5.22e-03 | 12 |
| GO:00902571 | Colorectum | SER | regulation of muscle system process | 60/2897 | 252/18723 | 3.28e-04 | 5.22e-03 | 60 |
| GO:00989111 | Colorectum | SER | regulation of ventricular cardiac muscle cell action potential | 7/2897 | 12/18723 | 8.12e-04 | 1.01e-02 | 7 |
| GO:0003012 | Colorectum | SER | muscle system process | 92/2897 | 452/18723 | 2.98e-03 | 2.63e-02 | 92 |
| GO:00860041 | Colorectum | SER | regulation of cardiac muscle cell contraction | 12/2897 | 34/18723 | 3.60e-03 | 3.03e-02 | 12 |
| GO:0055117 | Colorectum | SER | regulation of cardiac muscle contraction | 21/2897 | 77/18723 | 5.54e-03 | 4.09e-02 | 21 |
| Page: 1 2 3 4 5 6 7 8 9 |
| Pathway ID | Tissue | Disease Stage | Description | Gene Ratio | Bg Ratio | pvalue | p.adjust | qvalue | Count |
| hsa05412 | Colorectum | FAP | Arrhythmogenic right ventricular cardiomyopathy | 23/1404 | 77/8465 | 2.58e-03 | 1.19e-02 | 7.23e-03 | 23 |
| hsa054121 | Colorectum | FAP | Arrhythmogenic right ventricular cardiomyopathy | 23/1404 | 77/8465 | 2.58e-03 | 1.19e-02 | 7.23e-03 | 23 |
| hsa054122 | Colorectum | CRC | Arrhythmogenic right ventricular cardiomyopathy | 18/1091 | 77/8465 | 7.90e-03 | 3.77e-02 | 2.55e-02 | 18 |
| hsa054123 | Colorectum | CRC | Arrhythmogenic right ventricular cardiomyopathy | 18/1091 | 77/8465 | 7.90e-03 | 3.77e-02 | 2.55e-02 | 18 |
| Page: 1 |
Top |
Cell-cell communication analysis |
| Identification of potential cell-cell interactions between two cell types and their ligand-receptor pairs for different disease states |
| Ligand | Receptor | LRpair | Pathway | Tissue | Disease Stage |
| DSC2 | DSG2 | DSC2_DSG2 | DESMOSOME | Breast | DCIS |
| DSC2 | DSG2 | DSC2_DSG2 | DESMOSOME | Breast | Healthy |
| DSG2 | DSC3 | DSG2_DSC3 | DESMOSOME | Breast | IDC |
| DSC2 | DSG2 | DSC2_DSG2 | DESMOSOME | Breast | Precancer |
| DSC2 | DSG2 | DSC2_DSG2 | DESMOSOME | Cervix | CC |
| DSG2 | DSC3 | DSG2_DSC3 | DESMOSOME | Cervix | CC |
| DSC2 | DSG2 | DSC2_DSG2 | DESMOSOME | Cervix | Precancer |
| DSC2 | DSG2 | DSC2_DSG2 | DESMOSOME | CRC | AD |
| DSC2 | DSG2 | DSC2_DSG2 | DESMOSOME | CRC | ADJ |
| DSC2 | DSG2 | DSC2_DSG2 | DESMOSOME | CRC | FAP |
| DSC2 | DSG2 | DSC2_DSG2 | DESMOSOME | CRC | Healthy |
| DSC2 | DSG2 | DSC2_DSG2 | DESMOSOME | CRC | MSI-H |
| DSC2 | DSG2 | DSC2_DSG2 | DESMOSOME | CRC | MSS |
| DSC2 | DSG2 | DSC2_DSG2 | DESMOSOME | CRC | SER |
| DSC2 | DSG2 | DSC2_DSG2 | DESMOSOME | Esophagus | ADJ |
| DSG2 | DSC3 | DSG2_DSC3 | DESMOSOME | Esophagus | ADJ |
| DSC2 | DSG2 | DSC2_DSG2 | DESMOSOME | Esophagus | ESCC |
| DSG2 | DSC3 | DSG2_DSC3 | DESMOSOME | Esophagus | ESCC |
| DSC1 | DSG2 | DSC1_DSG2 | DESMOSOME | HNSCC | OSCC |
| DSC2 | DSG2 | DSC2_DSG2 | DESMOSOME | HNSCC | OSCC |
| Page: 1 |
Top |
Single-cell gene regulatory network inference analysis |
| Find out the significant the regulons (TFs) and the target genes of each regulon across cell types for different disease states |
| TF | Cell Type | Tissue | Disease Stage | Target Gene | RSS | Regulon Activity |
| ∗The dot plots of a searched regulon are shown for all cell subpopulations in each disease state of each tissue based on the regulon specific score inferred using pySCENIC and by calculating the average expression. |
| Page: 1 |
Top |
Somatic mutation of malignant transformation related genes |
| Annotation of somatic variants for genes involved in malignant transformation |
| Hugo Symbol | Variant Class | Variant Classification | dbSNP RS | HGVSc | HGVSp | HGVSp Short | SWISSPROT | BIOTYPE | SIFT | PolyPhen | Tumor Sample Barcode | Tissue | Histology | Sex | Age | Stage | Therapy Types | Drugs | Outcome |
| DSG2 | SNV | Missense_Mutation | novel | c.2128N>C | p.Glu710Gln | p.E710Q | Q14126 | protein_coding | tolerated(0.44) | benign(0.153) | TCGA-BH-A2L8-01 | Breast | breast invasive carcinoma | Female | <65 | I/II | Chemotherapy | cytoxan | CR |
| DSG2 | SNV | Missense_Mutation | rs748445394 | c.219N>G | p.Ile73Met | p.I73M | Q14126 | protein_coding | deleterious(0.01) | benign(0.254) | TCGA-EW-A1OY-01 | Breast | breast invasive carcinoma | Female | <65 | I/II | Chemotherapy | doxorubicin | SD |
| DSG2 | insertion | In_Frame_Ins | novel | c.2963_2964insATT | p.Thr988_Glu989insPhe | p.T988_E989insF | Q14126 | protein_coding | TCGA-A7-A26I-01 | Breast | breast invasive carcinoma | Female | >=65 | I/II | Chemotherapy | cytoxan | SD | ||
| DSG2 | insertion | Frame_Shift_Ins | novel | c.759_760insGCCTGGGCAACAGAGCAAGACTCCATATCCAAAAAAAAGAAAAG | p.Lys254AlafsTer33 | p.K254Afs*33 | Q14126 | protein_coding | TCGA-A8-A095-01 | Breast | breast invasive carcinoma | Female | <65 | I/II | Chemotherapy | 5-fluorouracil | CR | ||
| DSG2 | insertion | Frame_Shift_Ins | novel | c.617_618insCAAGAAATATATTAAATTTTTTTGTTTGT | p.Tyr207LysfsTer17 | p.Y207Kfs*17 | Q14126 | protein_coding | TCGA-AN-A04C-01 | Breast | breast invasive carcinoma | Female | <65 | I/II | Unknown | Unknown | SD | ||
| DSG2 | deletion | Frame_Shift_Del | novel | c.654delN | p.Glu219ArgfsTer19 | p.E219Rfs*19 | Q14126 | protein_coding | TCGA-EW-A2FV-01 | Breast | breast invasive carcinoma | Female | <65 | III/IV | Chemotherapy | docetaxel | SD | ||
| DSG2 | SNV | Missense_Mutation | rs751064437 | c.2915N>T | p.Ser972Phe | p.S972F | Q14126 | protein_coding | deleterious(0.01) | possibly_damaging(0.87) | TCGA-JX-A3Q0-01 | Cervix | cervical & endocervical cancer | Female | <65 | III/IV | Unknown | Unknown | SD |
| DSG2 | SNV | Missense_Mutation | c.1045G>C | p.Asp349His | p.D349H | Q14126 | protein_coding | deleterious(0.01) | possibly_damaging(0.897) | TCGA-VS-A958-01 | Cervix | cervical & endocervical cancer | Female | <65 | I/II | Chemotherapy | cisplatin | CR | |
| DSG2 | SNV | Missense_Mutation | novel | c.2635G>C | p.Glu879Gln | p.E879Q | Q14126 | protein_coding | tolerated(0.09) | possibly_damaging(0.454) | TCGA-VS-A958-01 | Cervix | cervical & endocervical cancer | Female | <65 | I/II | Chemotherapy | cisplatin | CR |
| DSG2 | SNV | Missense_Mutation | novel | c.134N>C | p.Val45Ala | p.V45A | Q14126 | protein_coding | deleterious(0.02) | benign(0.006) | TCGA-VS-A9UD-01 | Cervix | cervical & endocervical cancer | Female | >=65 | III/IV | Chemotherapy | cisplatin | CR |
| Page: 1 2 3 4 5 6 7 8 9 10 11 |
Top |
Related drugs of malignant transformation related genes |
| Identification of chemicals and drugs interact with genes involved in malignant transfromation |
| (DGIdb 4.0) |
| Entrez ID | Symbol | Category | Interaction Types | Drug Claim Name | Drug Name | PMIDs |
| Page: 1 |

Copyright 2023-Present -The University of Texas Health Science Center at Houston |