
|
|||||
|
 | |
| |
| |
| |
| |
| |
|
Gene: DSG1 |
Gene summary for DSG1 |
| Gene information | Species | Human | Gene symbol | DSG1 | Gene ID | 1828 |
| Gene name | desmoglein 1 | |
| Gene Alias | CDHF4 | |
| Cytomap | 18q12.1 | |
| Gene Type | protein-coding | GO ID | GO:0007043 | UniProtAcc | Q02413 |
Top |
Malignant transformation analysis |
| Identification of the aberrant gene expression in precancerous and cancerous lesions by comparing the gene expression of stem-like cells in diseased tissues with normal stem cells |
| Entrez ID | Symbol | Replicates | Species | Organ | Tissue | Adj P-value | Log2FC | Malignancy |
| 1828 | DSG1 | HCC1 | Human | Liver | HCC | 7.77e-09 | 3.16e+00 | 0.5336 |
| 1828 | DSG1 | HCC2 | Human | Liver | HCC | 2.91e-02 | 1.31e+00 | 0.5341 |
| 1828 | DSG1 | P1_S1_AK | Human | Skin | AK | 1.96e-07 | 4.66e-01 | -0.3399 |
| 1828 | DSG1 | P2_S3_AK | Human | Skin | AK | 1.57e-02 | 3.38e-01 | -0.3287 |
| 1828 | DSG1 | P2_S4_SCCIS | Human | Skin | SCCIS | 2.58e-02 | 3.60e-01 | -0.3043 |
| 1828 | DSG1 | P3_S6_AK | Human | Skin | AK | 4.10e-40 | 9.56e-01 | -0.3256 |
| 1828 | DSG1 | P4_S8_cSCC | Human | Skin | cSCC | 4.24e-32 | 7.45e-01 | -0.3095 |
| 1828 | DSG1 | P1_cSCC | Human | Skin | cSCC | 6.68e-34 | 1.34e+00 | 0.0292 |
| 1828 | DSG1 | P2_cSCC | Human | Skin | cSCC | 4.60e-28 | 9.61e-01 | -0.024 |
| 1828 | DSG1 | P4_cSCC | Human | Skin | cSCC | 2.85e-42 | 1.20e+00 | -0.00290000000000005 |
| 1828 | DSG1 | P10_cSCC | Human | Skin | cSCC | 6.10e-09 | 6.32e-01 | 0.1017 |
| 1828 | DSG1 | cSCC_p10 | Human | Skin | cSCC | 3.52e-08 | 4.11e-01 | -0.2095 |
| 1828 | DSG1 | cSCC_p4 | Human | Skin | cSCC | 1.17e-02 | 2.08e-01 | -0.2022 |
| 1828 | DSG1 | cSCC_p7 | Human | Skin | cSCC | 5.30e-05 | 2.64e-01 | -0.2332 |
| 1828 | DSG1 | cSCC_p8 | Human | Skin | cSCC | 1.25e-08 | 2.80e-01 | -0.1971 |
| 1828 | DSG1 | cSCC_p9 | Human | Skin | cSCC | 6.27e-03 | 2.56e-01 | -0.1991 |
| Page: 1 |
| Tissue | Expression Dynamics | Abbreviation |
| Liver | 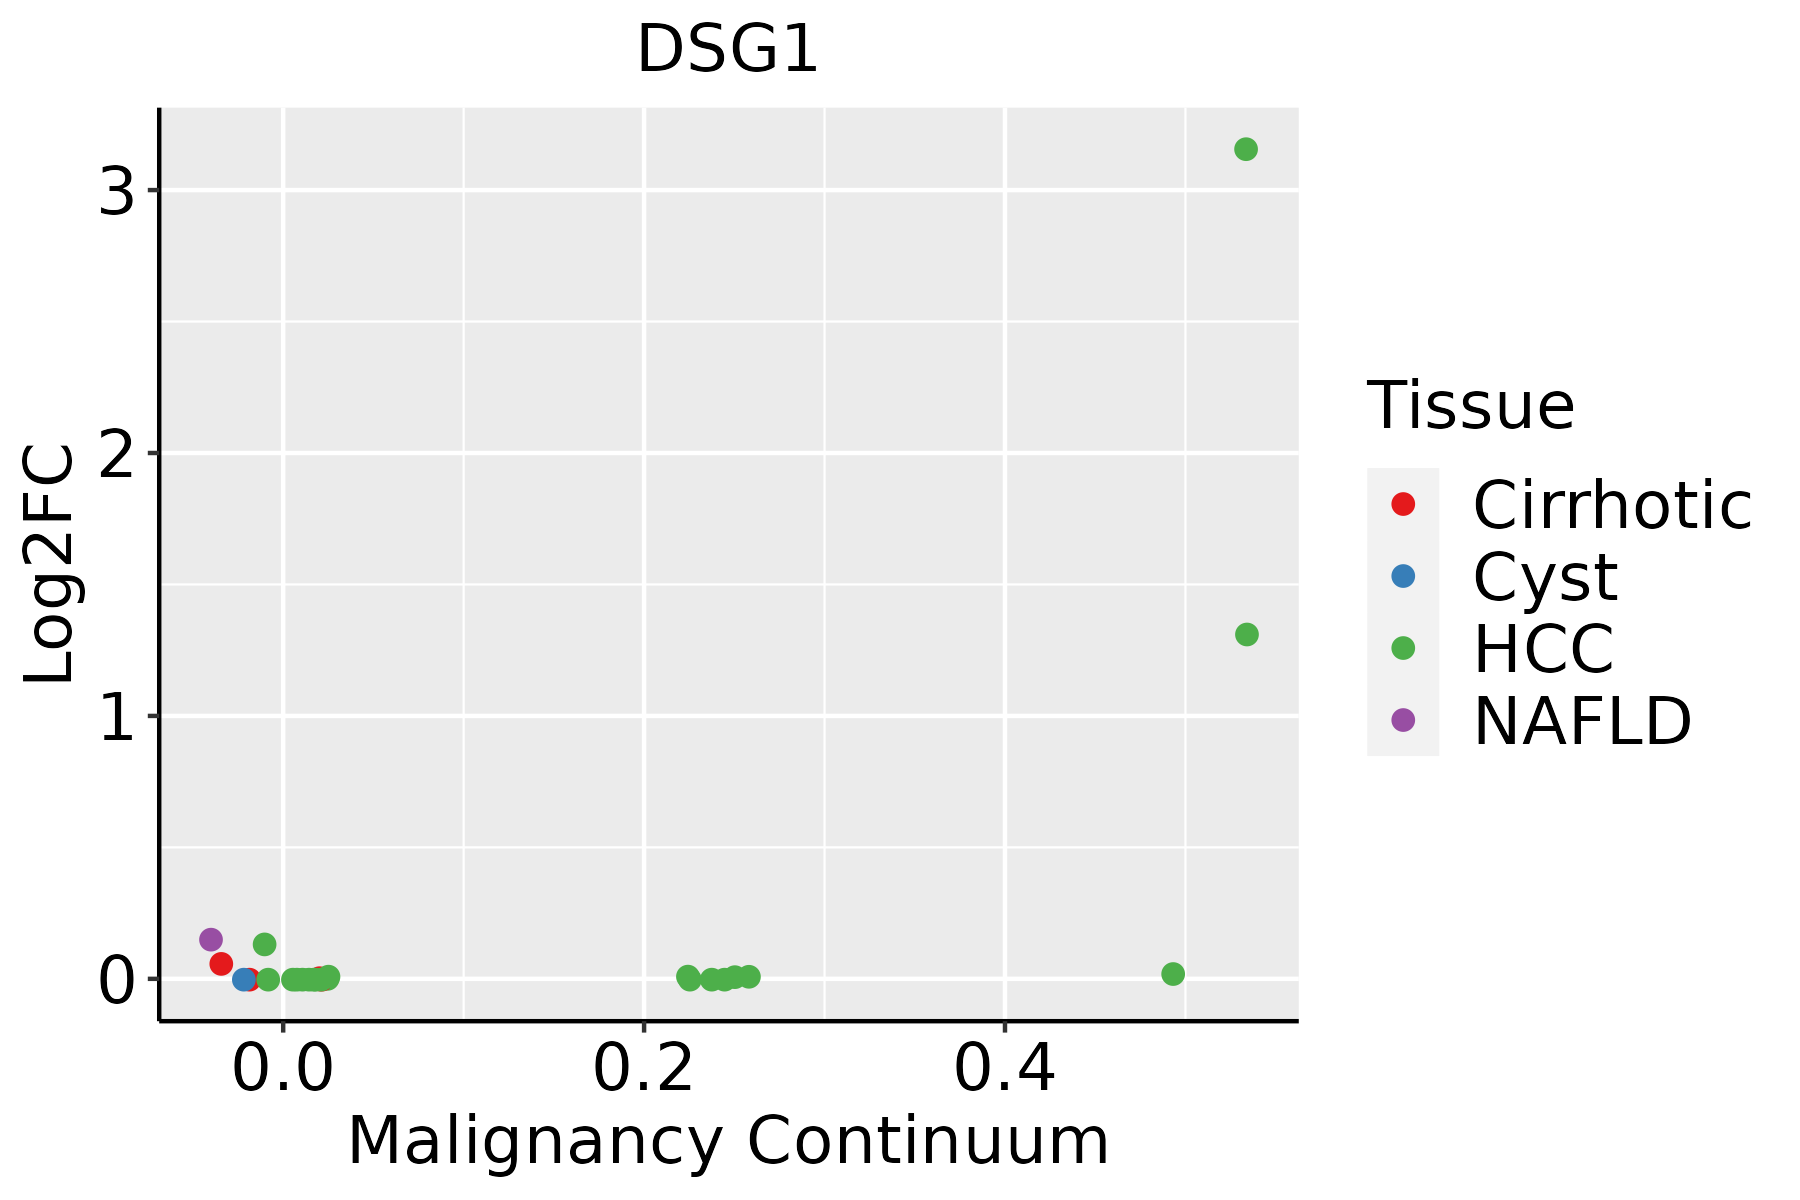 | HCC: Hepatocellular carcinoma |
| NAFLD: Non-alcoholic fatty liver disease | ||
| Skin | 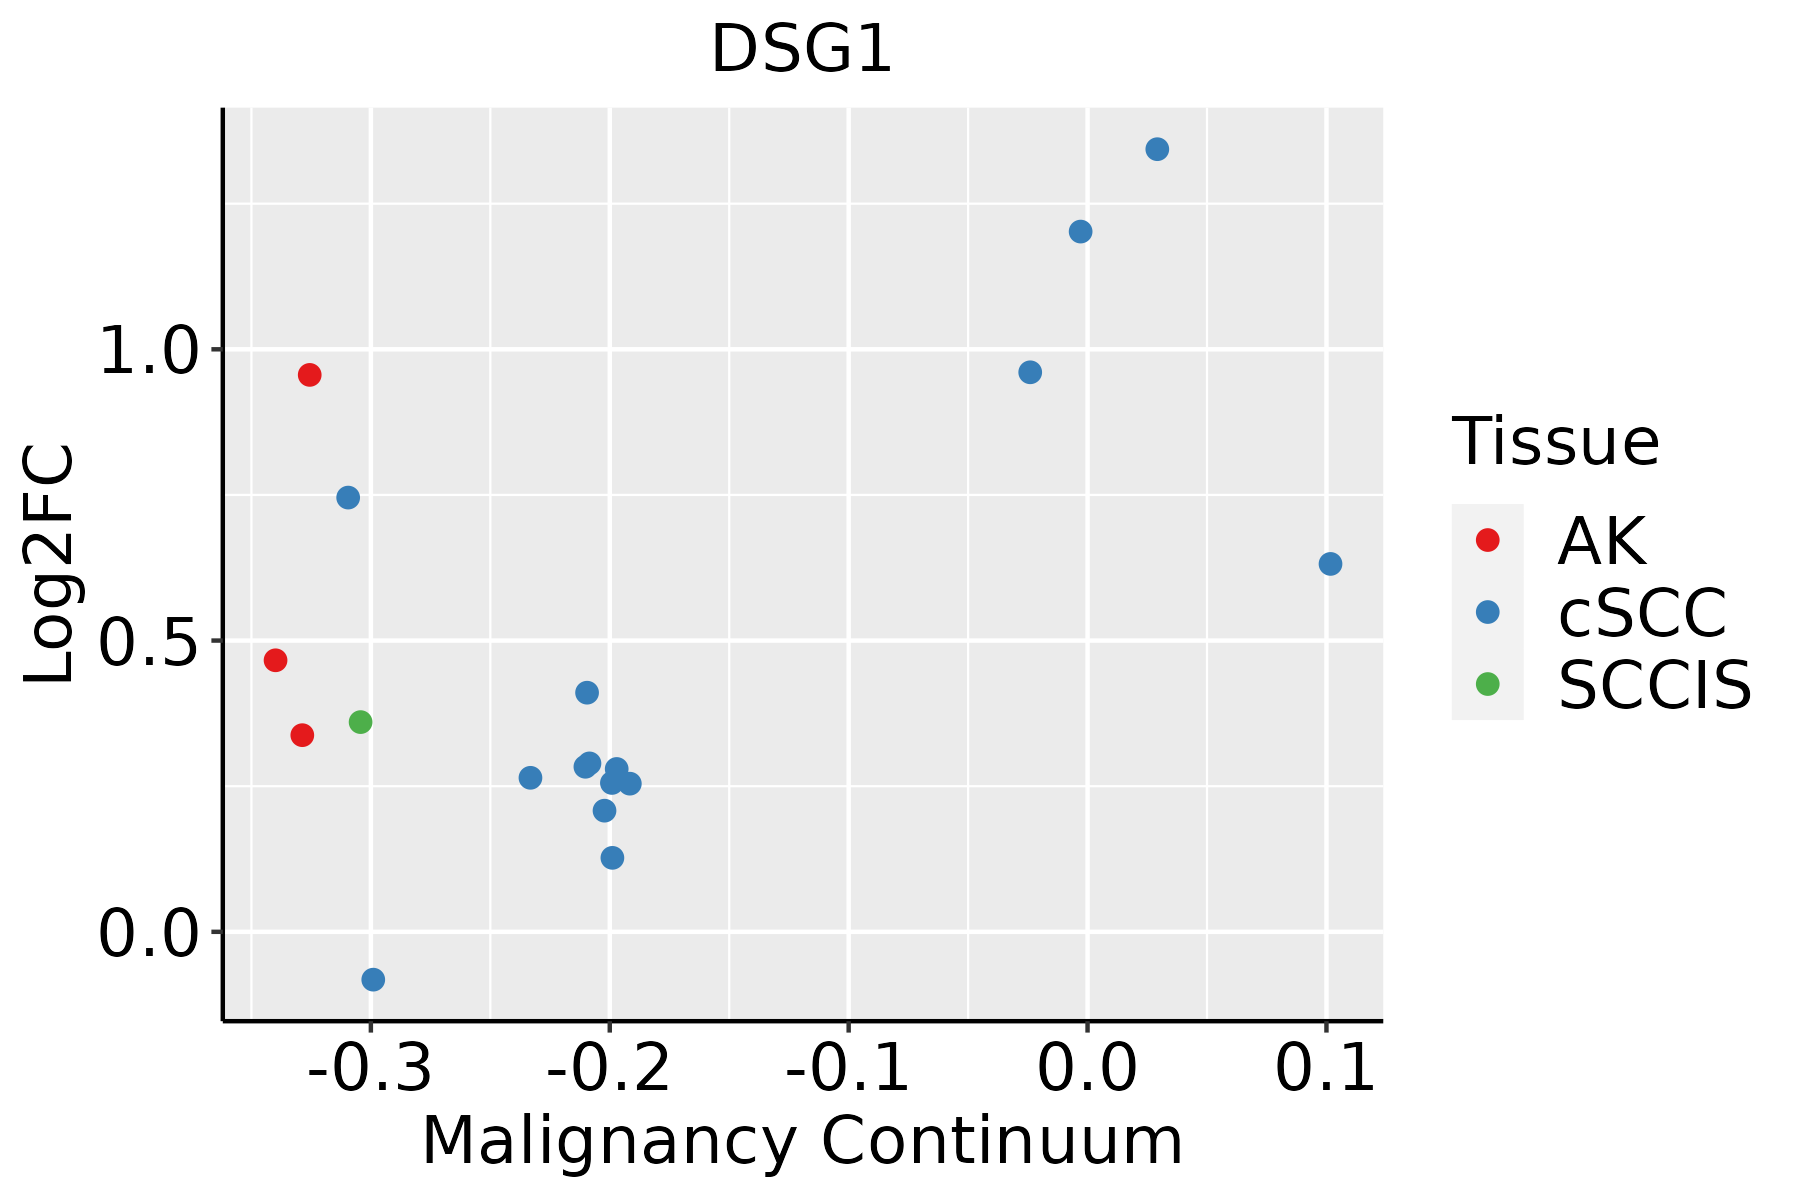 | AK: Actinic keratosis |
| cSCC: Cutaneous squamous cell carcinoma | ||
| SCCIS:squamous cell carcinoma in situ |
| ∗log2FC in expression of this searched gene in stem-like cells from each diseased tissue sample relative to stem-like cells in normal samples in each tissue plotted against the malignancy continuum. Samples are colored based on if they are from different disease stage. |
Top |
Malignant transformation related pathway analysis |
| Find out the enriched GO biological processes and KEGG pathways involved in transition from healthy to precancer to cancer |
| Tissue | Disease Stage | Enriched GO biological Processes |
| Colorectum | AD |  |
| Colorectum | SER |  |
| Colorectum | MSS |  |
| Colorectum | MSI-H |  |
| Colorectum | FAP |  |
| ∗Top 15 enriched GO BP terms are showed in the bar plot of each disease state in each tissue. Each row represents a significant GO biological process which is colored according to the -log10(p.adjust). |
| Page: 1 2 3 4 5 6 7 8 9 |
| GO ID | Tissue | Disease Stage | Description | Gene Ratio | Bg Ratio | pvalue | p.adjust | Count |
| GO:003164722 | Liver | HCC | regulation of protein stability | 211/7958 | 298/18723 | 2.29e-23 | 5.01e-21 | 211 |
| GO:005082122 | Liver | HCC | protein stabilization | 139/7958 | 191/18723 | 1.61e-17 | 1.71e-15 | 139 |
| GO:004521622 | Liver | HCC | cell-cell junction organization | 107/7958 | 200/18723 | 1.06e-03 | 6.11e-03 | 107 |
| GO:000704312 | Liver | HCC | cell-cell junction assembly | 76/7958 | 146/18723 | 1.23e-02 | 4.47e-02 | 76 |
| GO:003432919 | Skin | AK | cell junction assembly | 86/1910 | 420/18723 | 1.95e-10 | 2.68e-08 | 86 |
| GO:004521626 | Skin | AK | cell-cell junction organization | 51/1910 | 200/18723 | 4.51e-10 | 5.24e-08 | 51 |
| GO:003164728 | Skin | AK | regulation of protein stability | 64/1910 | 298/18723 | 5.93e-09 | 4.14e-07 | 64 |
| GO:005082128 | Skin | AK | protein stabilization | 47/1910 | 191/18723 | 7.41e-09 | 4.99e-07 | 47 |
| GO:000704319 | Skin | AK | cell-cell junction assembly | 36/1910 | 146/18723 | 3.88e-07 | 1.47e-05 | 36 |
| GO:0034329110 | Skin | SCCIS | cell junction assembly | 52/919 | 420/18723 | 7.89e-10 | 5.23e-07 | 52 |
| GO:0045216110 | Skin | SCCIS | cell-cell junction organization | 26/919 | 200/18723 | 5.65e-06 | 2.29e-04 | 26 |
| GO:0007043110 | Skin | SCCIS | cell-cell junction assembly | 18/919 | 146/18723 | 2.94e-04 | 5.23e-03 | 18 |
| GO:00987421 | Skin | SCCIS | cell-cell adhesion via plasma-membrane adhesion molecules | 26/919 | 273/18723 | 9.83e-04 | 1.23e-02 | 26 |
| GO:0031647112 | Skin | SCCIS | regulation of protein stability | 26/919 | 298/18723 | 3.35e-03 | 3.00e-02 | 26 |
| GO:003164729 | Skin | cSCC | regulation of protein stability | 144/4864 | 298/18723 | 6.51e-17 | 6.80e-15 | 144 |
| GO:0050821112 | Skin | cSCC | protein stabilization | 96/4864 | 191/18723 | 5.00e-13 | 2.93e-11 | 96 |
| GO:004521627 | Skin | cSCC | cell-cell junction organization | 69/4864 | 200/18723 | 4.46e-03 | 2.29e-02 | 69 |
| Page: 1 |
| Pathway ID | Tissue | Disease Stage | Description | Gene Ratio | Bg Ratio | pvalue | p.adjust | qvalue | Count |
| Page: 1 |
Top |
Cell-cell communication analysis |
| Identification of potential cell-cell interactions between two cell types and their ligand-receptor pairs for different disease states |
| Ligand | Receptor | LRpair | Pathway | Tissue | Disease Stage |
| DSC2 | DSG1 | DSC2_DSG1 | DESMOSOME | Cervix | Healthy |
| DSG1 | DSC3 | DSG1_DSC3 | DESMOSOME | Cervix | Healthy |
| DSC1 | DSG1 | DSC1_DSG1 | DESMOSOME | HNSCC | OSCC |
| DSC2 | DSG1 | DSC2_DSG1 | DESMOSOME | HNSCC | OSCC |
| DSG1 | DSC3 | DSG1_DSC3 | DESMOSOME | HNSCC | OSCC |
| DSC2 | DSG1 | DSC2_DSG1 | DESMOSOME | HNSCC | Precancer |
| DSG1 | DSC3 | DSG1_DSC3 | DESMOSOME | HNSCC | Precancer |
| DSC1 | DSG1 | DSC1_DSG1 | DESMOSOME | Skin | ADJ |
| DSC2 | DSG1 | DSC2_DSG1 | DESMOSOME | Skin | ADJ |
| DSG1 | DSC3 | DSG1_DSC3 | DESMOSOME | Skin | ADJ |
| DSC1 | DSG1 | DSC1_DSG1 | DESMOSOME | Skin | AK |
| DSC2 | DSG1 | DSC2_DSG1 | DESMOSOME | Skin | AK |
| DSG1 | DSC3 | DSG1_DSC3 | DESMOSOME | Skin | AK |
| DSC2 | DSG1 | DSC2_DSG1 | DESMOSOME | Skin | cSCC |
| DSG1 | DSC3 | DSG1_DSC3 | DESMOSOME | Skin | cSCC |
| DSC1 | DSG1 | DSC1_DSG1 | DESMOSOME | Skin | Healthy |
| DSG1 | DSC3 | DSG1_DSC3 | DESMOSOME | Skin | Healthy |
| DSC2 | DSG1 | DSC2_DSG1 | DESMOSOME | Skin | SCCIS |
| DSG1 | DSC3 | DSG1_DSC3 | DESMOSOME | Skin | SCCIS |
| Page: 1 |
Top |
Single-cell gene regulatory network inference analysis |
| Find out the significant the regulons (TFs) and the target genes of each regulon across cell types for different disease states |
| TF | Cell Type | Tissue | Disease Stage | Target Gene | RSS | Regulon Activity |
| ∗The dot plots of a searched regulon are shown for all cell subpopulations in each disease state of each tissue based on the regulon specific score inferred using pySCENIC and by calculating the average expression. |
| Page: 1 |
Top |
Somatic mutation of malignant transformation related genes |
| Annotation of somatic variants for genes involved in malignant transformation |
| Hugo Symbol | Variant Class | Variant Classification | dbSNP RS | HGVSc | HGVSp | HGVSp Short | SWISSPROT | BIOTYPE | SIFT | PolyPhen | Tumor Sample Barcode | Tissue | Histology | Sex | Age | Stage | Therapy Types | Drugs | Outcome |
| DSG1 | SNV | Missense_Mutation | c.2957N>T | p.Ala986Val | p.A986V | Q02413 | protein_coding | tolerated(0.63) | benign(0.059) | TCGA-A8-A06Z-01 | Breast | breast invasive carcinoma | Female | >=65 | I/II | Unknown | Unknown | SD | |
| DSG1 | SNV | Missense_Mutation | c.2341N>A | p.Glu781Lys | p.E781K | Q02413 | protein_coding | tolerated(0.29) | benign(0.37) | TCGA-C8-A27A-01 | Breast | breast invasive carcinoma | Female | <65 | I/II | Chemotherapy | 5-fluorouracil | CR | |
| DSG1 | SNV | Missense_Mutation | c.2533N>C | p.Asp845His | p.D845H | Q02413 | protein_coding | deleterious(0) | benign(0.428) | TCGA-E2-A1B4-01 | Breast | breast invasive carcinoma | Female | >=65 | III/IV | Hormone Therapy | arimidex | SD | |
| DSG1 | SNV | Missense_Mutation | novel | c.2125N>A | p.Asp709Asn | p.D709N | Q02413 | protein_coding | deleterious(0) | probably_damaging(0.981) | TCGA-HN-A2OB-01 | Breast | breast invasive carcinoma | Female | <65 | I/II | Chemotherapy | fluorouracil | PD |
| DSG1 | SNV | Missense_Mutation | rs77149443 | c.2557N>A | p.Val853Ile | p.V853I | Q02413 | protein_coding | tolerated(0.4) | benign(0) | TCGA-LQ-A4E4-01 | Breast | breast invasive carcinoma | Female | >=65 | III/IV | Hormone Therapy | anastrozole | PD |
| DSG1 | SNV | Missense_Mutation | novel | c.748N>C | p.Ser250Pro | p.S250P | Q02413 | protein_coding | deleterious(0) | possibly_damaging(0.588) | TCGA-2W-A8YY-01 | Cervix | cervical & endocervical cancer | Female | <65 | I/II | Chemotherapy | cisplatin | CR |
| DSG1 | SNV | Missense_Mutation | rs370600690 | c.2794N>A | p.Gly932Ser | p.G932S | Q02413 | protein_coding | tolerated(0.18) | possibly_damaging(0.853) | TCGA-2W-A8YY-01 | Cervix | cervical & endocervical cancer | Female | <65 | I/II | Chemotherapy | cisplatin | CR |
| DSG1 | SNV | Missense_Mutation | novel | c.872N>C | p.Arg291Thr | p.R291T | Q02413 | protein_coding | deleterious(0.04) | benign(0.013) | TCGA-DS-A1OB-01 | Cervix | cervical & endocervical cancer | Female | <65 | I/II | Chemotherapy | carboplatin | PD |
| DSG1 | SNV | Missense_Mutation | c.2008N>G | p.Gln670Glu | p.Q670E | Q02413 | protein_coding | tolerated(1) | benign(0.288) | TCGA-EK-A2R8-01 | Cervix | cervical & endocervical cancer | Female | <65 | I/II | Unknown | Unknown | SD | |
| DSG1 | SNV | Missense_Mutation | c.1889C>T | p.Ser630Leu | p.S630L | Q02413 | protein_coding | deleterious(0) | benign(0.257) | TCGA-LP-A4AV-01 | Cervix | cervical & endocervical cancer | Female | <65 | I/II | Unknown | Unknown | SD |
| Page: 1 2 3 4 5 6 7 8 9 10 11 12 13 14 15 |
Top |
Related drugs of malignant transformation related genes |
| Identification of chemicals and drugs interact with genes involved in malignant transfromation |
| (DGIdb 4.0) |
| Entrez ID | Symbol | Category | Interaction Types | Drug Claim Name | Drug Name | PMIDs |
| 1828 | DSG1 | NA | PD-98059 | CHEMBL35482 | 11781826 |
| Page: 1 |

Copyright 2023-Present -The University of Texas Health Science Center at Houston |