
|
|||||
|
 | |
| |
| |
| |
| |
| |
|
Gene: DSEL |
Gene summary for DSEL |
| Gene information | Species | Human | Gene symbol | DSEL | Gene ID | 92126 |
| Gene name | dermatan sulfate epimerase like | |
| Gene Alias | C18orf4 | |
| Cytomap | 18q22.1 | |
| Gene Type | protein-coding | GO ID | GO:0006022 | UniProtAcc | Q8IZU8 |
Top |
Malignant transformation analysis |
| Identification of the aberrant gene expression in precancerous and cancerous lesions by comparing the gene expression of stem-like cells in diseased tissues with normal stem cells |
| Entrez ID | Symbol | Replicates | Species | Organ | Tissue | Adj P-value | Log2FC | Malignancy |
| 92126 | DSEL | P3 | Human | Breast | IDC | 8.22e-10 | 7.51e-01 | 0.1542 |
| 92126 | DSEL | DCIS2 | Human | Breast | DCIS | 2.87e-22 | 1.61e-01 | 0.0085 |
| 92126 | DSEL | LZE7T | Human | Esophagus | ESCC | 7.63e-03 | 1.41e-01 | 0.0667 |
| 92126 | DSEL | P2T-E | Human | Esophagus | ESCC | 6.34e-06 | 1.46e-01 | 0.1177 |
| 92126 | DSEL | P4T-E | Human | Esophagus | ESCC | 4.08e-11 | 3.43e-01 | 0.1323 |
| 92126 | DSEL | P5T-E | Human | Esophagus | ESCC | 9.42e-11 | 3.16e-01 | 0.1327 |
| 92126 | DSEL | P8T-E | Human | Esophagus | ESCC | 3.89e-08 | 1.37e-01 | 0.0889 |
| 92126 | DSEL | P11T-E | Human | Esophagus | ESCC | 3.37e-14 | 7.72e-01 | 0.1426 |
| 92126 | DSEL | P16T-E | Human | Esophagus | ESCC | 8.75e-05 | 2.00e-01 | 0.1153 |
| 92126 | DSEL | P19T-E | Human | Esophagus | ESCC | 3.39e-06 | 2.59e-01 | 0.1662 |
| 92126 | DSEL | P20T-E | Human | Esophagus | ESCC | 2.82e-04 | 1.29e-01 | 0.1124 |
| 92126 | DSEL | P22T-E | Human | Esophagus | ESCC | 1.35e-20 | 5.29e-01 | 0.1236 |
| 92126 | DSEL | P23T-E | Human | Esophagus | ESCC | 2.16e-02 | 4.09e-02 | 0.108 |
| 92126 | DSEL | P26T-E | Human | Esophagus | ESCC | 1.61e-03 | 7.61e-02 | 0.1276 |
| 92126 | DSEL | P28T-E | Human | Esophagus | ESCC | 9.10e-03 | 4.13e-02 | 0.1149 |
| 92126 | DSEL | P30T-E | Human | Esophagus | ESCC | 7.16e-10 | 3.49e-01 | 0.137 |
| 92126 | DSEL | P32T-E | Human | Esophagus | ESCC | 3.29e-22 | 6.23e-01 | 0.1666 |
| 92126 | DSEL | P36T-E | Human | Esophagus | ESCC | 1.12e-07 | 4.18e-01 | 0.1187 |
| 92126 | DSEL | P37T-E | Human | Esophagus | ESCC | 2.13e-25 | 6.12e-01 | 0.1371 |
| 92126 | DSEL | P39T-E | Human | Esophagus | ESCC | 2.05e-06 | 1.29e-01 | 0.0894 |
| Page: 1 2 3 |
| Tissue | Expression Dynamics | Abbreviation |
| Breast | 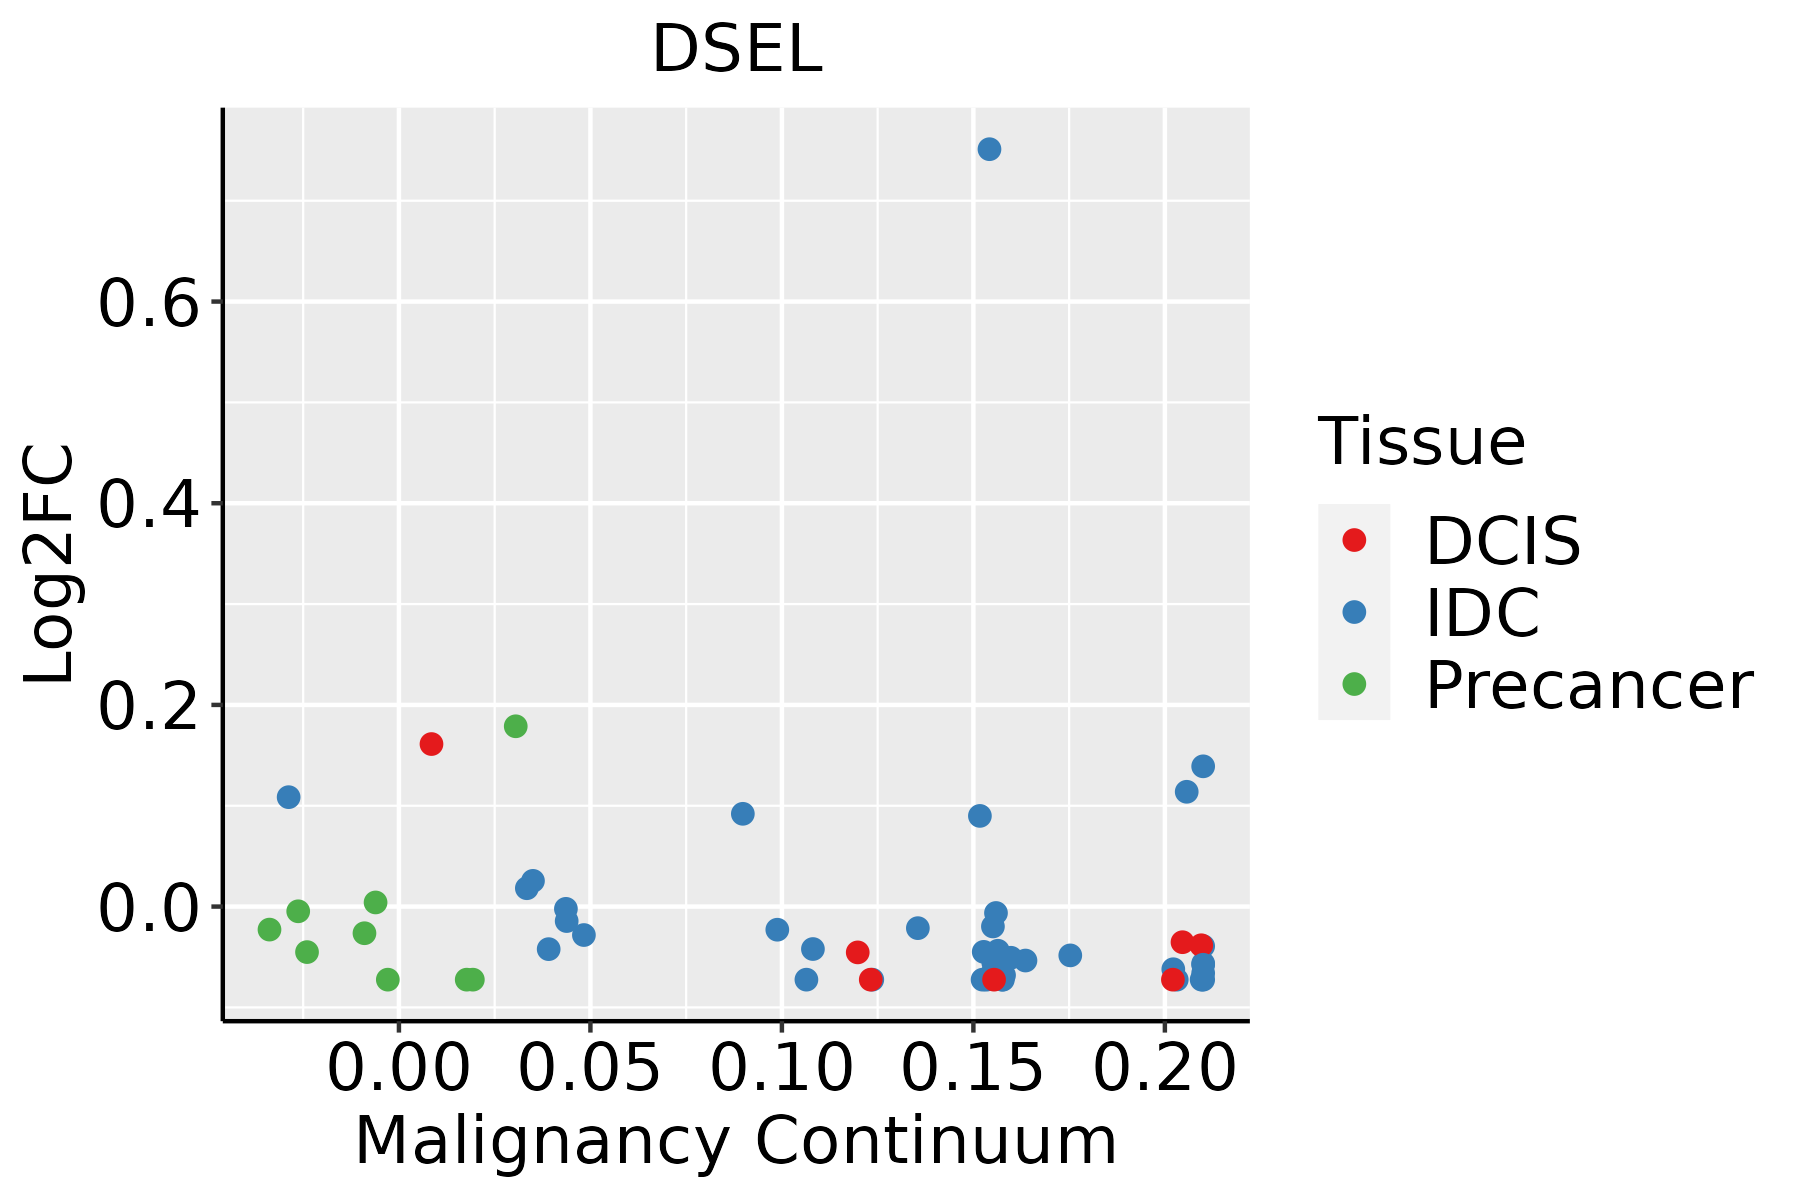 | IDC: Invasive ductal carcinoma |
| DCIS: Ductal carcinoma in situ | ||
| Precancer(BRCA1-mut): Precancerous lesion from BRCA1 mutation carriers | ||
| Esophagus | 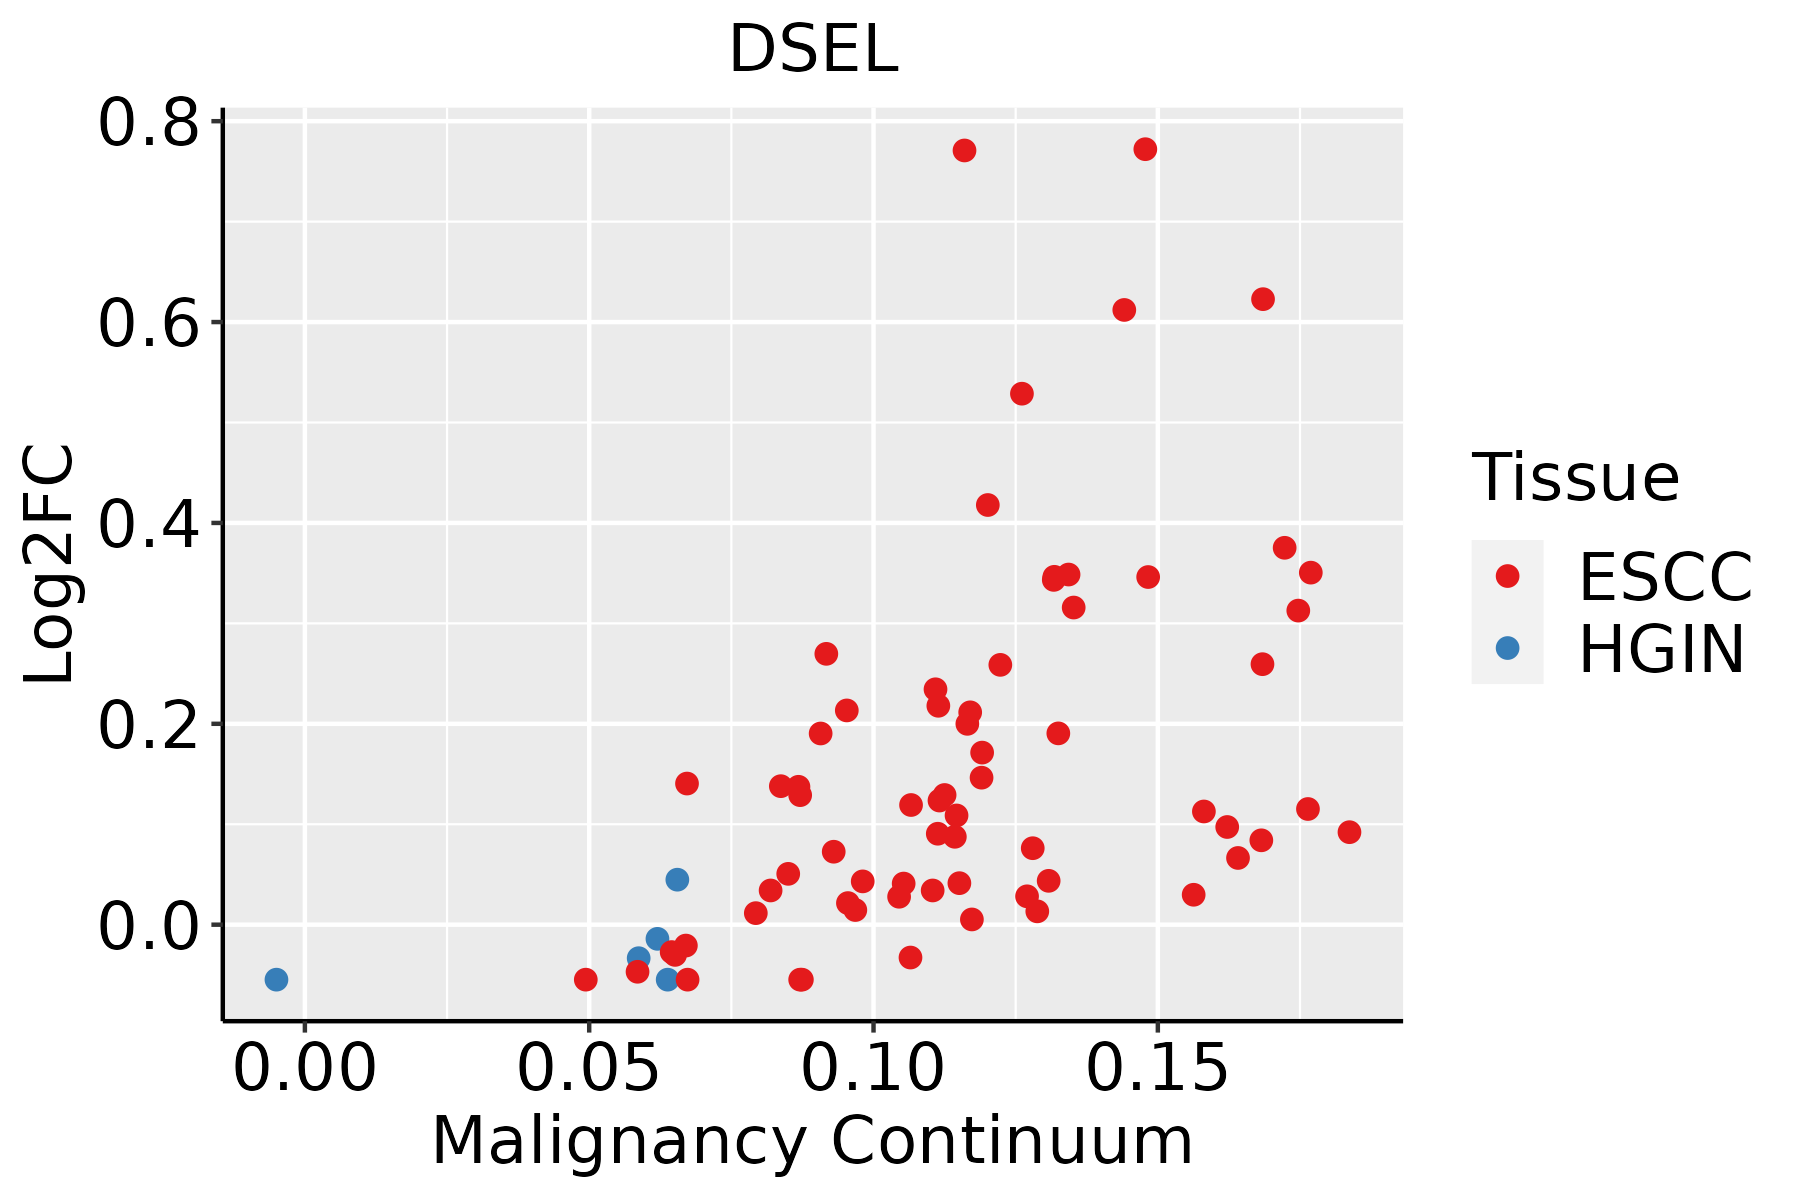 | ESCC: Esophageal squamous cell carcinoma |
| HGIN: High-grade intraepithelial neoplasias | ||
| LGIN: Low-grade intraepithelial neoplasias | ||
| Liver | 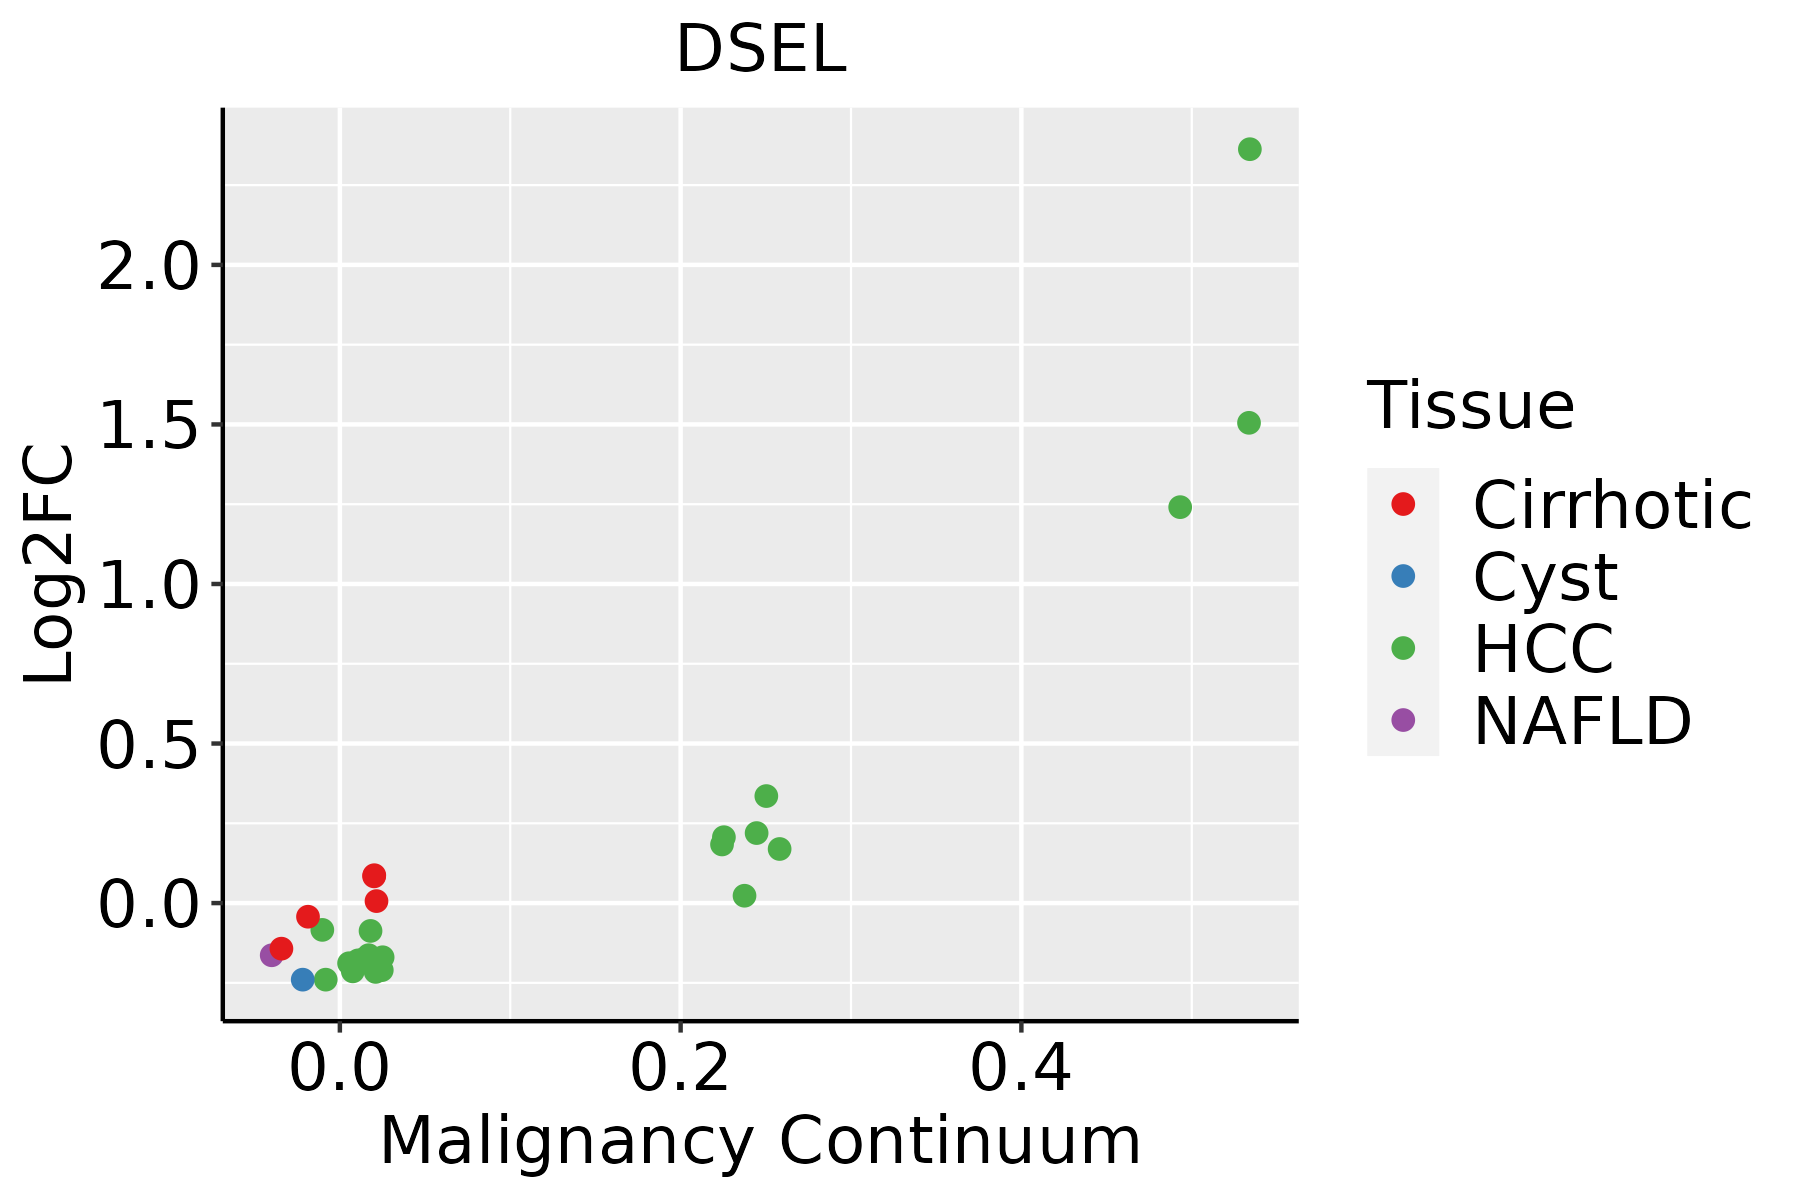 | HCC: Hepatocellular carcinoma |
| NAFLD: Non-alcoholic fatty liver disease | ||
| Thyroid | 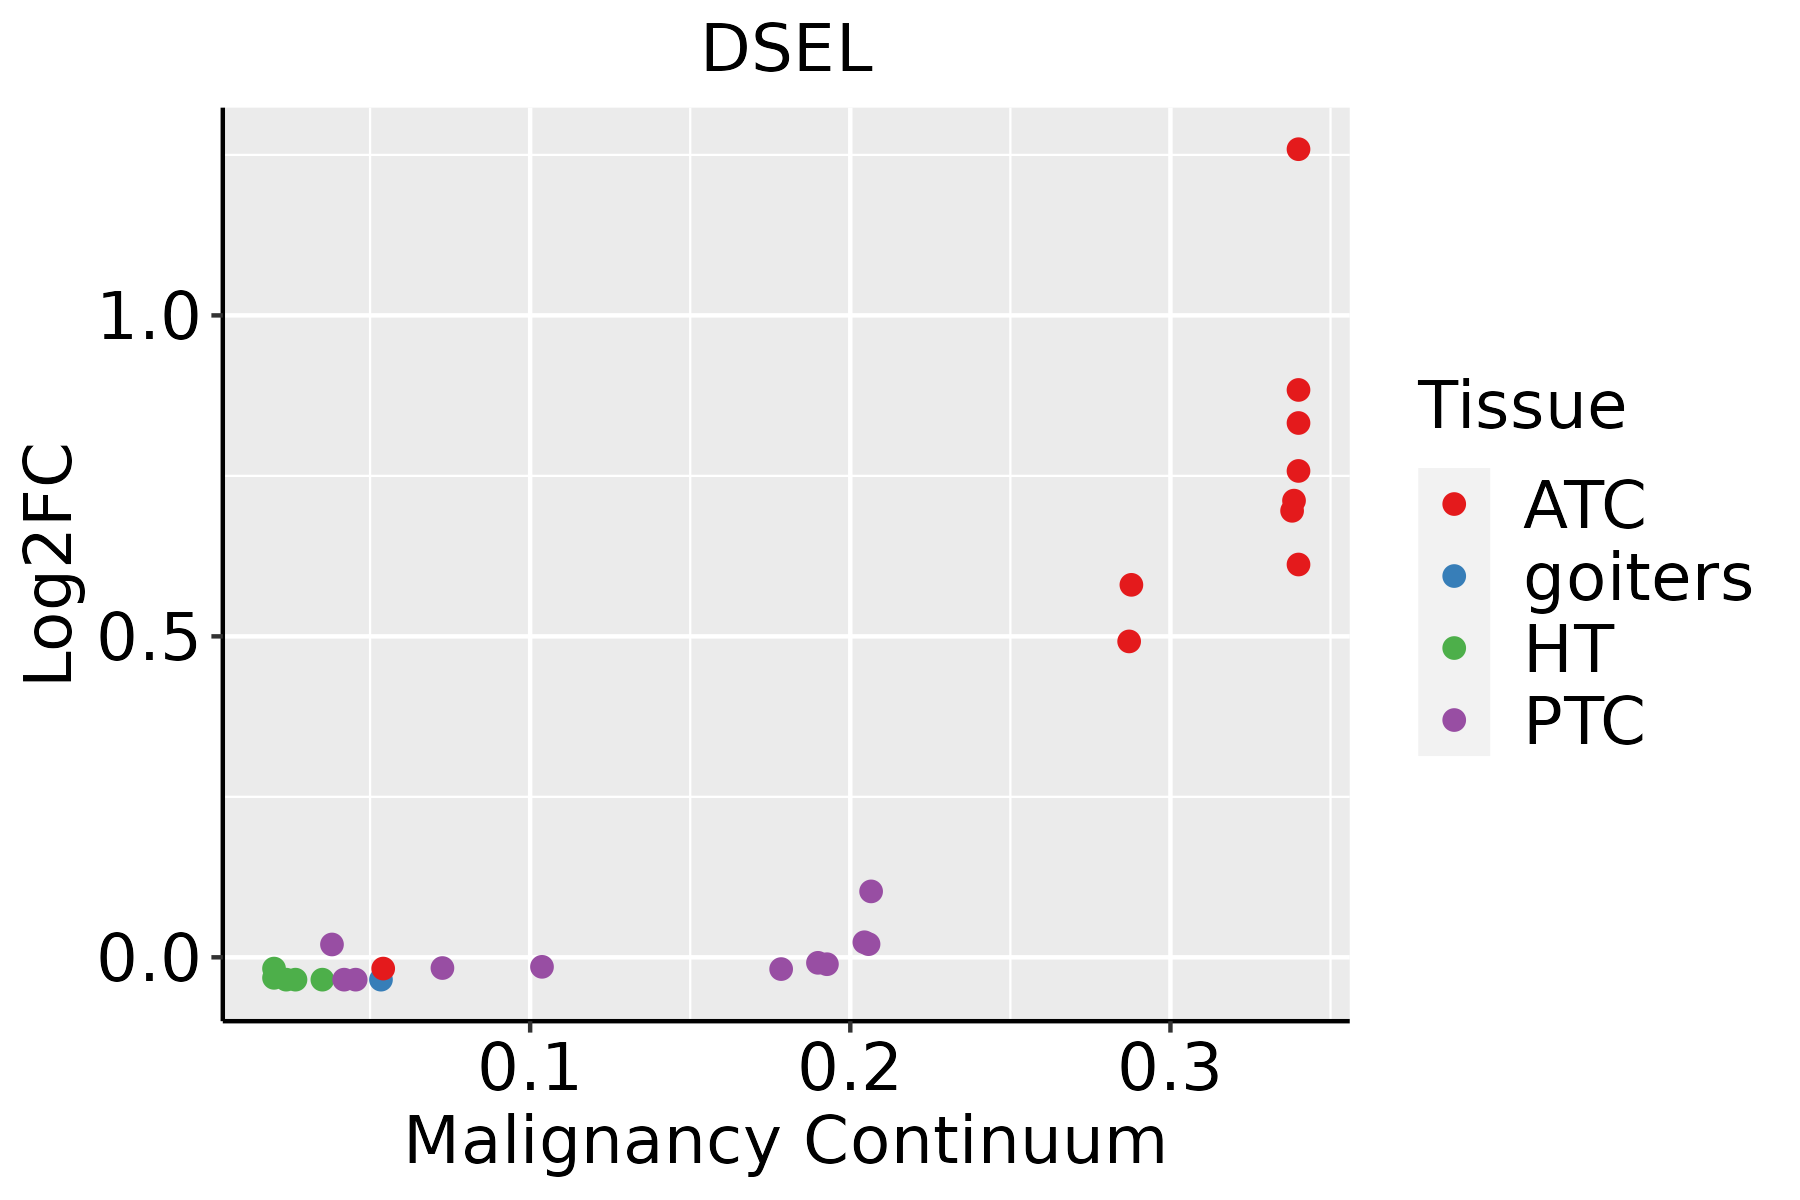 | ATC: Anaplastic thyroid cancer |
| HT: Hashimoto's thyroiditis | ||
| PTC: Papillary thyroid cancer |
| ∗log2FC in expression of this searched gene in stem-like cells from each diseased tissue sample relative to stem-like cells in normal samples in each tissue plotted against the malignancy continuum. Samples are colored based on if they are from different disease stage. |
Top |
Malignant transformation related pathway analysis |
| Find out the enriched GO biological processes and KEGG pathways involved in transition from healthy to precancer to cancer |
| Tissue | Disease Stage | Enriched GO biological Processes |
| Colorectum | AD |  |
| Colorectum | SER |  |
| Colorectum | MSS |  |
| Colorectum | MSI-H |  |
| Colorectum | FAP |  |
| ∗Top 15 enriched GO BP terms are showed in the bar plot of each disease state in each tissue. Each row represents a significant GO biological process which is colored according to the -log10(p.adjust). |
| Page: 1 2 3 4 5 6 7 8 9 |
| GO ID | Tissue | Disease Stage | Description | Gene Ratio | Bg Ratio | pvalue | p.adjust | Count |
| GO:00091002 | Esophagus | ESCC | glycoprotein metabolic process | 226/8552 | 387/18723 | 2.64e-07 | 3.94e-06 | 226 |
| GO:00067906 | Esophagus | ESCC | sulfur compound metabolic process | 201/8552 | 339/18723 | 2.64e-07 | 3.94e-06 | 201 |
| GO:00442725 | Esophagus | ESCC | sulfur compound biosynthetic process | 96/8552 | 148/18723 | 1.86e-06 | 2.16e-05 | 96 |
| GO:00091012 | Esophagus | ESCC | glycoprotein biosynthetic process | 181/8552 | 317/18723 | 2.54e-05 | 2.15e-04 | 181 |
| GO:0006029 | Esophagus | ESCC | proteoglycan metabolic process | 48/8552 | 79/18723 | 4.93e-03 | 1.89e-02 | 48 |
| GO:0030166 | Esophagus | ESCC | proteoglycan biosynthetic process | 35/8552 | 56/18723 | 8.30e-03 | 2.94e-02 | 35 |
| GO:0006024 | Esophagus | ESCC | glycosaminoglycan biosynthetic process | 45/8552 | 75/18723 | 8.75e-03 | 3.08e-02 | 45 |
| GO:0006023 | Esophagus | ESCC | aminoglycan biosynthetic process | 47/8552 | 79/18723 | 9.29e-03 | 3.23e-02 | 47 |
| GO:000679011 | Liver | Cirrhotic | sulfur compound metabolic process | 129/4634 | 339/18723 | 3.06e-08 | 1.04e-06 | 129 |
| GO:00442721 | Liver | Cirrhotic | sulfur compound biosynthetic process | 58/4634 | 148/18723 | 6.93e-05 | 7.83e-04 | 58 |
| GO:000679021 | Liver | HCC | sulfur compound metabolic process | 212/7958 | 339/18723 | 5.60e-14 | 3.39e-12 | 212 |
| GO:00442722 | Liver | HCC | sulfur compound biosynthetic process | 95/7958 | 148/18723 | 7.89e-08 | 1.58e-06 | 95 |
| GO:0009100 | Liver | HCC | glycoprotein metabolic process | 193/7958 | 387/18723 | 1.89e-03 | 9.62e-03 | 193 |
| GO:004427212 | Thyroid | ATC | sulfur compound biosynthetic process | 66/6293 | 148/18723 | 3.43e-03 | 1.53e-02 | 66 |
| GO:000910011 | Thyroid | ATC | glycoprotein metabolic process | 153/6293 | 387/18723 | 7.90e-03 | 3.06e-02 | 153 |
| Page: 1 |
| Pathway ID | Tissue | Disease Stage | Description | Gene Ratio | Bg Ratio | pvalue | p.adjust | qvalue | Count |
| Page: 1 |
Top |
Cell-cell communication analysis |
| Identification of potential cell-cell interactions between two cell types and their ligand-receptor pairs for different disease states |
| Ligand | Receptor | LRpair | Pathway | Tissue | Disease Stage |
| Page: 1 |
Top |
Single-cell gene regulatory network inference analysis |
| Find out the significant the regulons (TFs) and the target genes of each regulon across cell types for different disease states |
| TF | Cell Type | Tissue | Disease Stage | Target Gene | RSS | Regulon Activity |
| ∗The dot plots of a searched regulon are shown for all cell subpopulations in each disease state of each tissue based on the regulon specific score inferred using pySCENIC and by calculating the average expression. |
| Page: 1 |
Top |
Somatic mutation of malignant transformation related genes |
| Annotation of somatic variants for genes involved in malignant transformation |
| Hugo Symbol | Variant Class | Variant Classification | dbSNP RS | HGVSc | HGVSp | HGVSp Short | SWISSPROT | BIOTYPE | SIFT | PolyPhen | Tumor Sample Barcode | Tissue | Histology | Sex | Age | Stage | Therapy Types | Drugs | Outcome |
| DSEL | SNV | Missense_Mutation | novel | c.92C>A | p.Thr31Asn | p.T31N | Q8IZU8 | protein_coding | deleterious_low_confidence(0.03) | benign(0.124) | TCGA-AC-A2QI-01 | Breast | breast invasive carcinoma | Female | >=65 | III/IV | Chemotherapy | cytoxan | CR |
| DSEL | SNV | Missense_Mutation | c.1760N>C | p.Asn587Thr | p.N587T | Q8IZU8 | protein_coding | tolerated(0.16) | probably_damaging(0.996) | TCGA-AN-A0AJ-01 | Breast | breast invasive carcinoma | Female | >=65 | I/II | Unknown | Unknown | SD | |
| DSEL | SNV | Missense_Mutation | rs373569592 | c.1598N>T | p.Ala533Val | p.A533V | Q8IZU8 | protein_coding | deleterious(0.02) | possibly_damaging(0.745) | TCGA-AQ-A04H-01 | Breast | breast invasive carcinoma | Female | <65 | III/IV | Chemotherapy | taxotere | SD |
| DSEL | SNV | Missense_Mutation | c.1025N>T | p.Ser342Phe | p.S342F | Q8IZU8 | protein_coding | deleterious(0) | probably_damaging(0.998) | TCGA-BH-A0HF-01 | Breast | breast invasive carcinoma | Female | >=65 | I/II | Hormone Therapy | arimidex | SD | |
| DSEL | SNV | Missense_Mutation | c.3535N>G | p.Pro1179Ala | p.P1179A | Q8IZU8 | protein_coding | tolerated(0.36) | benign(0.221) | TCGA-D8-A27N-01 | Breast | breast invasive carcinoma | Female | <65 | III/IV | Chemotherapy | taxol+adriamycin+cyclophosphamide+herceptin | SD | |
| DSEL | SNV | Missense_Mutation | c.3608N>A | p.Leu1203Gln | p.L1203Q | Q8IZU8 | protein_coding | tolerated(0.18) | benign(0.021) | TCGA-E2-A1II-01 | Breast | breast invasive carcinoma | Female | <65 | I/II | Chemotherapy | doxorubicin | SD | |
| DSEL | SNV | Missense_Mutation | novel | c.1867N>A | p.Pro623Thr | p.P623T | Q8IZU8 | protein_coding | tolerated(0.13) | benign(0.281) | TCGA-LL-A7SZ-01 | Breast | breast invasive carcinoma | Female | <65 | I/II | Chemotherapy | adriamycin | CR |
| DSEL | SNV | Missense_Mutation | rs778536579 | c.916N>T | p.Arg306Cys | p.R306C | Q8IZU8 | protein_coding | deleterious(0) | probably_damaging(0.999) | TCGA-OL-A5RY-01 | Breast | breast invasive carcinoma | Female | <65 | I/II | Unknown | Unknown | SD |
| DSEL | insertion | In_Frame_Ins | novel | c.78_79insCTGTCCAACCCAACATACTACCTACCTCCACCA | p.Met26_Phe27insLeuSerAsnProThrTyrTyrLeuProProPro | p.M26_F27insLSNPTYYLPPP | Q8IZU8 | protein_coding | TCGA-A8-A095-01 | Breast | breast invasive carcinoma | Female | <65 | I/II | Chemotherapy | 5-fluorouracil | CR | ||
| DSEL | deletion | Frame_Shift_Del | novel | c.3276delN | p.Glu1092AspfsTer3 | p.E1092Dfs*3 | Q8IZU8 | protein_coding | TCGA-D8-A27V-01 | Breast | breast invasive carcinoma | Female | <65 | I/II | Hormone Therapy | tamoxiphen | SD |
| Page: 1 2 3 4 5 6 7 8 9 10 11 12 13 14 15 16 17 18 19 20 21 22 23 24 25 26 27 |
Top |
Related drugs of malignant transformation related genes |
| Identification of chemicals and drugs interact with genes involved in malignant transfromation |
| (DGIdb 4.0) |
| Entrez ID | Symbol | Category | Interaction Types | Drug Claim Name | Drug Name | PMIDs |
| Page: 1 |

Copyright 2023-Present -The University of Texas Health Science Center at Houston |