
|
|||||
|
 | |
| |
| |
| |
| |
| |
|
Gene: DSE |
Gene summary for DSE |
| Gene information | Species | Human | Gene symbol | DSE | Gene ID | 29940 |
| Gene name | dermatan sulfate epimerase | |
| Gene Alias | DS-epi1 | |
| Cytomap | 6q22.1 | |
| Gene Type | protein-coding | GO ID | GO:0006022 | UniProtAcc | Q9UL01 |
Top |
Malignant transformation analysis |
| Identification of the aberrant gene expression in precancerous and cancerous lesions by comparing the gene expression of stem-like cells in diseased tissues with normal stem cells |
| Entrez ID | Symbol | Replicates | Species | Organ | Tissue | Adj P-value | Log2FC | Malignancy |
| 29940 | DSE | LZE4T | Human | Esophagus | ESCC | 2.05e-03 | -3.80e-02 | 0.0811 |
| 29940 | DSE | LZE8T | Human | Esophagus | ESCC | 6.93e-04 | 6.33e-02 | 0.067 |
| 29940 | DSE | LZE20T | Human | Esophagus | ESCC | 1.40e-04 | 9.18e-02 | 0.0662 |
| 29940 | DSE | LZE24T | Human | Esophagus | ESCC | 4.95e-03 | 1.55e-02 | 0.0596 |
| 29940 | DSE | P1T-E | Human | Esophagus | ESCC | 1.82e-05 | 1.82e-01 | 0.0875 |
| 29940 | DSE | P2T-E | Human | Esophagus | ESCC | 1.96e-30 | 5.35e-01 | 0.1177 |
| 29940 | DSE | P4T-E | Human | Esophagus | ESCC | 8.05e-27 | 6.85e-01 | 0.1323 |
| 29940 | DSE | P5T-E | Human | Esophagus | ESCC | 7.21e-35 | 6.57e-01 | 0.1327 |
| 29940 | DSE | P8T-E | Human | Esophagus | ESCC | 4.69e-16 | 1.86e-01 | 0.0889 |
| 29940 | DSE | P10T-E | Human | Esophagus | ESCC | 1.06e-17 | 2.43e-01 | 0.116 |
| 29940 | DSE | P11T-E | Human | Esophagus | ESCC | 6.30e-10 | 3.90e-01 | 0.1426 |
| 29940 | DSE | P12T-E | Human | Esophagus | ESCC | 7.35e-41 | 7.61e-01 | 0.1122 |
| 29940 | DSE | P15T-E | Human | Esophagus | ESCC | 8.64e-24 | 6.89e-01 | 0.1149 |
| 29940 | DSE | P16T-E | Human | Esophagus | ESCC | 2.02e-30 | 5.04e-01 | 0.1153 |
| 29940 | DSE | P17T-E | Human | Esophagus | ESCC | 3.41e-08 | 1.96e-01 | 0.1278 |
| 29940 | DSE | P19T-E | Human | Esophagus | ESCC | 3.83e-04 | 5.25e-01 | 0.1662 |
| 29940 | DSE | P20T-E | Human | Esophagus | ESCC | 6.40e-12 | 1.54e-01 | 0.1124 |
| 29940 | DSE | P21T-E | Human | Esophagus | ESCC | 1.10e-30 | 7.61e-01 | 0.1617 |
| 29940 | DSE | P22T-E | Human | Esophagus | ESCC | 2.01e-16 | 2.59e-01 | 0.1236 |
| 29940 | DSE | P23T-E | Human | Esophagus | ESCC | 5.48e-16 | 2.71e-01 | 0.108 |
| Page: 1 2 3 4 5 |
| Tissue | Expression Dynamics | Abbreviation |
| Esophagus | 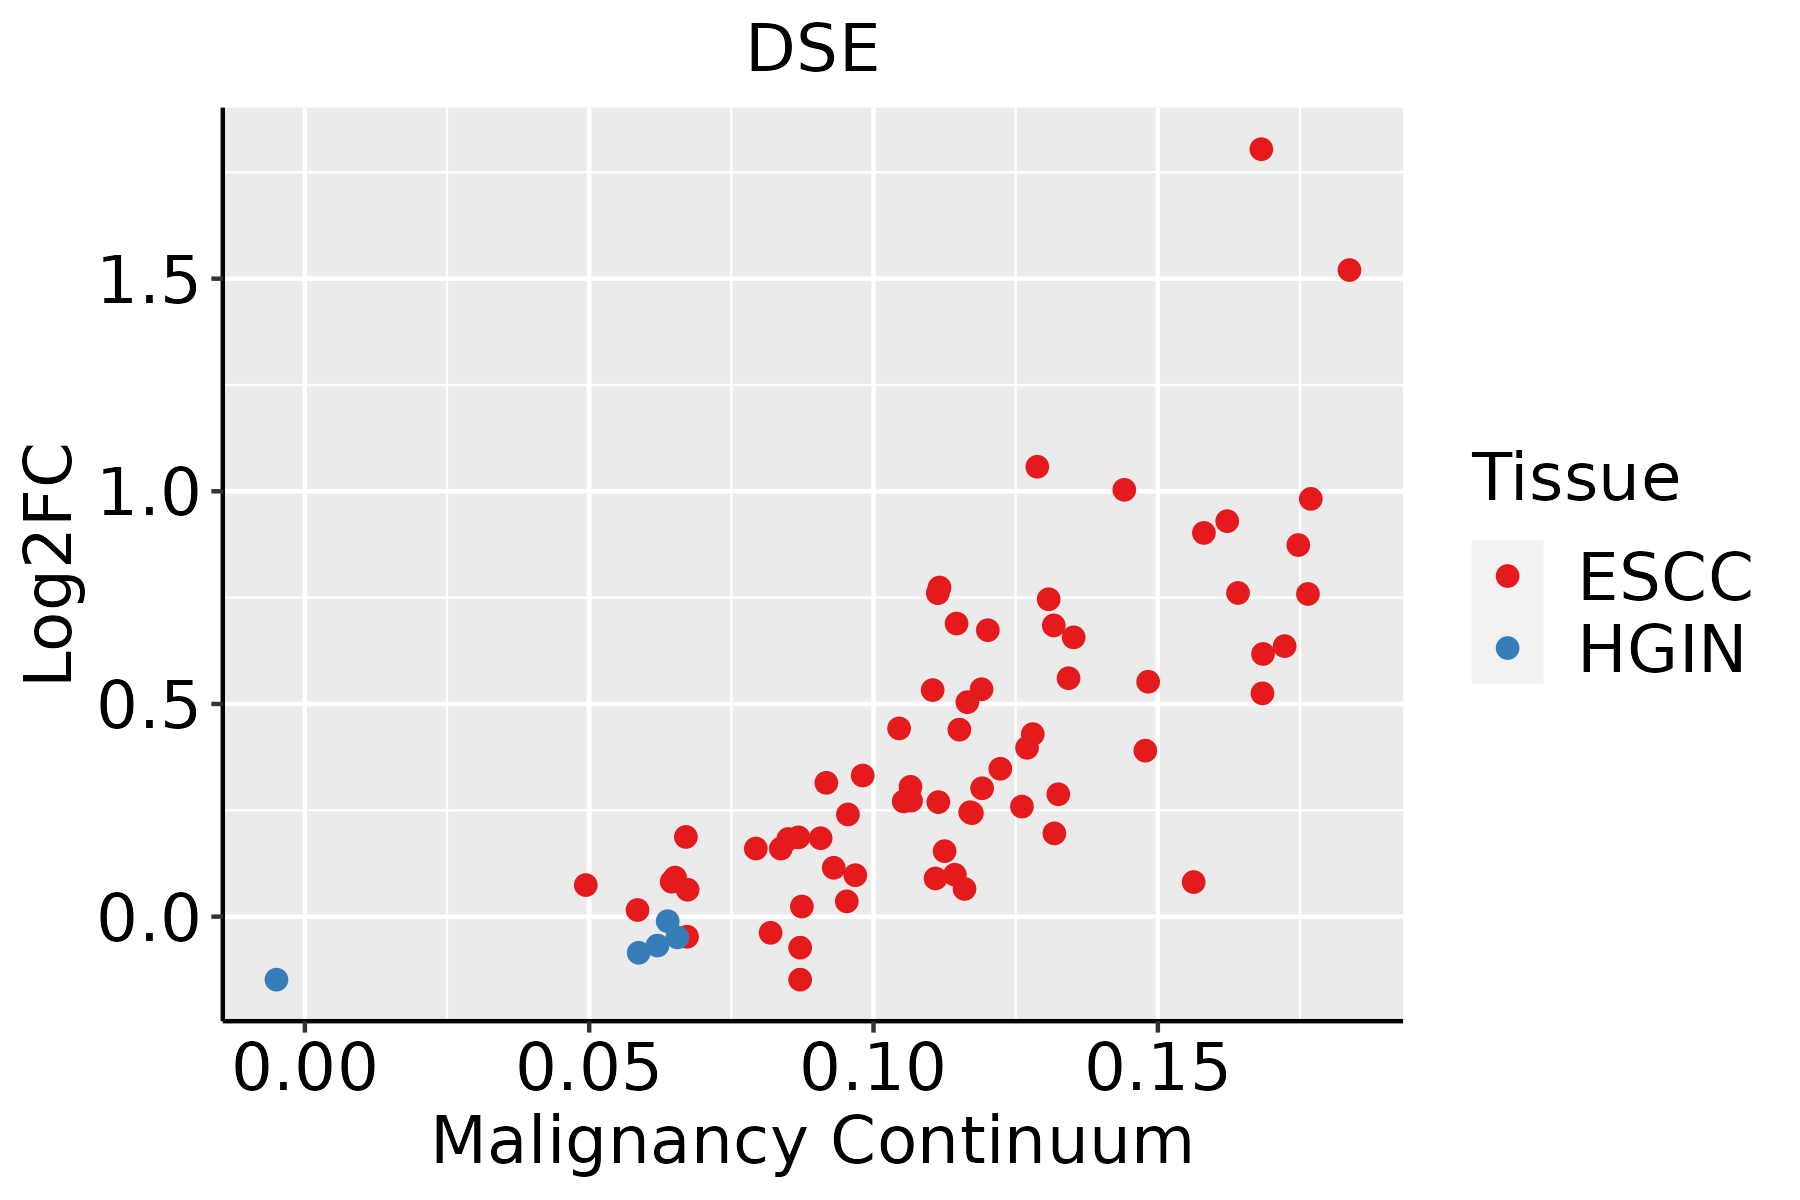 | ESCC: Esophageal squamous cell carcinoma |
| HGIN: High-grade intraepithelial neoplasias | ||
| LGIN: Low-grade intraepithelial neoplasias | ||
| Oral Cavity | 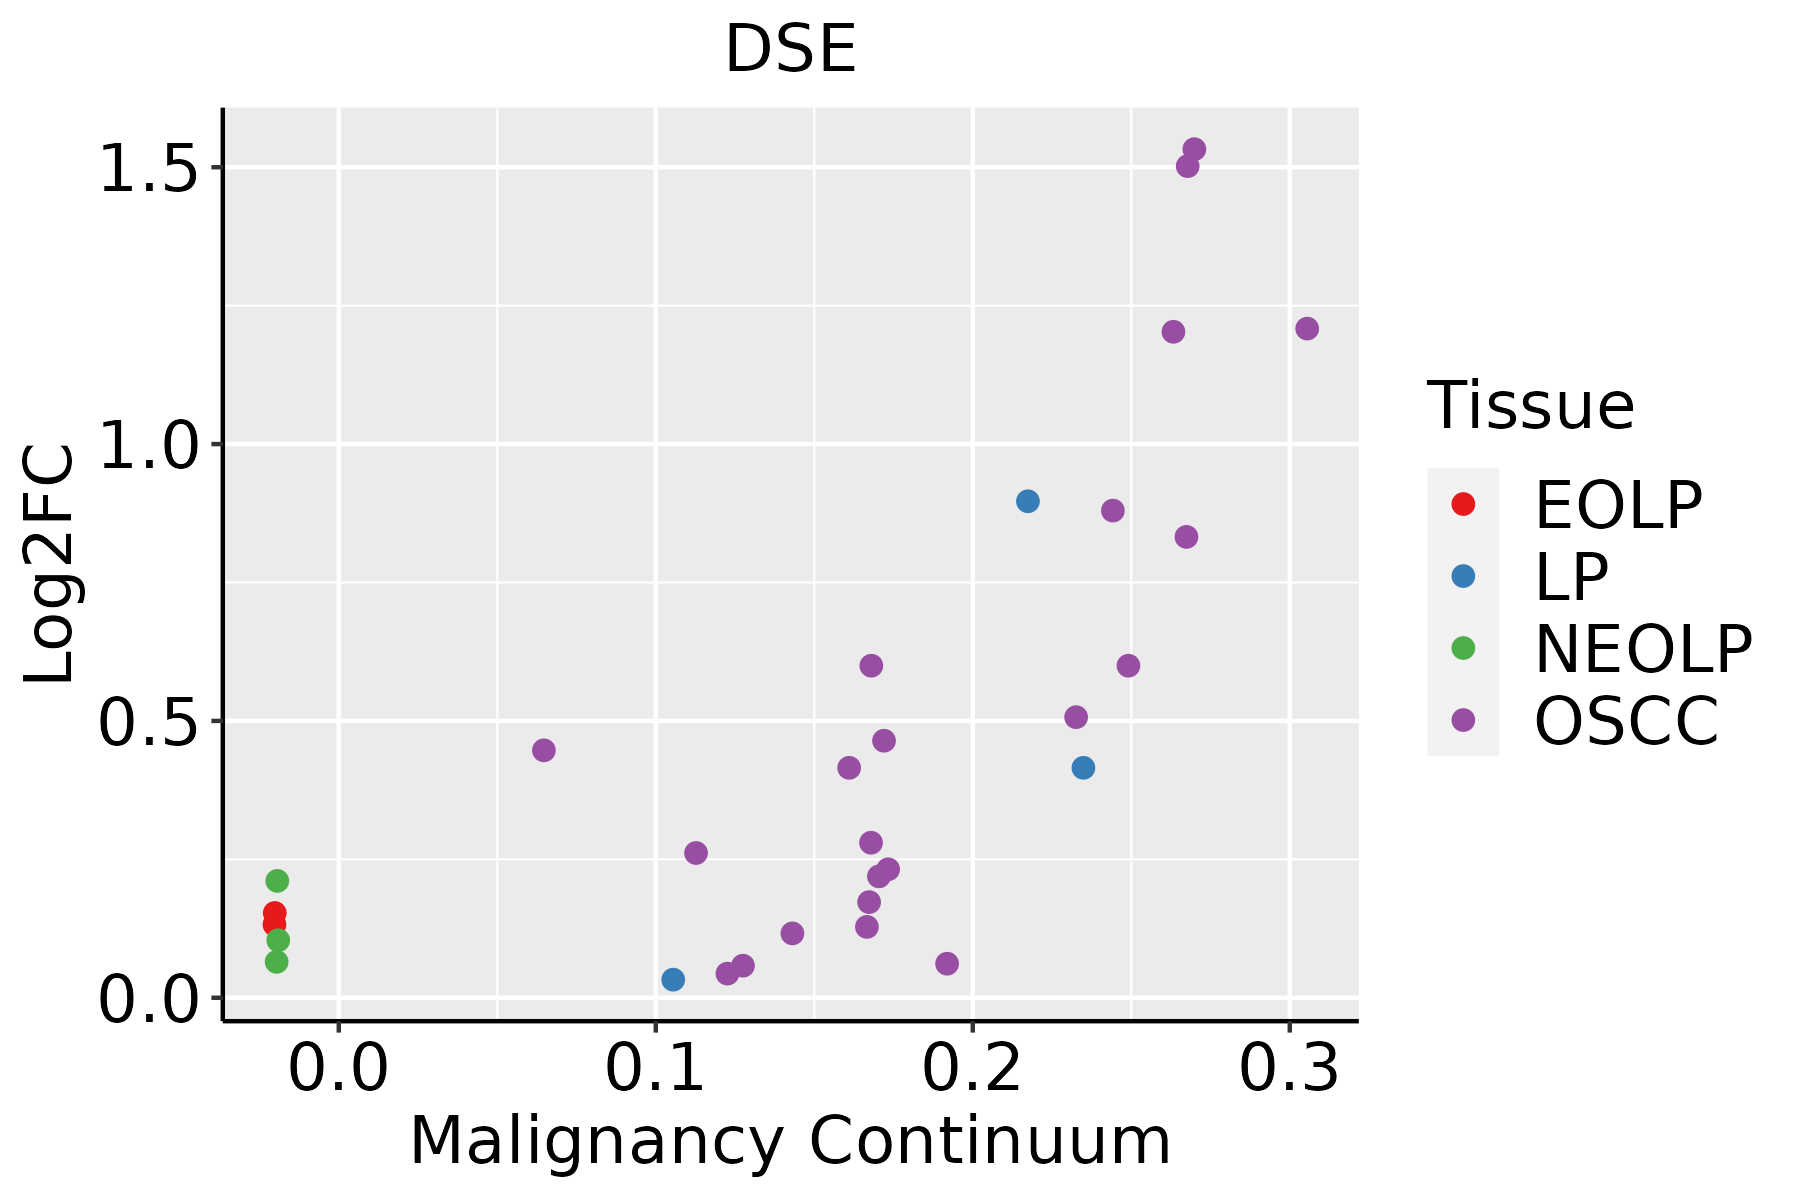 | EOLP: Erosive Oral lichen planus |
| LP: leukoplakia | ||
| NEOLP: Non-erosive oral lichen planus | ||
| OSCC: Oral squamous cell carcinoma | ||
| Skin |  | AK: Actinic keratosis |
| cSCC: Cutaneous squamous cell carcinoma | ||
| SCCIS:squamous cell carcinoma in situ | ||
| Thyroid |  | ATC: Anaplastic thyroid cancer |
| HT: Hashimoto's thyroiditis | ||
| PTC: Papillary thyroid cancer |
| ∗log2FC in expression of this searched gene in stem-like cells from each diseased tissue sample relative to stem-like cells in normal samples in each tissue plotted against the malignancy continuum. Samples are colored based on if they are from different disease stage. |
Top |
Malignant transformation related pathway analysis |
| Find out the enriched GO biological processes and KEGG pathways involved in transition from healthy to precancer to cancer |
| Tissue | Disease Stage | Enriched GO biological Processes |
| Colorectum | AD |  |
| Colorectum | SER |  |
| Colorectum | MSS |  |
| Colorectum | MSI-H |  |
| Colorectum | FAP |  |
| ∗Top 15 enriched GO BP terms are showed in the bar plot of each disease state in each tissue. Each row represents a significant GO biological process which is colored according to the -log10(p.adjust). |
| Page: 1 2 3 4 5 6 7 8 9 |
| GO ID | Tissue | Disease Stage | Description | Gene Ratio | Bg Ratio | pvalue | p.adjust | Count |
| GO:00091002 | Esophagus | ESCC | glycoprotein metabolic process | 226/8552 | 387/18723 | 2.64e-07 | 3.94e-06 | 226 |
| GO:00067906 | Esophagus | ESCC | sulfur compound metabolic process | 201/8552 | 339/18723 | 2.64e-07 | 3.94e-06 | 201 |
| GO:00442725 | Esophagus | ESCC | sulfur compound biosynthetic process | 96/8552 | 148/18723 | 1.86e-06 | 2.16e-05 | 96 |
| GO:00091012 | Esophagus | ESCC | glycoprotein biosynthetic process | 181/8552 | 317/18723 | 2.54e-05 | 2.15e-04 | 181 |
| GO:0006029 | Esophagus | ESCC | proteoglycan metabolic process | 48/8552 | 79/18723 | 4.93e-03 | 1.89e-02 | 48 |
| GO:0030166 | Esophagus | ESCC | proteoglycan biosynthetic process | 35/8552 | 56/18723 | 8.30e-03 | 2.94e-02 | 35 |
| GO:0006024 | Esophagus | ESCC | glycosaminoglycan biosynthetic process | 45/8552 | 75/18723 | 8.75e-03 | 3.08e-02 | 45 |
| GO:0006023 | Esophagus | ESCC | aminoglycan biosynthetic process | 47/8552 | 79/18723 | 9.29e-03 | 3.23e-02 | 47 |
| GO:0030201 | Esophagus | ESCC | heparan sulfate proteoglycan metabolic process | 21/8552 | 31/18723 | 1.10e-02 | 3.70e-02 | 21 |
| GO:000679011 | Liver | Cirrhotic | sulfur compound metabolic process | 129/4634 | 339/18723 | 3.06e-08 | 1.04e-06 | 129 |
| GO:00442721 | Liver | Cirrhotic | sulfur compound biosynthetic process | 58/4634 | 148/18723 | 6.93e-05 | 7.83e-04 | 58 |
| GO:000679021 | Liver | HCC | sulfur compound metabolic process | 212/7958 | 339/18723 | 5.60e-14 | 3.39e-12 | 212 |
| GO:00442722 | Liver | HCC | sulfur compound biosynthetic process | 95/7958 | 148/18723 | 7.89e-08 | 1.58e-06 | 95 |
| GO:0009100 | Liver | HCC | glycoprotein metabolic process | 193/7958 | 387/18723 | 1.89e-03 | 9.62e-03 | 193 |
| GO:00442724 | Oral cavity | OSCC | sulfur compound biosynthetic process | 82/7305 | 148/18723 | 3.71e-05 | 3.31e-04 | 82 |
| GO:00067905 | Oral cavity | OSCC | sulfur compound metabolic process | 168/7305 | 339/18723 | 4.50e-05 | 3.84e-04 | 168 |
| GO:0030206 | Oral cavity | OSCC | chondroitin sulfate biosynthetic process | 15/7305 | 18/18723 | 1.53e-04 | 1.07e-03 | 15 |
| GO:00091001 | Oral cavity | OSCC | glycoprotein metabolic process | 185/7305 | 387/18723 | 2.37e-04 | 1.54e-03 | 185 |
| GO:00091011 | Oral cavity | OSCC | glycoprotein biosynthetic process | 151/7305 | 317/18723 | 1.01e-03 | 5.26e-03 | 151 |
| GO:0050650 | Oral cavity | OSCC | chondroitin sulfate proteoglycan biosynthetic process | 16/7305 | 23/18723 | 2.93e-03 | 1.27e-02 | 16 |
| Page: 1 2 |
| Pathway ID | Tissue | Disease Stage | Description | Gene Ratio | Bg Ratio | pvalue | p.adjust | qvalue | Count |
| hsa00532 | Oral cavity | OSCC | Glycosaminoglycan biosynthesis - chondroitin sulfate / dermatan sulfate | 16/3704 | 21/8465 | 2.61e-03 | 6.77e-03 | 3.45e-03 | 16 |
| hsa005321 | Oral cavity | OSCC | Glycosaminoglycan biosynthesis - chondroitin sulfate / dermatan sulfate | 16/3704 | 21/8465 | 2.61e-03 | 6.77e-03 | 3.45e-03 | 16 |
| Page: 1 |
Top |
Cell-cell communication analysis |
| Identification of potential cell-cell interactions between two cell types and their ligand-receptor pairs for different disease states |
| Ligand | Receptor | LRpair | Pathway | Tissue | Disease Stage |
| Page: 1 |
Top |
Single-cell gene regulatory network inference analysis |
| Find out the significant the regulons (TFs) and the target genes of each regulon across cell types for different disease states |
| TF | Cell Type | Tissue | Disease Stage | Target Gene | RSS | Regulon Activity |
| ∗The dot plots of a searched regulon are shown for all cell subpopulations in each disease state of each tissue based on the regulon specific score inferred using pySCENIC and by calculating the average expression. |
| Page: 1 |
Top |
Somatic mutation of malignant transformation related genes |
| Annotation of somatic variants for genes involved in malignant transformation |
| Hugo Symbol | Variant Class | Variant Classification | dbSNP RS | HGVSc | HGVSp | HGVSp Short | SWISSPROT | BIOTYPE | SIFT | PolyPhen | Tumor Sample Barcode | Tissue | Histology | Sex | Age | Stage | Therapy Types | Drugs | Outcome |
| DSE | SNV | Missense_Mutation | c.8N>T | p.Thr3Ile | p.T3I | Q9UL01 | protein_coding | deleterious_low_confidence(0) | possibly_damaging(0.814) | TCGA-A2-A0YG-01 | Breast | breast invasive carcinoma | Female | <65 | III/IV | Chemotherapy | cytoxan | SD | |
| DSE | SNV | Missense_Mutation | c.249G>C | p.Leu83Phe | p.L83F | Q9UL01 | protein_coding | deleterious(0.05) | benign(0.367) | TCGA-AC-A23H-01 | Breast | breast invasive carcinoma | Female | >=65 | I/II | Unknown | Unknown | PD | |
| DSE | SNV | Missense_Mutation | c.2146C>A | p.Arg716Ser | p.R716S | Q9UL01 | protein_coding | deleterious_low_confidence(0.02) | benign(0.014) | TCGA-AN-A046-01 | Breast | breast invasive carcinoma | Female | >=65 | I/II | Unknown | Unknown | SD | |
| DSE | SNV | Missense_Mutation | c.1798G>C | p.Asp600His | p.D600H | Q9UL01 | protein_coding | deleterious(0.03) | probably_damaging(0.982) | TCGA-AO-A0JE-01 | Breast | breast invasive carcinoma | Female | <65 | III/IV | Chemotherapy | doxorubicin | SD | |
| DSE | SNV | Missense_Mutation | novel | c.2741N>A | p.Val914Asp | p.V914D | Q9UL01 | protein_coding | deleterious_low_confidence(0) | possibly_damaging(0.648) | TCGA-AR-A0TU-01 | Breast | breast invasive carcinoma | Female | <65 | I/II | Unspecific | Doxorubicin | SD |
| DSE | SNV | Missense_Mutation | novel | c.2743N>T | p.Met915Leu | p.M915L | Q9UL01 | protein_coding | tolerated_low_confidence(1) | benign(0) | TCGA-AR-A0TU-01 | Breast | breast invasive carcinoma | Female | <65 | I/II | Unspecific | Doxorubicin | SD |
| DSE | SNV | Missense_Mutation | c.2690C>T | p.Ser897Phe | p.S897F | Q9UL01 | protein_coding | deleterious_low_confidence(0) | possibly_damaging(0.748) | TCGA-AR-A0TX-01 | Breast | breast invasive carcinoma | Female | <65 | I/II | Unknown | Unknown | SD | |
| DSE | SNV | Missense_Mutation | c.1494G>T | p.Trp498Cys | p.W498C | Q9UL01 | protein_coding | deleterious(0) | probably_damaging(0.997) | TCGA-B6-A0I6-01 | Breast | breast invasive carcinoma | Female | <65 | I/II | Unknown | Unknown | PD | |
| DSE | SNV | Missense_Mutation | c.239N>A | p.Ser80Tyr | p.S80Y | Q9UL01 | protein_coding | deleterious(0.01) | benign(0.1) | TCGA-BH-A18Q-01 | Breast | breast invasive carcinoma | Female | <65 | I/II | Unknown | Unknown | SD | |
| DSE | SNV | Missense_Mutation | novel | c.1547N>G | p.Asp516Gly | p.D516G | Q9UL01 | protein_coding | tolerated(0.85) | benign(0.001) | TCGA-C8-A274-01 | Breast | breast invasive carcinoma | Female | <65 | I/II | Hormone Therapy | tamoxiphen | SD |
| Page: 1 2 3 4 5 6 7 8 9 10 11 12 |
Top |
Related drugs of malignant transformation related genes |
| Identification of chemicals and drugs interact with genes involved in malignant transfromation |
| (DGIdb 4.0) |
| Entrez ID | Symbol | Category | Interaction Types | Drug Claim Name | Drug Name | PMIDs |
| 29940 | DSE | ENZYME | abiraterone | ABIRATERONE | ||
| 29940 | DSE | ENZYME | prednisolone | PREDNISOLONE |
| Page: 1 |

Copyright 2023-Present -The University of Texas Health Science Center at Houston |