
|
|||||
|
 | |
| |
| |
| |
| |
| |
|
Gene: DSCR3 |
Gene summary for DSCR3 |
| Gene information | Species | Human | Gene symbol | DSCR3 | Gene ID | 10311 |
| Gene name | VPS26 endosomal protein sorting factor C | |
| Gene Alias | DCRA | |
| Cytomap | 21q22.13 | |
| Gene Type | protein-coding | GO ID | GO:0006810 | UniProtAcc | A8MY26 |
Top |
Malignant transformation analysis |
| Identification of the aberrant gene expression in precancerous and cancerous lesions by comparing the gene expression of stem-like cells in diseased tissues with normal stem cells |
| Entrez ID | Symbol | Replicates | Species | Organ | Tissue | Adj P-value | Log2FC | Malignancy |
| 10311 | DSCR3 | P1T-E | Human | Esophagus | ESCC | 1.54e-10 | 2.04e-01 | 0.0875 |
| 10311 | DSCR3 | P2T-E | Human | Esophagus | ESCC | 7.22e-14 | 2.09e-01 | 0.1177 |
| 10311 | DSCR3 | P4T-E | Human | Esophagus | ESCC | 5.36e-23 | 4.79e-01 | 0.1323 |
| 10311 | DSCR3 | P5T-E | Human | Esophagus | ESCC | 4.44e-19 | 2.98e-01 | 0.1327 |
| 10311 | DSCR3 | P8T-E | Human | Esophagus | ESCC | 2.49e-08 | 1.49e-01 | 0.0889 |
| 10311 | DSCR3 | P9T-E | Human | Esophagus | ESCC | 1.46e-06 | 1.93e-01 | 0.1131 |
| 10311 | DSCR3 | P10T-E | Human | Esophagus | ESCC | 6.70e-26 | 4.38e-01 | 0.116 |
| 10311 | DSCR3 | P11T-E | Human | Esophagus | ESCC | 1.96e-09 | 3.24e-01 | 0.1426 |
| 10311 | DSCR3 | P12T-E | Human | Esophagus | ESCC | 1.55e-23 | 2.85e-01 | 0.1122 |
| 10311 | DSCR3 | P15T-E | Human | Esophagus | ESCC | 1.89e-22 | 1.77e-01 | 0.1149 |
| 10311 | DSCR3 | P16T-E | Human | Esophagus | ESCC | 1.01e-15 | 3.13e-01 | 0.1153 |
| 10311 | DSCR3 | P17T-E | Human | Esophagus | ESCC | 5.01e-08 | 2.38e-01 | 0.1278 |
| 10311 | DSCR3 | P19T-E | Human | Esophagus | ESCC | 9.00e-05 | 4.00e-01 | 0.1662 |
| 10311 | DSCR3 | P20T-E | Human | Esophagus | ESCC | 6.48e-16 | 2.22e-01 | 0.1124 |
| 10311 | DSCR3 | P21T-E | Human | Esophagus | ESCC | 4.77e-30 | 2.95e-01 | 0.1617 |
| 10311 | DSCR3 | P22T-E | Human | Esophagus | ESCC | 2.79e-20 | 2.91e-01 | 0.1236 |
| 10311 | DSCR3 | P23T-E | Human | Esophagus | ESCC | 2.29e-24 | 4.41e-01 | 0.108 |
| 10311 | DSCR3 | P24T-E | Human | Esophagus | ESCC | 4.30e-16 | 2.52e-01 | 0.1287 |
| 10311 | DSCR3 | P26T-E | Human | Esophagus | ESCC | 4.95e-31 | 4.09e-01 | 0.1276 |
| 10311 | DSCR3 | P27T-E | Human | Esophagus | ESCC | 2.81e-29 | 3.72e-01 | 0.1055 |
| Page: 1 2 3 4 |
| Tissue | Expression Dynamics | Abbreviation |
| Esophagus | 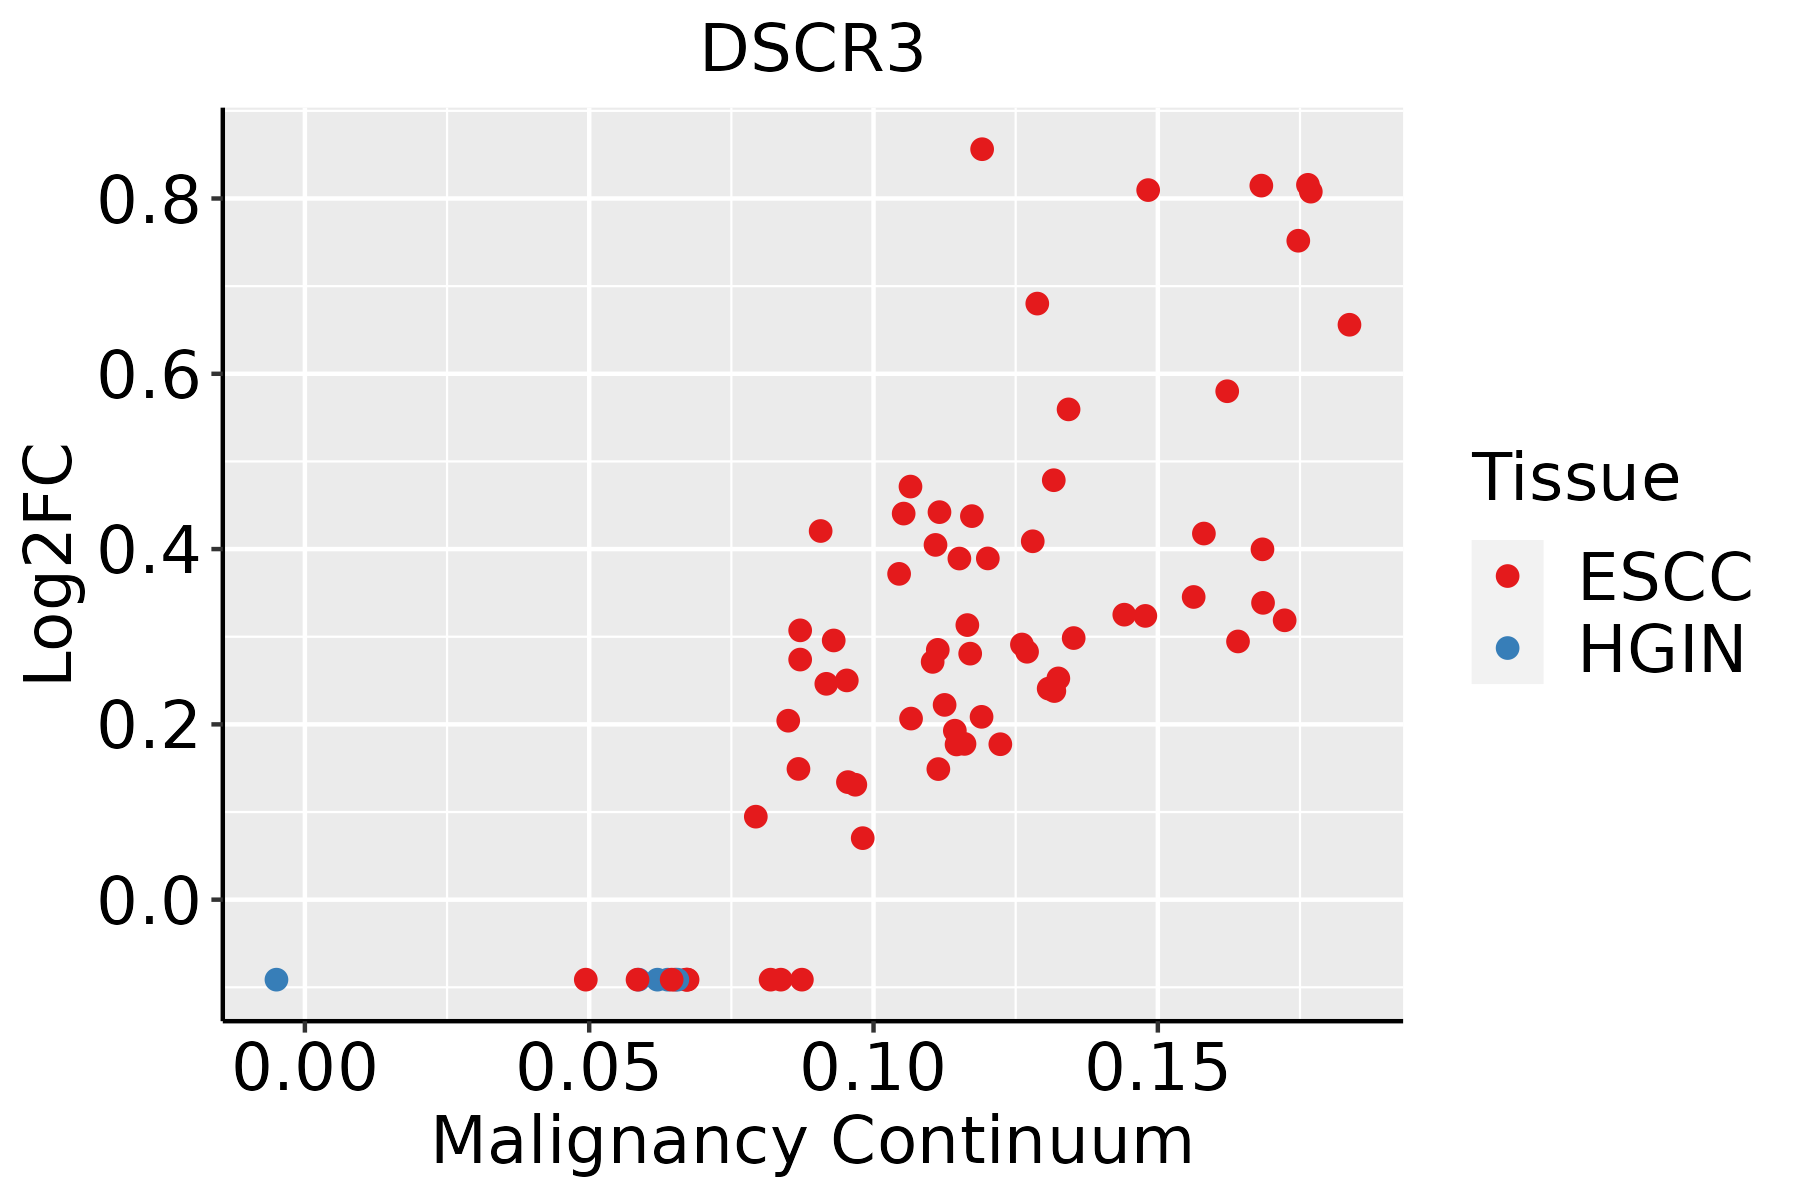 | ESCC: Esophageal squamous cell carcinoma |
| HGIN: High-grade intraepithelial neoplasias | ||
| LGIN: Low-grade intraepithelial neoplasias | ||
| Oral Cavity |  | EOLP: Erosive Oral lichen planus |
| LP: leukoplakia | ||
| NEOLP: Non-erosive oral lichen planus | ||
| OSCC: Oral squamous cell carcinoma |
| ∗log2FC in expression of this searched gene in stem-like cells from each diseased tissue sample relative to stem-like cells in normal samples in each tissue plotted against the malignancy continuum. Samples are colored based on if they are from different disease stage. |
Top |
Malignant transformation related pathway analysis |
| Find out the enriched GO biological processes and KEGG pathways involved in transition from healthy to precancer to cancer |
| Tissue | Disease Stage | Enriched GO biological Processes |
| Colorectum | AD |  |
| Colorectum | SER |  |
| Colorectum | MSS |  |
| Colorectum | MSI-H |  |
| Colorectum | FAP |  |
| ∗Top 15 enriched GO BP terms are showed in the bar plot of each disease state in each tissue. Each row represents a significant GO biological process which is colored according to the -log10(p.adjust). |
| Page: 1 2 3 4 5 6 7 8 9 |
| GO ID | Tissue | Disease Stage | Description | Gene Ratio | Bg Ratio | pvalue | p.adjust | Count |
| Page: 1 |
| Pathway ID | Tissue | Disease Stage | Description | Gene Ratio | Bg Ratio | pvalue | p.adjust | qvalue | Count |
| Page: 1 |
Top |
Cell-cell communication analysis |
| Identification of potential cell-cell interactions between two cell types and their ligand-receptor pairs for different disease states |
| Ligand | Receptor | LRpair | Pathway | Tissue | Disease Stage |
| Page: 1 |
Top |
Single-cell gene regulatory network inference analysis |
| Find out the significant the regulons (TFs) and the target genes of each regulon across cell types for different disease states |
| TF | Cell Type | Tissue | Disease Stage | Target Gene | RSS | Regulon Activity |
| ∗The dot plots of a searched regulon are shown for all cell subpopulations in each disease state of each tissue based on the regulon specific score inferred using pySCENIC and by calculating the average expression. |
| Page: 1 |
Top |
Somatic mutation of malignant transformation related genes |
| Annotation of somatic variants for genes involved in malignant transformation |
| Hugo Symbol | Variant Class | Variant Classification | dbSNP RS | HGVSc | HGVSp | HGVSp Short | SWISSPROT | BIOTYPE | SIFT | PolyPhen | Tumor Sample Barcode | Tissue | Histology | Sex | Age | Stage | Therapy Types | Drugs | Outcome |
| DSCR3 | SNV | Missense_Mutation | novel | c.794C>A | p.Thr265Asn | p.T265N | O14972 | protein_coding | deleterious(0) | possibly_damaging(0.826) | TCGA-A2-A04T-01 | Breast | breast invasive carcinoma | Female | <65 | I/II | Chemotherapy | cyclophosphamide | SD |
| DSCR3 | SNV | Missense_Mutation | c.210G>C | p.Gln70His | p.Q70H | O14972 | protein_coding | deleterious(0.01) | possibly_damaging(0.852) | TCGA-AC-A23H-01 | Breast | breast invasive carcinoma | Female | >=65 | I/II | Unknown | Unknown | PD | |
| DSCR3 | SNV | Missense_Mutation | c.721G>C | p.Asp241His | p.D241H | O14972 | protein_coding | deleterious(0) | probably_damaging(0.989) | TCGA-E2-A1LH-01 | Breast | breast invasive carcinoma | Female | <65 | I/II | Chemotherapy | adriamycin | SD | |
| DSCR3 | SNV | Missense_Mutation | novel | c.416N>G | p.Phe139Cys | p.F139C | O14972 | protein_coding | deleterious(0) | probably_damaging(0.994) | TCGA-AA-3984-01 | Colorectum | colon adenocarcinoma | Female | <65 | I/II | Unknown | Unknown | SD |
| DSCR3 | SNV | Missense_Mutation | c.322N>G | p.Thr108Ala | p.T108A | O14972 | protein_coding | deleterious(0) | probably_damaging(0.984) | TCGA-AD-A5EJ-01 | Colorectum | colon adenocarcinoma | Female | >=65 | I/II | Unknown | Unknown | SD | |
| DSCR3 | SNV | Missense_Mutation | c.718N>A | p.Gly240Arg | p.G240R | O14972 | protein_coding | deleterious(0) | probably_damaging(1) | TCGA-F4-6570-01 | Colorectum | colon adenocarcinoma | Female | >=65 | I/II | Unknown | Unknown | SD | |
| DSCR3 | SNV | Missense_Mutation | rs746453273 | c.242N>T | p.Pro81Leu | p.P81L | O14972 | protein_coding | deleterious(0.01) | possibly_damaging(0.722) | TCGA-F4-6805-01 | Colorectum | colon adenocarcinoma | Female | <65 | I/II | Chemotherapy | xeloda | CR |
| DSCR3 | SNV | Missense_Mutation | rs766553233 | c.361N>T | p.Arg121Cys | p.R121C | O14972 | protein_coding | deleterious(0) | probably_damaging(0.973) | TCGA-RU-A8FL-01 | Colorectum | colon adenocarcinoma | Male | <65 | III/IV | Chemotherapy | folfox | PD |
| DSCR3 | SNV | Missense_Mutation | c.664N>A | p.Ala222Thr | p.A222T | O14972 | protein_coding | deleterious(0.02) | possibly_damaging(0.67) | TCGA-AJ-A2QO-01 | Endometrium | uterine corpus endometrioid carcinoma | Female | >=65 | I/II | Unknown | Unknown | SD | |
| DSCR3 | SNV | Missense_Mutation | rs143165732 | c.625N>A | p.Val209Met | p.V209M | O14972 | protein_coding | deleterious(0) | benign(0.034) | TCGA-AJ-A3BH-01 | Endometrium | uterine corpus endometrioid carcinoma | Female | Unknown | I/II | Unknown | Unknown | SD |
| Page: 1 2 3 4 |
Top |
Related drugs of malignant transformation related genes |
| Identification of chemicals and drugs interact with genes involved in malignant transfromation |
| (DGIdb 4.0) |
| Entrez ID | Symbol | Category | Interaction Types | Drug Claim Name | Drug Name | PMIDs |
| Page: 1 |

Copyright 2023-Present -The University of Texas Health Science Center at Houston |