
|
|||||
|
 | |
| |
| |
| |
| |
| |
|
Gene: DSCC1 |
Gene summary for DSCC1 |
| Gene information | Species | Human | Gene symbol | DSCC1 | Gene ID | 79075 |
| Gene name | DNA replication and sister chromatid cohesion 1 | |
| Gene Alias | DCC1 | |
| Cytomap | 8q24.12 | |
| Gene Type | protein-coding | GO ID | GO:0000070 | UniProtAcc | Q9BVC3 |
Top |
Malignant transformation analysis |
| Identification of the aberrant gene expression in precancerous and cancerous lesions by comparing the gene expression of stem-like cells in diseased tissues with normal stem cells |
| Entrez ID | Symbol | Replicates | Species | Organ | Tissue | Adj P-value | Log2FC | Malignancy |
| 79075 | DSCC1 | LZE2T | Human | Esophagus | ESCC | 4.73e-03 | 2.96e-01 | 0.082 |
| 79075 | DSCC1 | P2T-E | Human | Esophagus | ESCC | 4.38e-08 | 1.96e-01 | 0.1177 |
| 79075 | DSCC1 | P4T-E | Human | Esophagus | ESCC | 6.14e-11 | 2.36e-01 | 0.1323 |
| 79075 | DSCC1 | P5T-E | Human | Esophagus | ESCC | 3.89e-12 | 2.52e-01 | 0.1327 |
| 79075 | DSCC1 | P9T-E | Human | Esophagus | ESCC | 8.38e-03 | 8.89e-02 | 0.1131 |
| 79075 | DSCC1 | P10T-E | Human | Esophagus | ESCC | 3.97e-04 | 1.22e-01 | 0.116 |
| 79075 | DSCC1 | P12T-E | Human | Esophagus | ESCC | 6.21e-03 | 1.18e-01 | 0.1122 |
| 79075 | DSCC1 | P15T-E | Human | Esophagus | ESCC | 8.45e-04 | 1.22e-01 | 0.1149 |
| 79075 | DSCC1 | P16T-E | Human | Esophagus | ESCC | 4.40e-09 | 2.35e-01 | 0.1153 |
| 79075 | DSCC1 | P17T-E | Human | Esophagus | ESCC | 8.50e-05 | 1.94e-01 | 0.1278 |
| 79075 | DSCC1 | P20T-E | Human | Esophagus | ESCC | 1.51e-02 | 8.27e-02 | 0.1124 |
| 79075 | DSCC1 | P21T-E | Human | Esophagus | ESCC | 4.44e-08 | 2.14e-01 | 0.1617 |
| 79075 | DSCC1 | P22T-E | Human | Esophagus | ESCC | 4.41e-07 | 2.17e-01 | 0.1236 |
| 79075 | DSCC1 | P23T-E | Human | Esophagus | ESCC | 1.14e-03 | 1.29e-01 | 0.108 |
| 79075 | DSCC1 | P24T-E | Human | Esophagus | ESCC | 4.41e-07 | 1.92e-01 | 0.1287 |
| 79075 | DSCC1 | P26T-E | Human | Esophagus | ESCC | 1.85e-05 | 2.02e-01 | 0.1276 |
| 79075 | DSCC1 | P27T-E | Human | Esophagus | ESCC | 4.65e-02 | 9.55e-02 | 0.1055 |
| 79075 | DSCC1 | P28T-E | Human | Esophagus | ESCC | 2.03e-09 | 2.11e-01 | 0.1149 |
| 79075 | DSCC1 | P31T-E | Human | Esophagus | ESCC | 7.39e-07 | 2.79e-01 | 0.1251 |
| 79075 | DSCC1 | P32T-E | Human | Esophagus | ESCC | 3.31e-09 | 1.99e-01 | 0.1666 |
| Page: 1 2 3 |
| Tissue | Expression Dynamics | Abbreviation |
| Esophagus |  | ESCC: Esophageal squamous cell carcinoma |
| HGIN: High-grade intraepithelial neoplasias | ||
| LGIN: Low-grade intraepithelial neoplasias | ||
| Liver | 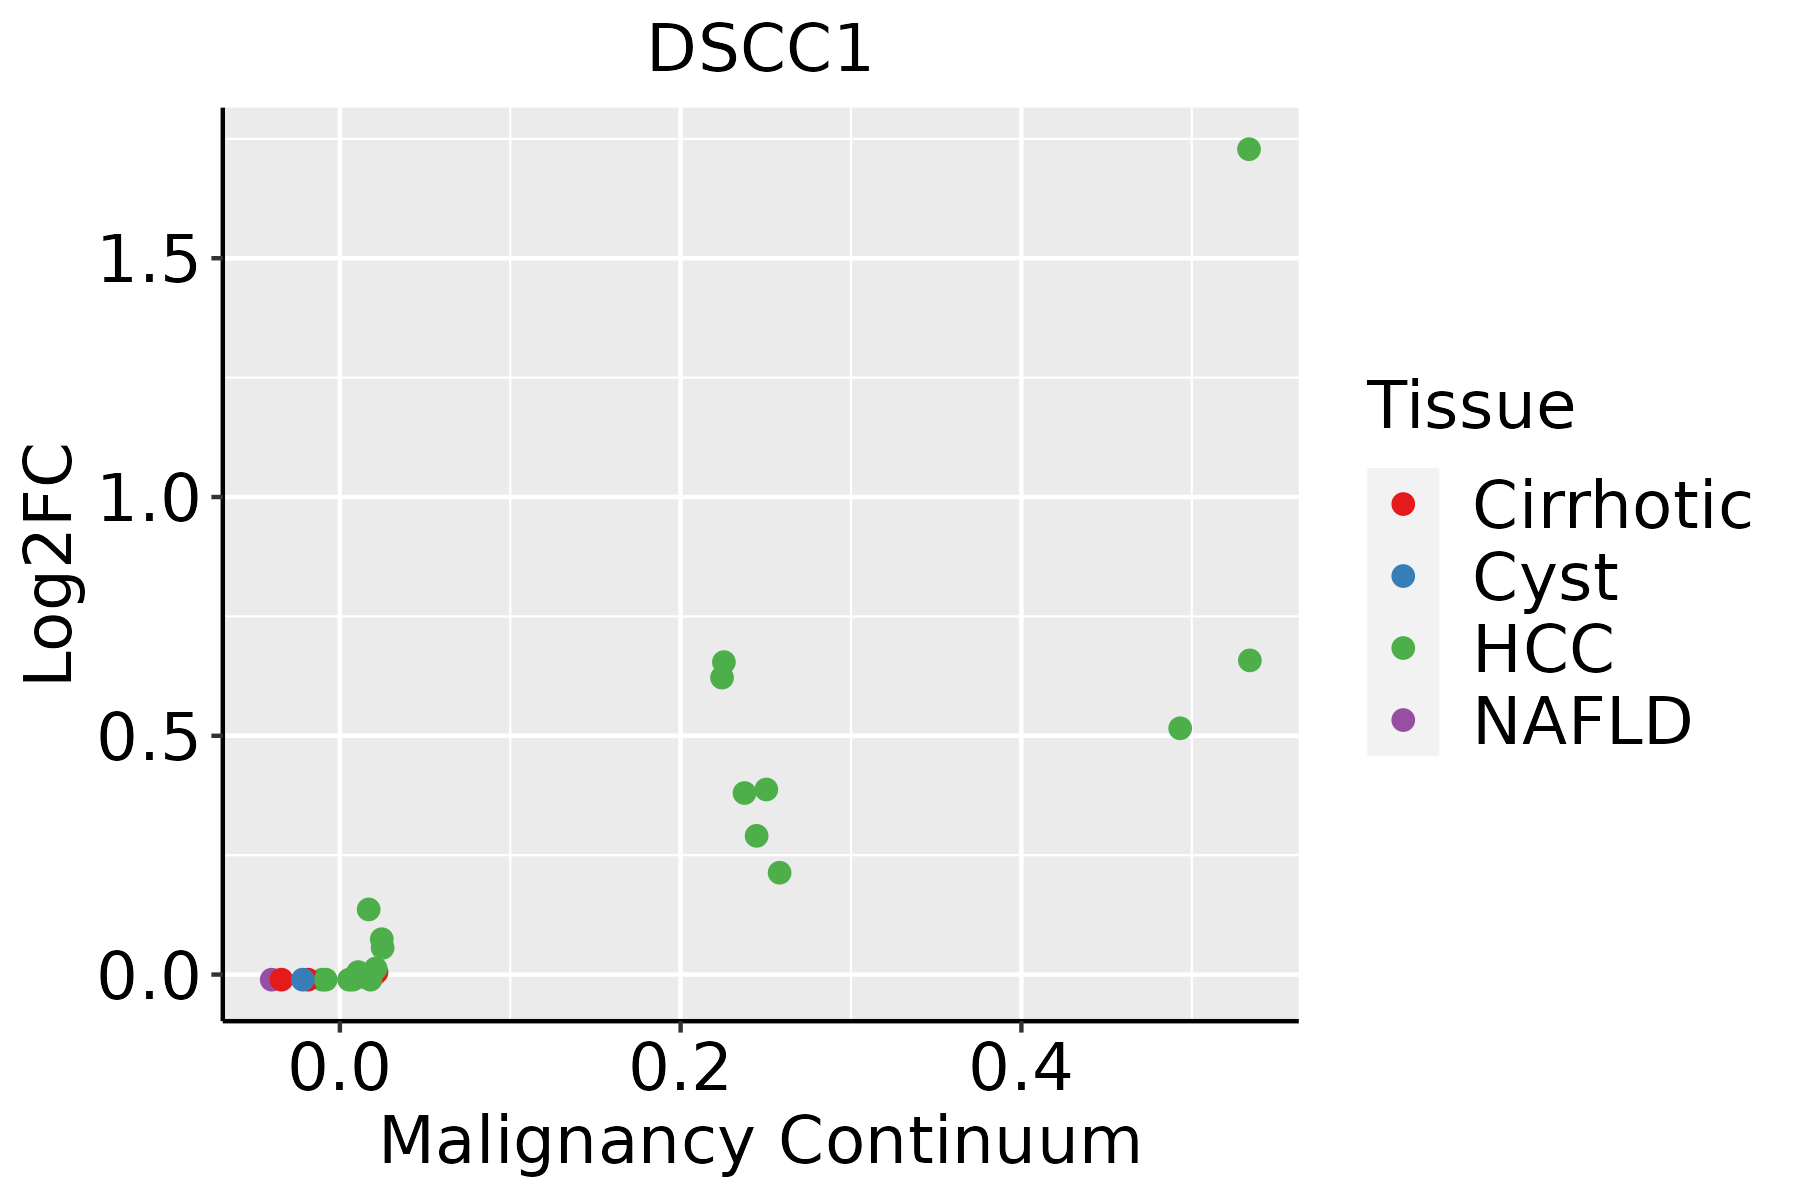 | HCC: Hepatocellular carcinoma |
| NAFLD: Non-alcoholic fatty liver disease | ||
| Oral Cavity | 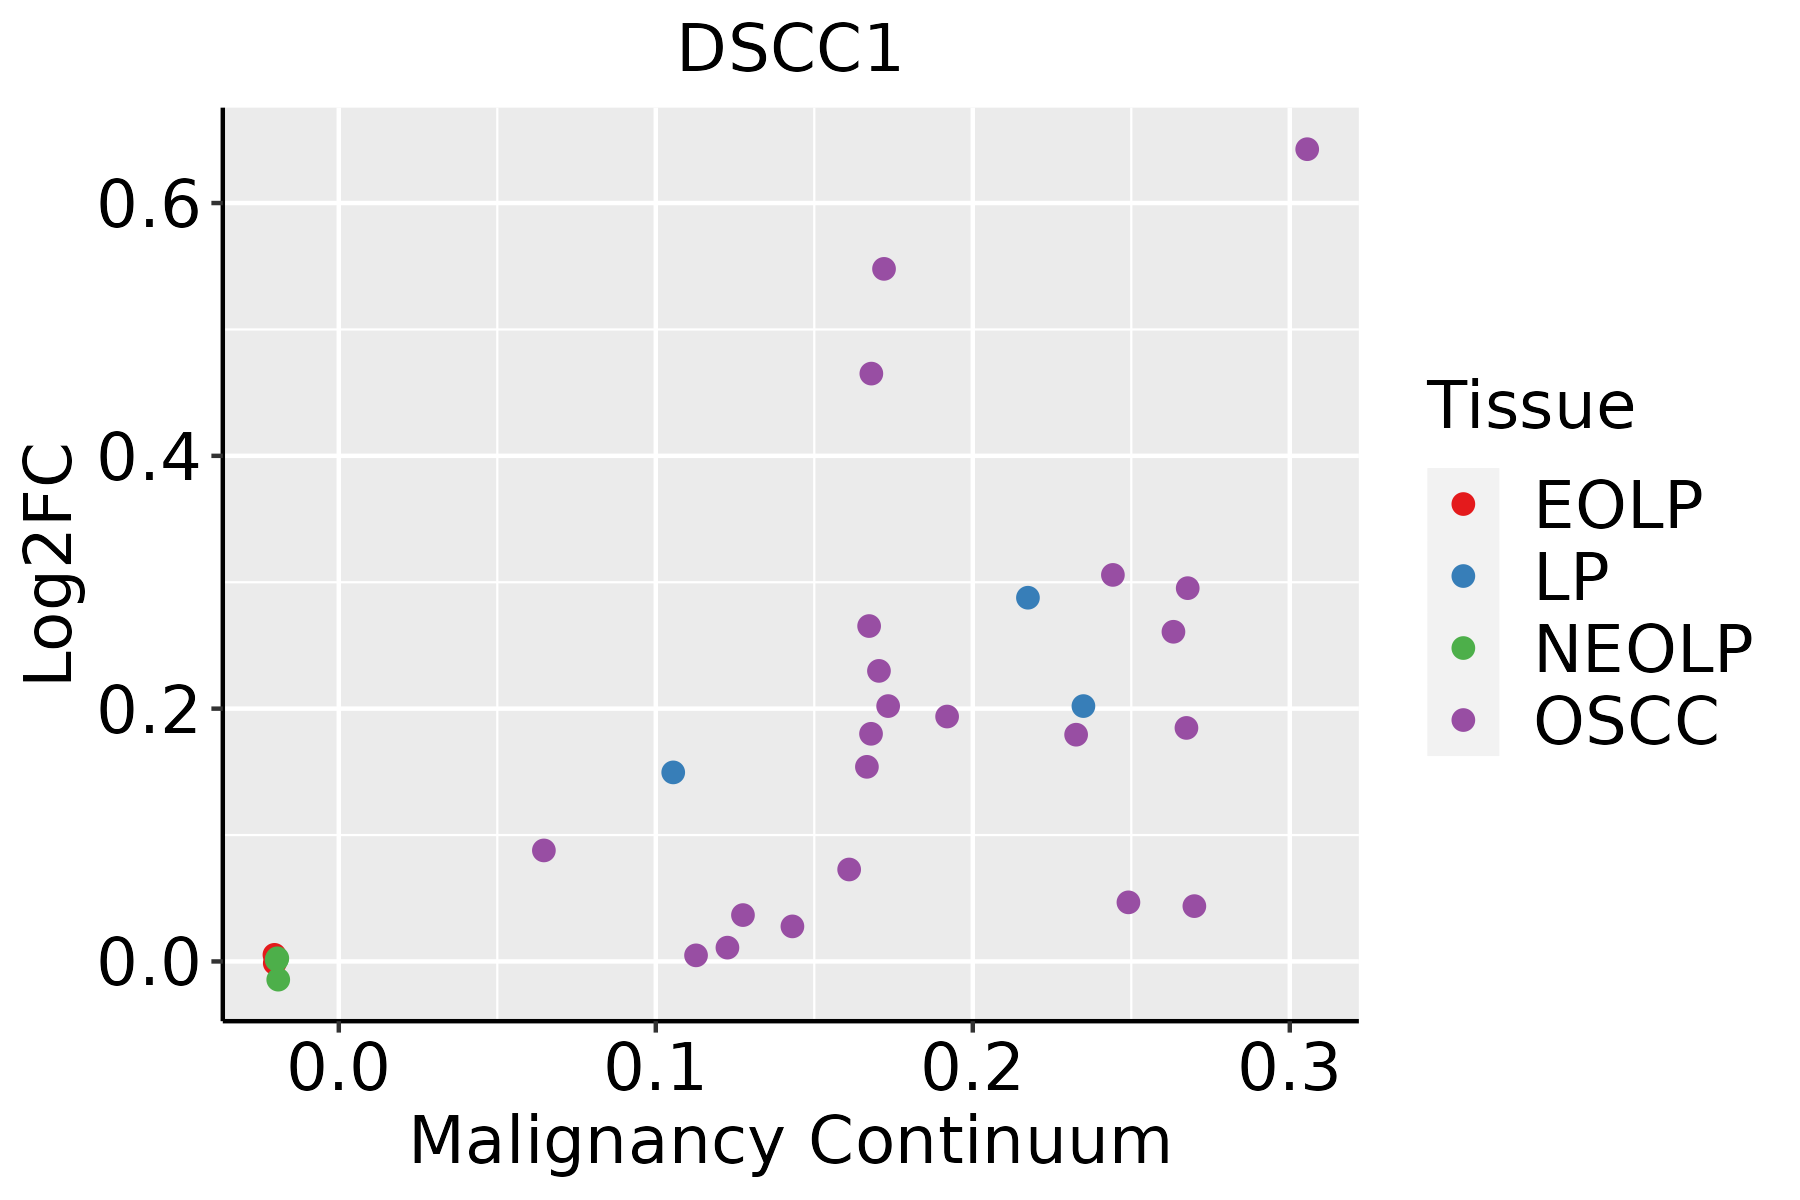 | EOLP: Erosive Oral lichen planus |
| LP: leukoplakia | ||
| NEOLP: Non-erosive oral lichen planus | ||
| OSCC: Oral squamous cell carcinoma |
| ∗log2FC in expression of this searched gene in stem-like cells from each diseased tissue sample relative to stem-like cells in normal samples in each tissue plotted against the malignancy continuum. Samples are colored based on if they are from different disease stage. |
Top |
Malignant transformation related pathway analysis |
| Find out the enriched GO biological processes and KEGG pathways involved in transition from healthy to precancer to cancer |
| Tissue | Disease Stage | Enriched GO biological Processes |
| Colorectum | AD |  |
| Colorectum | SER |  |
| Colorectum | MSS |  |
| Colorectum | MSI-H |  |
| Colorectum | FAP |  |
| ∗Top 15 enriched GO BP terms are showed in the bar plot of each disease state in each tissue. Each row represents a significant GO biological process which is colored according to the -log10(p.adjust). |
| Page: 1 2 3 4 5 6 7 8 9 |
| GO ID | Tissue | Disease Stage | Description | Gene Ratio | Bg Ratio | pvalue | p.adjust | Count |
| GO:014001414 | Esophagus | ESCC | mitotic nuclear division | 218/8552 | 287/18723 | 6.17e-26 | 1.78e-23 | 218 |
| GO:000007011 | Esophagus | ESCC | mitotic sister chromatid segregation | 138/8552 | 168/18723 | 1.37e-22 | 2.63e-20 | 138 |
| GO:00008194 | Esophagus | ESCC | sister chromatid segregation | 157/8552 | 202/18723 | 8.41e-21 | 1.33e-18 | 157 |
| GO:000705911 | Esophagus | ESCC | chromosome segregation | 238/8552 | 346/18723 | 1.72e-18 | 1.82e-16 | 238 |
| GO:00062604 | Esophagus | ESCC | DNA replication | 181/8552 | 260/18723 | 3.55e-15 | 2.05e-13 | 181 |
| GO:005105215 | Esophagus | ESCC | regulation of DNA metabolic process | 232/8552 | 359/18723 | 2.40e-13 | 1.13e-11 | 232 |
| GO:00482853 | Esophagus | ESCC | organelle fission | 301/8552 | 488/18723 | 4.64e-13 | 2.12e-11 | 301 |
| GO:00988133 | Esophagus | ESCC | nuclear chromosome segregation | 187/8552 | 281/18723 | 1.00e-12 | 4.36e-11 | 187 |
| GO:004354313 | Esophagus | ESCC | protein acylation | 165/8552 | 243/18723 | 1.69e-12 | 7.14e-11 | 165 |
| GO:000647313 | Esophagus | ESCC | protein acetylation | 140/8552 | 201/18723 | 4.37e-12 | 1.69e-10 | 140 |
| GO:007189716 | Esophagus | ESCC | DNA biosynthetic process | 127/8552 | 180/18723 | 1.04e-11 | 3.85e-10 | 127 |
| GO:00002802 | Esophagus | ESCC | nuclear division | 270/8552 | 439/18723 | 1.17e-11 | 4.24e-10 | 270 |
| GO:005105417 | Esophagus | ESCC | positive regulation of DNA metabolic process | 139/8552 | 201/18723 | 1.20e-11 | 4.33e-10 | 139 |
| GO:200057319 | Esophagus | ESCC | positive regulation of DNA biosynthetic process | 56/8552 | 66/18723 | 4.51e-11 | 1.45e-09 | 56 |
| GO:2000278110 | Esophagus | ESCC | regulation of DNA biosynthetic process | 81/8552 | 106/18723 | 9.81e-11 | 2.96e-09 | 81 |
| GO:00062612 | Esophagus | ESCC | DNA-dependent DNA replication | 100/8552 | 151/18723 | 2.61e-07 | 3.94e-06 | 100 |
| GO:00062754 | Esophagus | ESCC | regulation of DNA replication | 73/8552 | 107/18723 | 1.97e-06 | 2.28e-05 | 73 |
| GO:003239214 | Esophagus | ESCC | DNA geometric change | 62/8552 | 90/18723 | 7.02e-06 | 7.04e-05 | 62 |
| GO:003250813 | Esophagus | ESCC | DNA duplex unwinding | 58/8552 | 84/18723 | 1.23e-05 | 1.14e-04 | 58 |
| GO:00070648 | Esophagus | ESCC | mitotic sister chromatid cohesion | 23/8552 | 28/18723 | 8.23e-05 | 6.01e-04 | 23 |
| Page: 1 2 3 4 |
| Pathway ID | Tissue | Disease Stage | Description | Gene Ratio | Bg Ratio | pvalue | p.adjust | qvalue | Count |
| Page: 1 |
Top |
Cell-cell communication analysis |
| Identification of potential cell-cell interactions between two cell types and their ligand-receptor pairs for different disease states |
| Ligand | Receptor | LRpair | Pathway | Tissue | Disease Stage |
| Page: 1 |
Top |
Single-cell gene regulatory network inference analysis |
| Find out the significant the regulons (TFs) and the target genes of each regulon across cell types for different disease states |
| TF | Cell Type | Tissue | Disease Stage | Target Gene | RSS | Regulon Activity |
| ∗The dot plots of a searched regulon are shown for all cell subpopulations in each disease state of each tissue based on the regulon specific score inferred using pySCENIC and by calculating the average expression. |
| Page: 1 |
Top |
Somatic mutation of malignant transformation related genes |
| Annotation of somatic variants for genes involved in malignant transformation |
| Hugo Symbol | Variant Class | Variant Classification | dbSNP RS | HGVSc | HGVSp | HGVSp Short | SWISSPROT | BIOTYPE | SIFT | PolyPhen | Tumor Sample Barcode | Tissue | Histology | Sex | Age | Stage | Therapy Types | Drugs | Outcome |
| DSCC1 | SNV | Missense_Mutation | c.496G>C | p.Glu166Gln | p.E166Q | Q9BVC3 | protein_coding | tolerated(0.17) | benign(0.02) | TCGA-A2-A25A-01 | Breast | breast invasive carcinoma | Female | <65 | I/II | Unspecific | Cytoxan | SD | |
| DSCC1 | SNV | Missense_Mutation | c.784N>C | p.Glu262Gln | p.E262Q | Q9BVC3 | protein_coding | tolerated(0.38) | benign(0.021) | TCGA-AN-A0FV-01 | Breast | breast invasive carcinoma | Female | <65 | I/II | Unknown | Unknown | SD | |
| DSCC1 | SNV | Missense_Mutation | c.422N>G | p.Leu141Arg | p.L141R | Q9BVC3 | protein_coding | deleterious(0) | benign(0.179) | TCGA-AA-3663-01 | Colorectum | colon adenocarcinoma | Male | <65 | I/II | Unknown | Unknown | SD | |
| DSCC1 | SNV | Missense_Mutation | rs144655317 | c.772N>A | p.Glu258Lys | p.E258K | Q9BVC3 | protein_coding | tolerated(0.08) | benign(0.173) | TCGA-AZ-4315-01 | Colorectum | colon adenocarcinoma | Male | <65 | I/II | Unknown | Unknown | SD |
| DSCC1 | SNV | Missense_Mutation | novel | c.965N>C | p.Ile322Thr | p.I322T | Q9BVC3 | protein_coding | deleterious(0) | possibly_damaging(0.869) | TCGA-A5-A1OK-01 | Endometrium | uterine corpus endometrioid carcinoma | Female | <65 | III/IV | Chemotherapy | taxol | SD |
| DSCC1 | SNV | Missense_Mutation | novel | c.452N>G | p.Asp151Gly | p.D151G | Q9BVC3 | protein_coding | tolerated(0.06) | benign(0.193) | TCGA-AJ-A3BH-01 | Endometrium | uterine corpus endometrioid carcinoma | Female | Unknown | I/II | Unknown | Unknown | SD |
| DSCC1 | SNV | Missense_Mutation | novel | c.723G>T | p.Met241Ile | p.M241I | Q9BVC3 | protein_coding | tolerated(0.4) | benign(0) | TCGA-AJ-A5DW-01 | Endometrium | uterine corpus endometrioid carcinoma | Female | <65 | I/II | Unknown | Unknown | SD |
| DSCC1 | SNV | Missense_Mutation | c.996N>T | p.Glu332Asp | p.E332D | Q9BVC3 | protein_coding | tolerated(0.17) | possibly_damaging(0.615) | TCGA-AP-A059-01 | Endometrium | uterine corpus endometrioid carcinoma | Female | >=65 | I/II | Unknown | Unknown | SD | |
| DSCC1 | SNV | Missense_Mutation | rs367780001 | c.417N>T | p.Lys139Asn | p.K139N | Q9BVC3 | protein_coding | deleterious(0.02) | possibly_damaging(0.907) | TCGA-AP-A0LM-01 | Endometrium | uterine corpus endometrioid carcinoma | Female | <65 | III/IV | Chemotherapy | cisplatin | SD |
| DSCC1 | SNV | Missense_Mutation | novel | c.1169N>T | p.Arg390Ile | p.R390I | Q9BVC3 | protein_coding | deleterious(0) | probably_damaging(0.914) | TCGA-AX-A2HC-01 | Endometrium | uterine corpus endometrioid carcinoma | Female | <65 | III/IV | Chemotherapy | paclitaxel | PD |
| Page: 1 2 3 |
Top |
Related drugs of malignant transformation related genes |
| Identification of chemicals and drugs interact with genes involved in malignant transfromation |
| (DGIdb 4.0) |
| Entrez ID | Symbol | Category | Interaction Types | Drug Claim Name | Drug Name | PMIDs |
| Page: 1 |

Copyright 2023-Present -The University of Texas Health Science Center at Houston |