
|
|||||
|
 | |
| |
| |
| |
| |
| |
|
Gene: DSC3 |
Gene summary for DSC3 |
| Gene information | Species | Human | Gene symbol | DSC3 | Gene ID | 1825 |
| Gene name | desmocollin 3 | |
| Gene Alias | CDHF3 | |
| Cytomap | 18q12.1 | |
| Gene Type | protein-coding | GO ID | GO:0007155 | UniProtAcc | Q14574 |
Top |
Malignant transformation analysis |
| Identification of the aberrant gene expression in precancerous and cancerous lesions by comparing the gene expression of stem-like cells in diseased tissues with normal stem cells |
| Entrez ID | Symbol | Replicates | Species | Organ | Tissue | Adj P-value | Log2FC | Malignancy |
| 1825 | DSC3 | GSM4909281 | Human | Breast | IDC | 1.03e-24 | 5.18e-01 | 0.21 |
| 1825 | DSC3 | GSM4909282 | Human | Breast | IDC | 5.16e-20 | 4.62e-01 | -0.0288 |
| 1825 | DSC3 | GSM4909285 | Human | Breast | IDC | 3.80e-03 | 1.41e-01 | 0.21 |
| 1825 | DSC3 | GSM4909286 | Human | Breast | IDC | 9.09e-10 | 2.28e-01 | 0.1081 |
| 1825 | DSC3 | GSM4909287 | Human | Breast | IDC | 1.49e-07 | 1.53e-01 | 0.2057 |
| 1825 | DSC3 | GSM4909295 | Human | Breast | IDC | 4.94e-05 | 1.82e-01 | 0.0898 |
| 1825 | DSC3 | GSM4909299 | Human | Breast | IDC | 8.47e-03 | 1.42e-01 | 0.035 |
| 1825 | DSC3 | GSM4909300 | Human | Breast | IDC | 1.67e-02 | 1.37e-01 | 0.0334 |
| 1825 | DSC3 | GSM4909313 | Human | Breast | IDC | 3.20e-03 | 1.12e-01 | 0.0391 |
| 1825 | DSC3 | brca3 | Human | Breast | Precancer | 1.09e-02 | 1.26e-01 | -0.0263 |
| 1825 | DSC3 | DCIS2 | Human | Breast | DCIS | 5.06e-80 | 5.64e-01 | 0.0085 |
| 1825 | DSC3 | CA_HPV_1 | Human | Cervix | CC | 2.48e-12 | -3.97e-01 | 0.0264 |
| 1825 | DSC3 | CA_HPV_3 | Human | Cervix | CC | 3.97e-22 | 5.22e-01 | 0.0414 |
| 1825 | DSC3 | HSIL_HPV_1 | Human | Cervix | HSIL_HPV | 2.65e-05 | -3.41e-01 | 0.0116 |
| 1825 | DSC3 | HSIL_HPV_2 | Human | Cervix | HSIL_HPV | 2.52e-03 | -3.31e-01 | 0.0208 |
| 1825 | DSC3 | N_HPV_2 | Human | Cervix | N_HPV | 6.06e-03 | 2.38e-01 | -0.0131 |
| 1825 | DSC3 | CCI_1 | Human | Cervix | CC | 1.78e-05 | 1.04e+00 | 0.528 |
| 1825 | DSC3 | CCI_2 | Human | Cervix | CC | 2.36e-02 | 8.15e-01 | 0.5249 |
| 1825 | DSC3 | CCI_3 | Human | Cervix | CC | 5.35e-11 | 1.32e+00 | 0.516 |
| 1825 | DSC3 | Tumor | Human | Cervix | CC | 3.97e-54 | 1.00e+00 | 0.1241 |
| Page: 1 2 3 4 5 6 7 |
| Tissue | Expression Dynamics | Abbreviation |
| Breast | 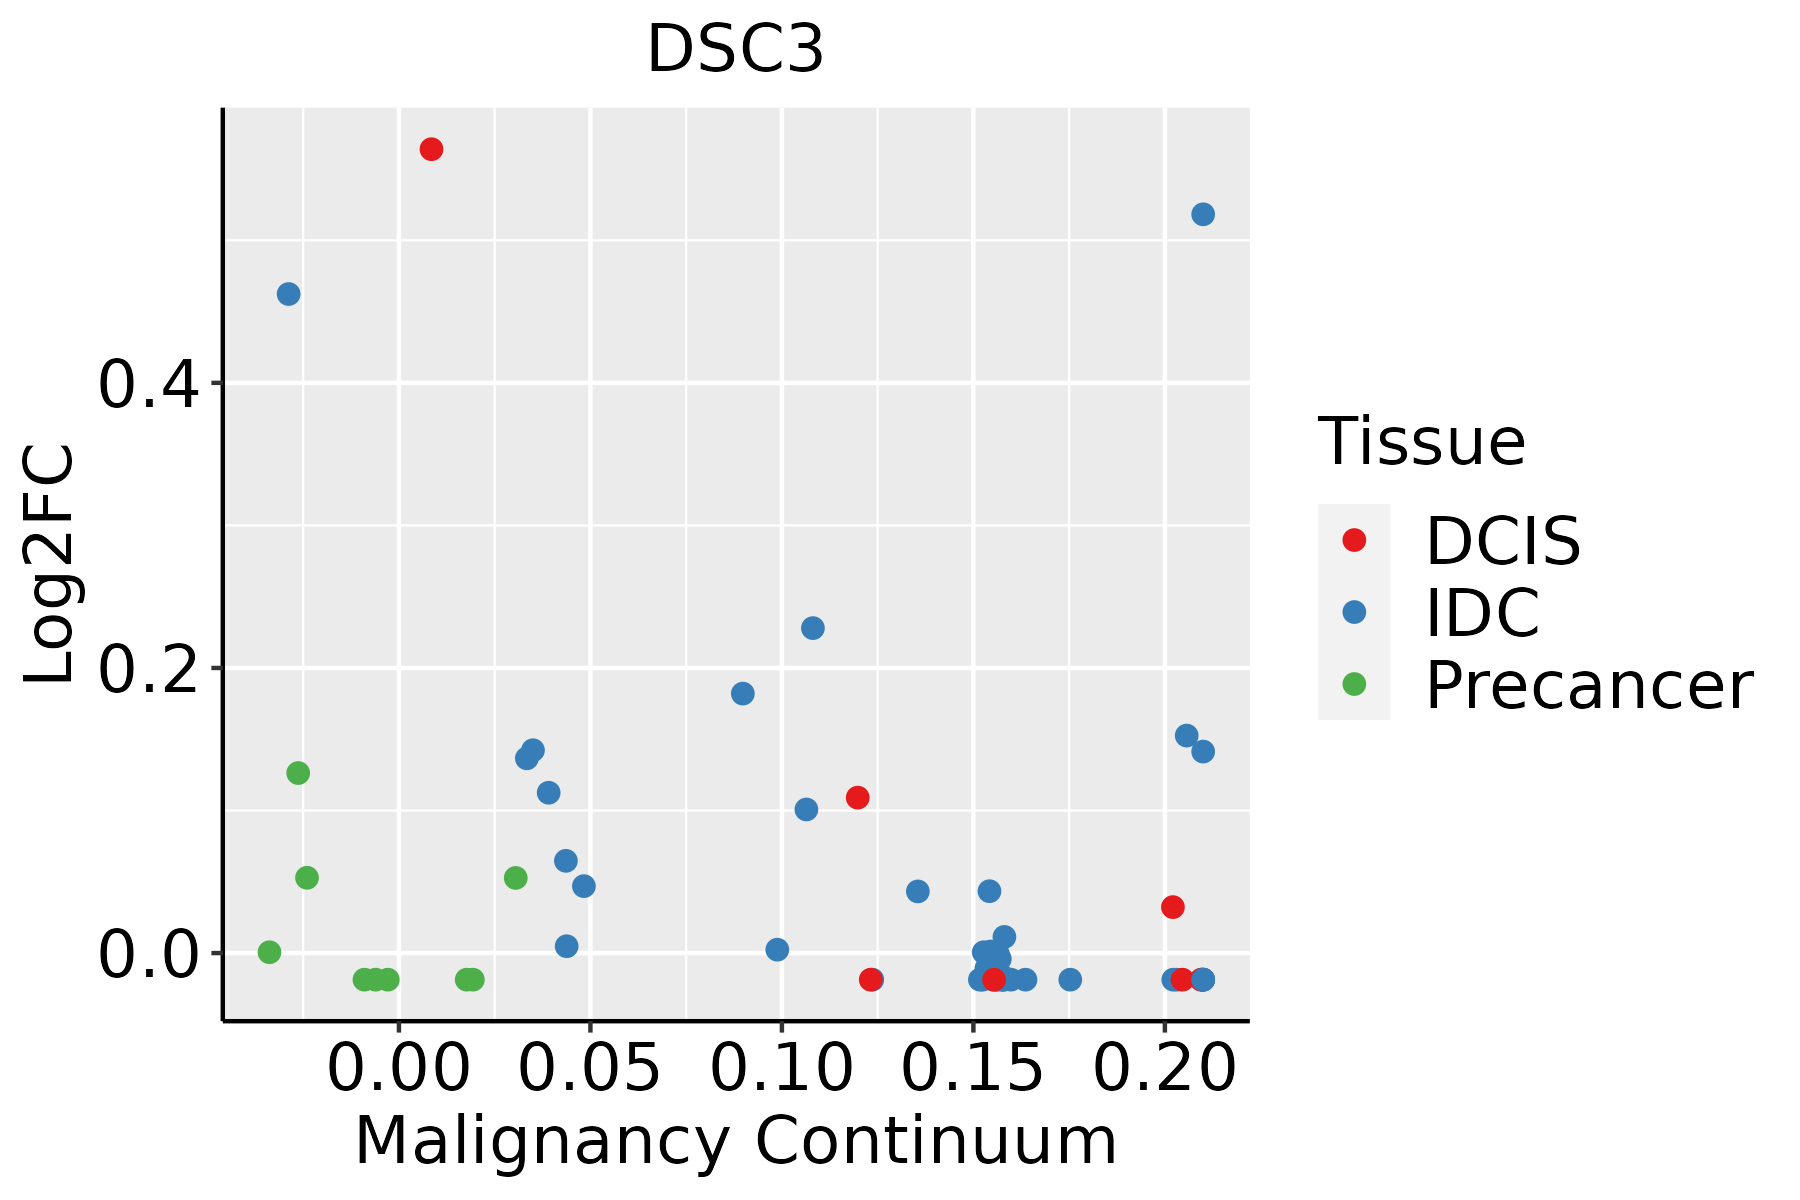 | IDC: Invasive ductal carcinoma |
| DCIS: Ductal carcinoma in situ | ||
| Precancer(BRCA1-mut): Precancerous lesion from BRCA1 mutation carriers | ||
| Cervix |  | CC: Cervix cancer |
| HSIL_HPV: HPV-infected high-grade squamous intraepithelial lesions | ||
| N_HPV: HPV-infected normal cervix | ||
| Esophagus | 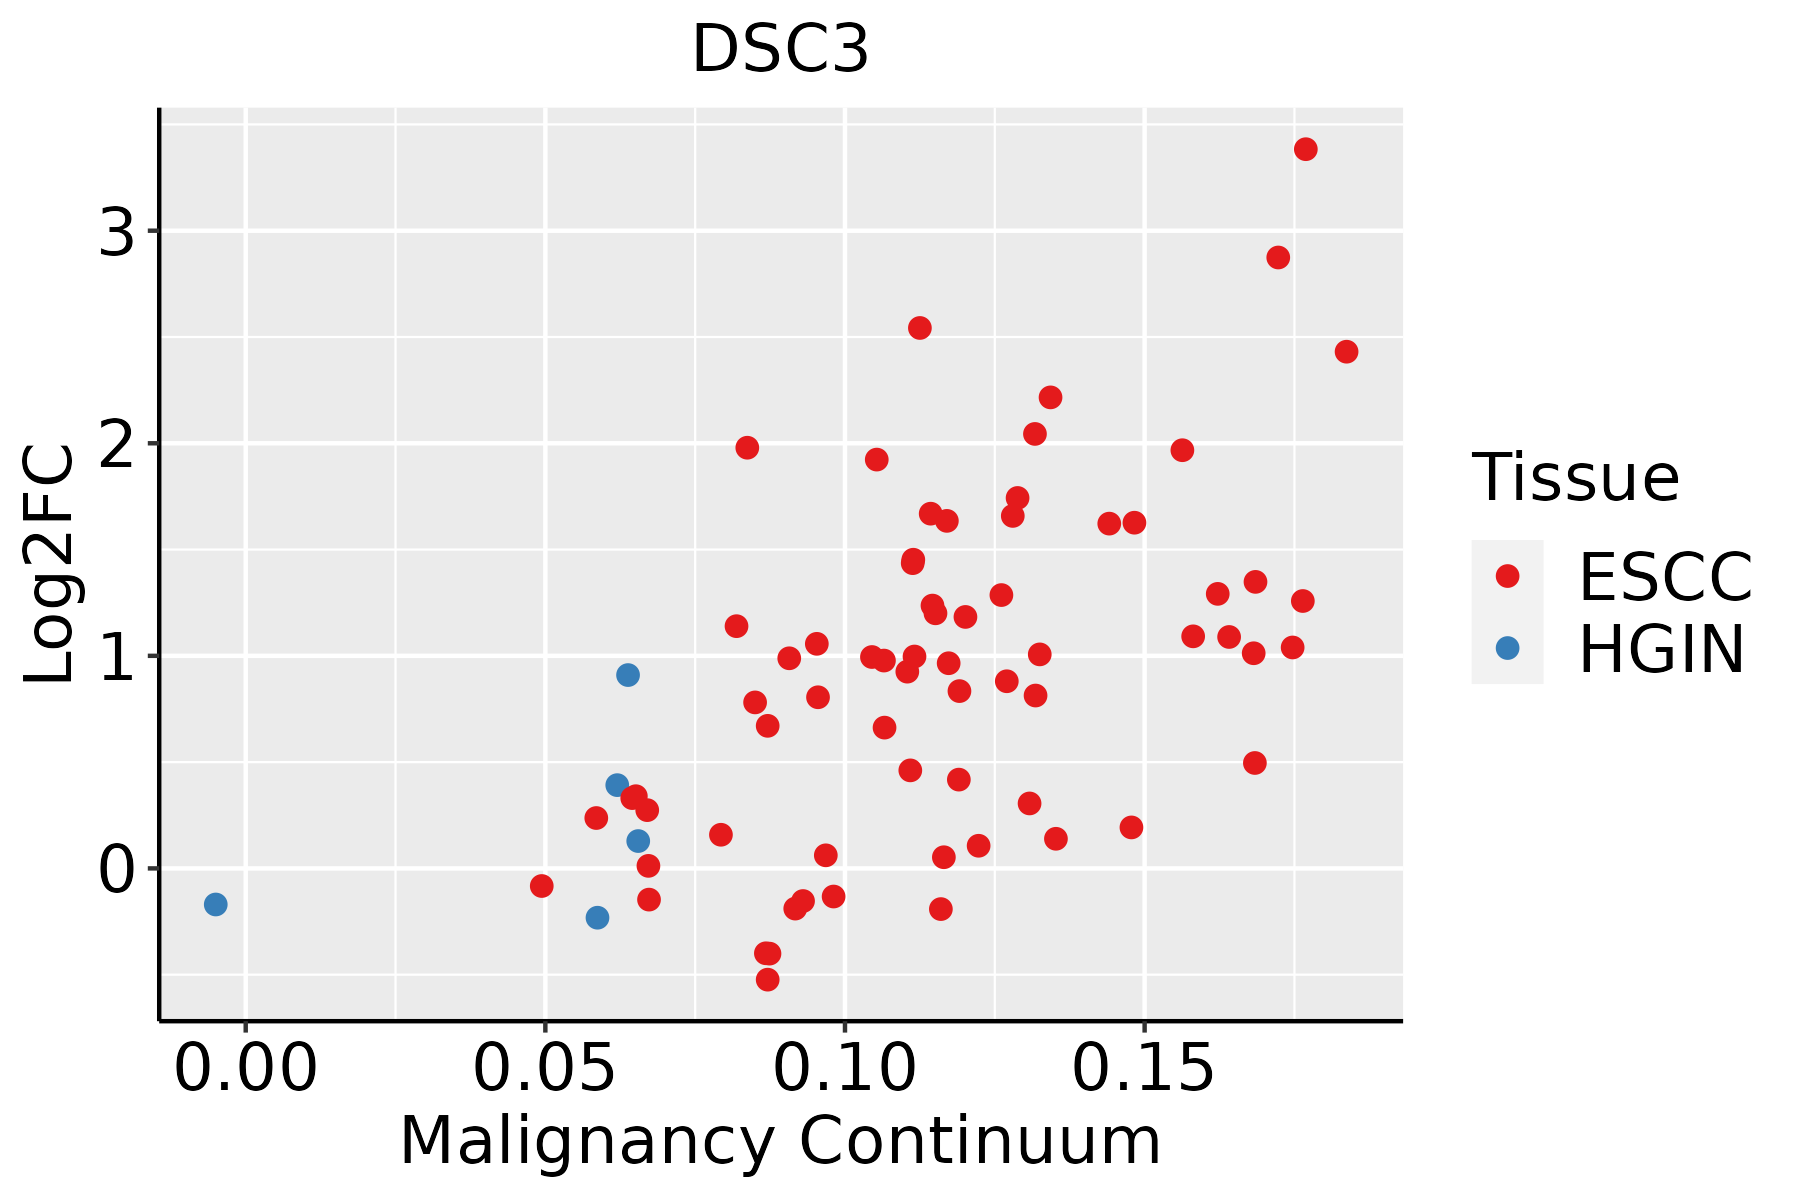 | ESCC: Esophageal squamous cell carcinoma |
| HGIN: High-grade intraepithelial neoplasias | ||
| LGIN: Low-grade intraepithelial neoplasias | ||
| Oral Cavity |  | EOLP: Erosive Oral lichen planus |
| LP: leukoplakia | ||
| NEOLP: Non-erosive oral lichen planus | ||
| OSCC: Oral squamous cell carcinoma | ||
| Prostate |  | BPH: Benign Prostatic Hyperplasia |
| Skin | 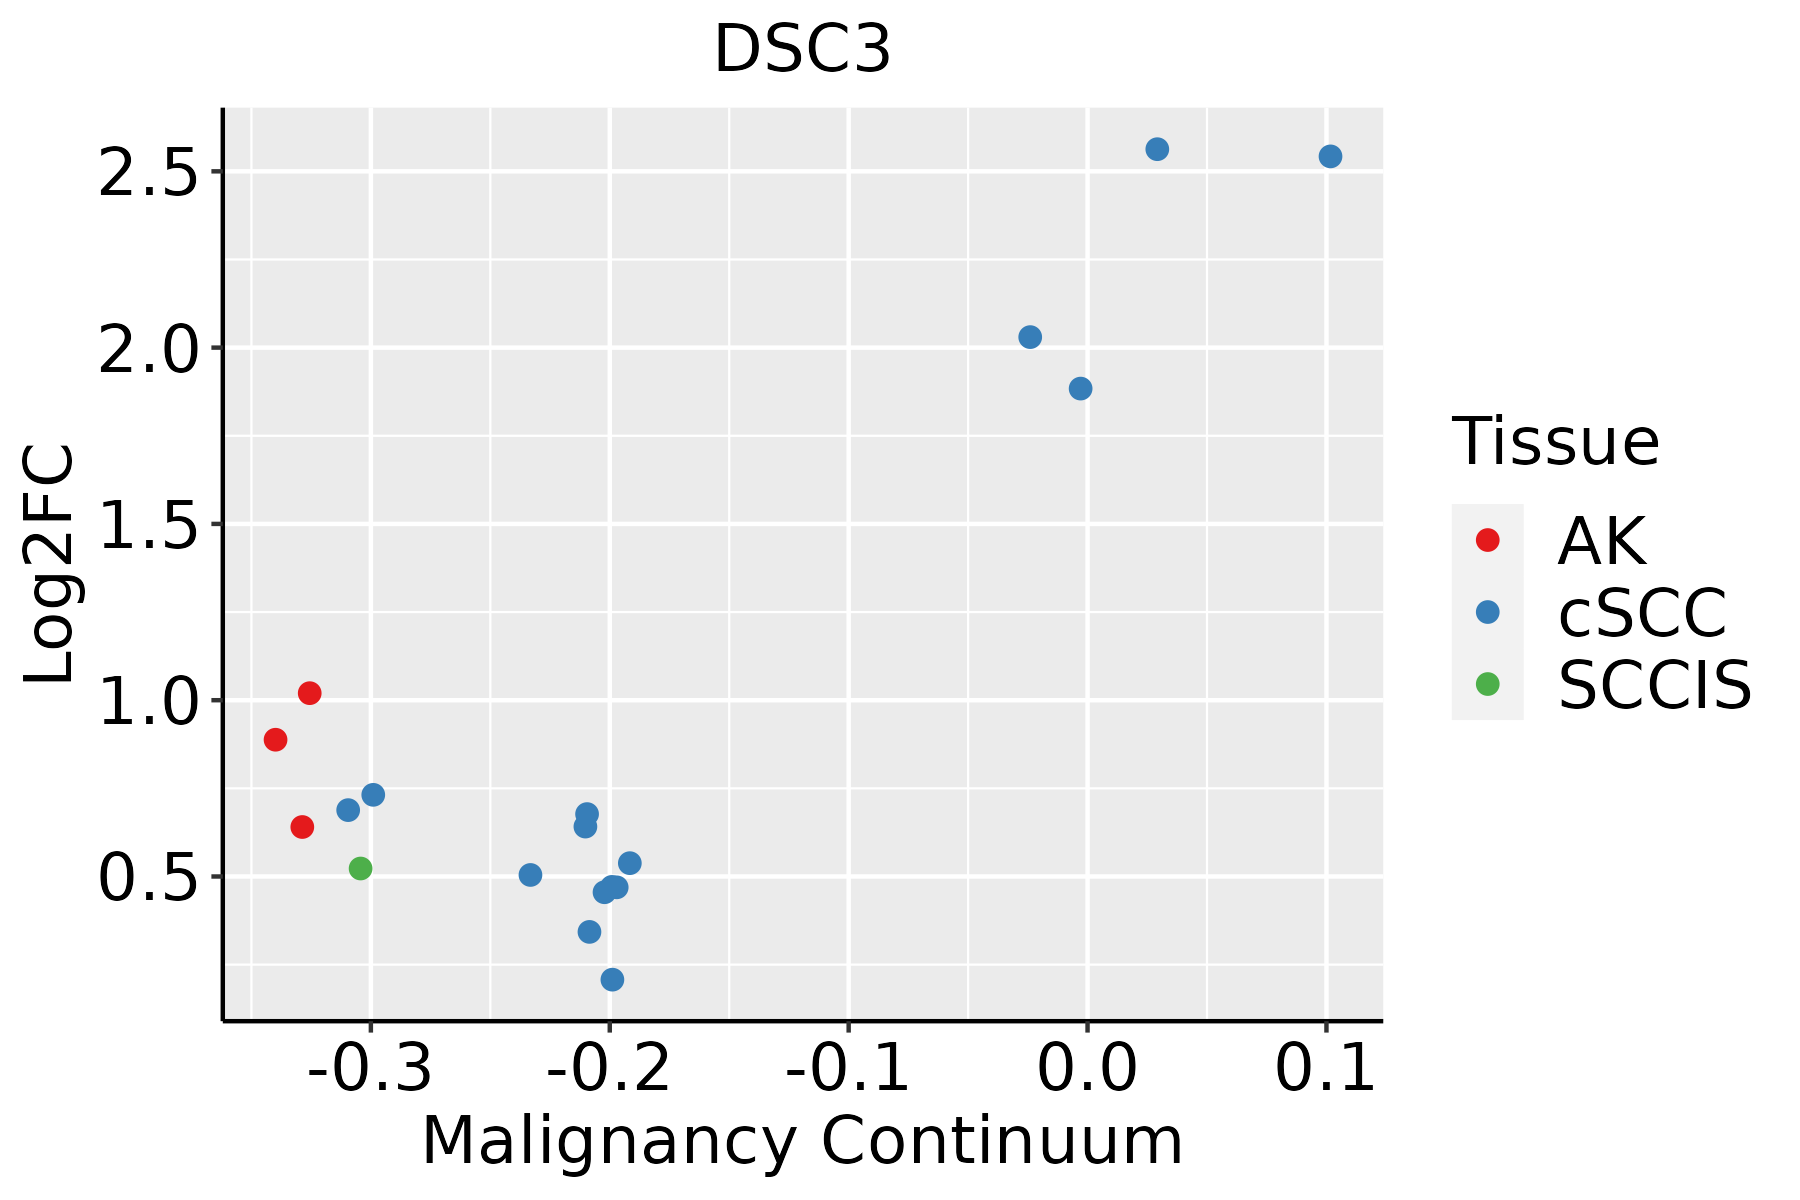 | AK: Actinic keratosis |
| cSCC: Cutaneous squamous cell carcinoma | ||
| SCCIS:squamous cell carcinoma in situ |
| ∗log2FC in expression of this searched gene in stem-like cells from each diseased tissue sample relative to stem-like cells in normal samples in each tissue plotted against the malignancy continuum. Samples are colored based on if they are from different disease stage. |
Top |
Malignant transformation related pathway analysis |
| Find out the enriched GO biological processes and KEGG pathways involved in transition from healthy to precancer to cancer |
| Tissue | Disease Stage | Enriched GO biological Processes |
| Colorectum | AD |  |
| Colorectum | SER |  |
| Colorectum | MSS |  |
| Colorectum | MSI-H |  |
| Colorectum | FAP |  |
| ∗Top 15 enriched GO BP terms are showed in the bar plot of each disease state in each tissue. Each row represents a significant GO biological process which is colored according to the -log10(p.adjust). |
| Page: 1 2 3 4 5 6 7 8 9 |
| GO ID | Tissue | Disease Stage | Description | Gene Ratio | Bg Ratio | pvalue | p.adjust | Count |
| GO:0098742 | Cervix | N_HPV | cell-cell adhesion via plasma-membrane adhesion molecules | 17/534 | 273/18723 | 2.26e-03 | 2.11e-02 | 17 |
| GO:00987421 | Skin | SCCIS | cell-cell adhesion via plasma-membrane adhesion molecules | 26/919 | 273/18723 | 9.83e-04 | 1.23e-02 | 26 |
| Page: 1 |
| Pathway ID | Tissue | Disease Stage | Description | Gene Ratio | Bg Ratio | pvalue | p.adjust | qvalue | Count |
| Page: 1 |
Top |
Cell-cell communication analysis |
| Identification of potential cell-cell interactions between two cell types and their ligand-receptor pairs for different disease states |
| Ligand | Receptor | LRpair | Pathway | Tissue | Disease Stage |
| DSG2 | DSC3 | DSG2_DSC3 | DESMOSOME | Breast | IDC |
| DSG2 | DSC3 | DSG2_DSC3 | DESMOSOME | Cervix | CC |
| DSG1 | DSC3 | DSG1_DSC3 | DESMOSOME | Cervix | Healthy |
| DSG2 | DSC3 | DSG2_DSC3 | DESMOSOME | Esophagus | ADJ |
| DSG2 | DSC3 | DSG2_DSC3 | DESMOSOME | Esophagus | ESCC |
| DSG1 | DSC3 | DSG1_DSC3 | DESMOSOME | HNSCC | OSCC |
| DSG2 | DSC3 | DSG2_DSC3 | DESMOSOME | HNSCC | OSCC |
| DSG1 | DSC3 | DSG1_DSC3 | DESMOSOME | HNSCC | Precancer |
| DSG2 | DSC3 | DSG2_DSC3 | DESMOSOME | HNSCC | Precancer |
| DSG2 | DSC3 | DSG2_DSC3 | DESMOSOME | Prostate | ADJ |
| DSG2 | DSC3 | DSG2_DSC3 | DESMOSOME | Prostate | BPH |
| DSG1 | DSC3 | DSG1_DSC3 | DESMOSOME | Skin | ADJ |
| DSG2 | DSC3 | DSG2_DSC3 | DESMOSOME | Skin | ADJ |
| DSG1 | DSC3 | DSG1_DSC3 | DESMOSOME | Skin | AK |
| DSG2 | DSC3 | DSG2_DSC3 | DESMOSOME | Skin | AK |
| DSG1 | DSC3 | DSG1_DSC3 | DESMOSOME | Skin | cSCC |
| DSG1 | DSC3 | DSG1_DSC3 | DESMOSOME | Skin | Healthy |
| DSG1 | DSC3 | DSG1_DSC3 | DESMOSOME | Skin | SCCIS |
| Page: 1 |
Top |
Single-cell gene regulatory network inference analysis |
| Find out the significant the regulons (TFs) and the target genes of each regulon across cell types for different disease states |
| TF | Cell Type | Tissue | Disease Stage | Target Gene | RSS | Regulon Activity |
| ∗The dot plots of a searched regulon are shown for all cell subpopulations in each disease state of each tissue based on the regulon specific score inferred using pySCENIC and by calculating the average expression. |
| Page: 1 |
Top |
Somatic mutation of malignant transformation related genes |
| Annotation of somatic variants for genes involved in malignant transformation |
| Hugo Symbol | Variant Class | Variant Classification | dbSNP RS | HGVSc | HGVSp | HGVSp Short | SWISSPROT | BIOTYPE | SIFT | PolyPhen | Tumor Sample Barcode | Tissue | Histology | Sex | Age | Stage | Therapy Types | Drugs | Outcome |
| DSC3 | SNV | Missense_Mutation | c.2219N>A | p.Pro740His | p.P740H | Q14574 | protein_coding | deleterious(0) | probably_damaging(0.999) | TCGA-A8-A09Z-01 | Breast | breast invasive carcinoma | Female | >=65 | I/II | Unknown | Unknown | SD | |
| DSC3 | SNV | Missense_Mutation | novel | c.1381N>A | p.His461Asn | p.H461N | Q14574 | protein_coding | tolerated(1) | benign(0.001) | TCGA-AN-A046-01 | Breast | breast invasive carcinoma | Female | >=65 | I/II | Unknown | Unknown | SD |
| DSC3 | SNV | Missense_Mutation | novel | c.1146N>A | p.Asp382Glu | p.D382E | Q14574 | protein_coding | deleterious(0) | probably_damaging(0.981) | TCGA-AN-A046-01 | Breast | breast invasive carcinoma | Female | >=65 | I/II | Unknown | Unknown | SD |
| DSC3 | SNV | Missense_Mutation | novel | c.1795C>T | p.Pro599Ser | p.P599S | Q14574 | protein_coding | tolerated(0.13) | benign(0.03) | TCGA-BH-A8FY-01 | Breast | breast invasive carcinoma | Female | >=65 | I/II | Unknown | Unknown | SD |
| DSC3 | SNV | Missense_Mutation | rs372346117 | c.2033G>A | p.Arg678His | p.R678H | Q14574 | protein_coding | tolerated(0.07) | benign(0.003) | TCGA-D8-A1JG-01 | Breast | breast invasive carcinoma | Female | <65 | I/II | Chemotherapy | doxorubicin | SD |
| DSC3 | SNV | Missense_Mutation | novel | c.1130N>A | p.Pro377His | p.P377H | Q14574 | protein_coding | deleterious(0.01) | benign(0.148) | TCGA-S3-AA17-01 | Breast | breast invasive carcinoma | Female | <65 | I/II | Hormone Therapy | anastrozole | SD |
| DSC3 | insertion | Nonsense_Mutation | novel | c.183_184insTTTAAAGTACATTAAATATTTTCAGTCATTTTTTTCATTAAAAT | p.Asp62PhefsTer5 | p.D62Ffs*5 | Q14574 | protein_coding | TCGA-A2-A0CP-01 | Breast | breast invasive carcinoma | Female | <65 | I/II | Chemotherapy | cytoxan | SD | ||
| DSC3 | insertion | Frame_Shift_Ins | rs752923110 | c.2383_2384insG | p.Ala795GlyfsTer37 | p.A795Gfs*37 | Q14574 | protein_coding | TCGA-AN-A0FK-01 | Breast | breast invasive carcinoma | Female | >=65 | III/IV | Unknown | Unknown | SD | ||
| DSC3 | SNV | Missense_Mutation | novel | c.2138N>A | p.Gly713Glu | p.G713E | Q14574 | protein_coding | tolerated(0.22) | possibly_damaging(0.598) | TCGA-2W-A8YY-01 | Cervix | cervical & endocervical cancer | Female | <65 | I/II | Chemotherapy | cisplatin | CR |
| DSC3 | SNV | Missense_Mutation | novel | c.523G>A | p.Gly175Arg | p.G175R | Q14574 | protein_coding | deleterious(0) | probably_damaging(1) | TCGA-4J-AA1J-01 | Cervix | cervical & endocervical cancer | Female | <65 | I/II | Unknown | Unknown | SD |
| Page: 1 2 3 4 5 6 7 8 9 10 11 12 |
Top |
Related drugs of malignant transformation related genes |
| Identification of chemicals and drugs interact with genes involved in malignant transfromation |
| (DGIdb 4.0) |
| Entrez ID | Symbol | Category | Interaction Types | Drug Claim Name | Drug Name | PMIDs |
| Page: 1 |

Copyright 2023-Present -The University of Texas Health Science Center at Houston |