
|
|||||
|
 | |
| |
| |
| |
| |
| |
|
Gene: DSC2 |
Gene summary for DSC2 |
| Gene information | Species | Human | Gene symbol | DSC2 | Gene ID | 1824 |
| Gene name | desmocollin 2 | |
| Gene Alias | ARVD11 | |
| Cytomap | 18q12.1 | |
| Gene Type | protein-coding | GO ID | GO:0001508 | UniProtAcc | Q02487 |
Top |
Malignant transformation analysis |
| Identification of the aberrant gene expression in precancerous and cancerous lesions by comparing the gene expression of stem-like cells in diseased tissues with normal stem cells |
| Entrez ID | Symbol | Replicates | Species | Organ | Tissue | Adj P-value | Log2FC | Malignancy |
| 1824 | DSC2 | GSM4909281 | Human | Breast | IDC | 3.95e-37 | 8.18e-01 | 0.21 |
| 1824 | DSC2 | GSM4909285 | Human | Breast | IDC | 6.08e-04 | 3.41e-01 | 0.21 |
| 1824 | DSC2 | GSM4909291 | Human | Breast | IDC | 1.99e-05 | -3.10e-01 | 0.1753 |
| 1824 | DSC2 | GSM4909294 | Human | Breast | IDC | 8.07e-06 | -2.67e-01 | 0.2022 |
| 1824 | DSC2 | GSM4909296 | Human | Breast | IDC | 4.89e-12 | -2.58e-01 | 0.1524 |
| 1824 | DSC2 | GSM4909297 | Human | Breast | IDC | 4.08e-13 | -2.99e-01 | 0.1517 |
| 1824 | DSC2 | GSM4909298 | Human | Breast | IDC | 8.64e-03 | -2.11e-01 | 0.1551 |
| 1824 | DSC2 | GSM4909301 | Human | Breast | IDC | 7.82e-12 | -2.88e-01 | 0.1577 |
| 1824 | DSC2 | GSM4909302 | Human | Breast | IDC | 7.77e-15 | -3.42e-01 | 0.1545 |
| 1824 | DSC2 | GSM4909304 | Human | Breast | IDC | 1.06e-23 | -3.75e-01 | 0.1636 |
| 1824 | DSC2 | GSM4909306 | Human | Breast | IDC | 7.19e-04 | -2.14e-01 | 0.1564 |
| 1824 | DSC2 | GSM4909307 | Human | Breast | IDC | 2.30e-04 | -1.94e-01 | 0.1569 |
| 1824 | DSC2 | GSM4909308 | Human | Breast | IDC | 3.87e-15 | -3.65e-01 | 0.158 |
| 1824 | DSC2 | GSM4909311 | Human | Breast | IDC | 2.31e-21 | -3.58e-01 | 0.1534 |
| 1824 | DSC2 | GSM4909312 | Human | Breast | IDC | 7.47e-22 | -3.74e-01 | 0.1552 |
| 1824 | DSC2 | GSM4909315 | Human | Breast | IDC | 4.65e-05 | -2.57e-01 | 0.21 |
| 1824 | DSC2 | GSM4909319 | Human | Breast | IDC | 5.96e-23 | -3.76e-01 | 0.1563 |
| 1824 | DSC2 | GSM4909320 | Human | Breast | IDC | 1.70e-07 | -3.79e-01 | 0.1575 |
| 1824 | DSC2 | GSM4909321 | Human | Breast | IDC | 1.65e-18 | -3.31e-01 | 0.1559 |
| 1824 | DSC2 | M1 | Human | Breast | IDC | 1.91e-04 | -3.09e-01 | 0.1577 |
| Page: 1 2 3 4 5 6 7 8 9 10 |
| Tissue | Expression Dynamics | Abbreviation |
| Breast |  | IDC: Invasive ductal carcinoma |
| DCIS: Ductal carcinoma in situ | ||
| Precancer(BRCA1-mut): Precancerous lesion from BRCA1 mutation carriers | ||
| Cervix | 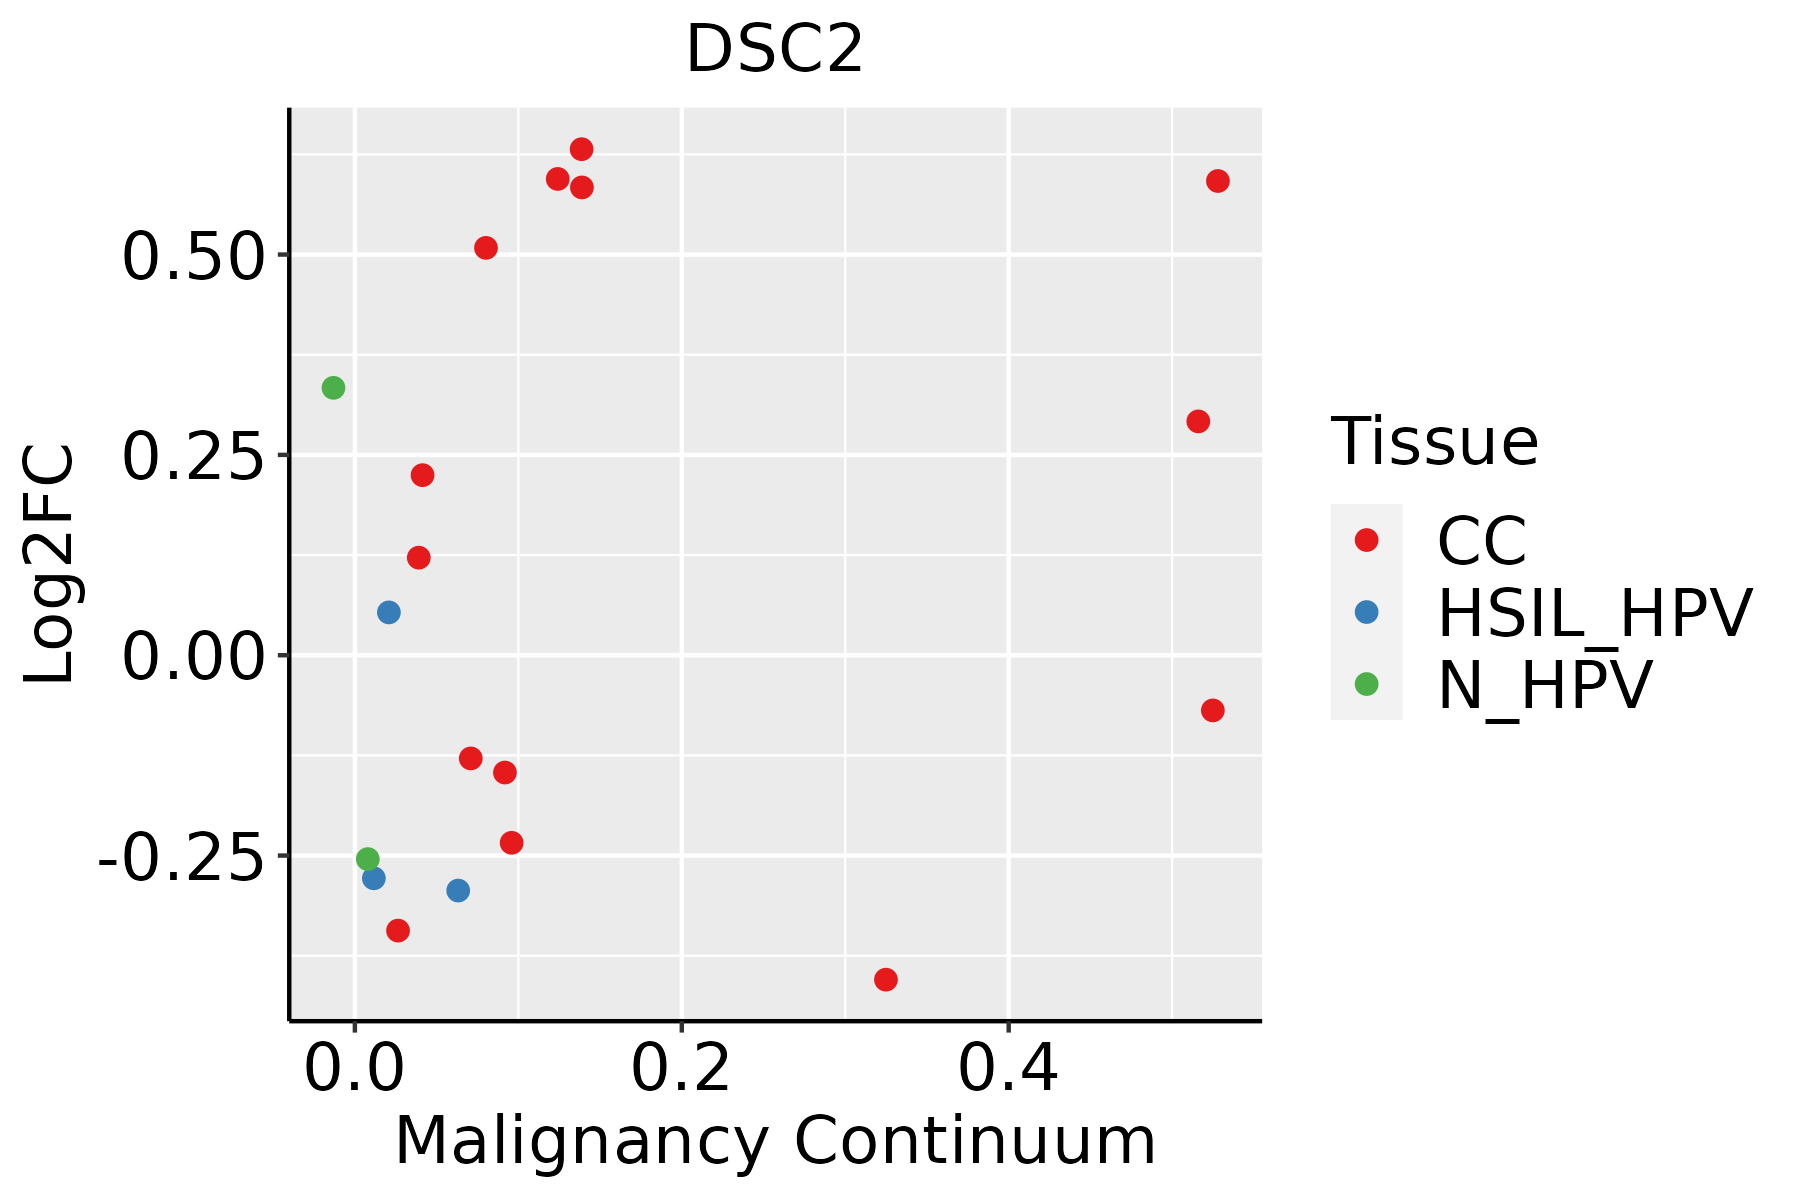 | CC: Cervix cancer |
| HSIL_HPV: HPV-infected high-grade squamous intraepithelial lesions | ||
| N_HPV: HPV-infected normal cervix | ||
| Colorectum (GSE201348) |  | FAP: Familial adenomatous polyposis |
| CRC: Colorectal cancer | ||
| Colorectum (HTA11) | 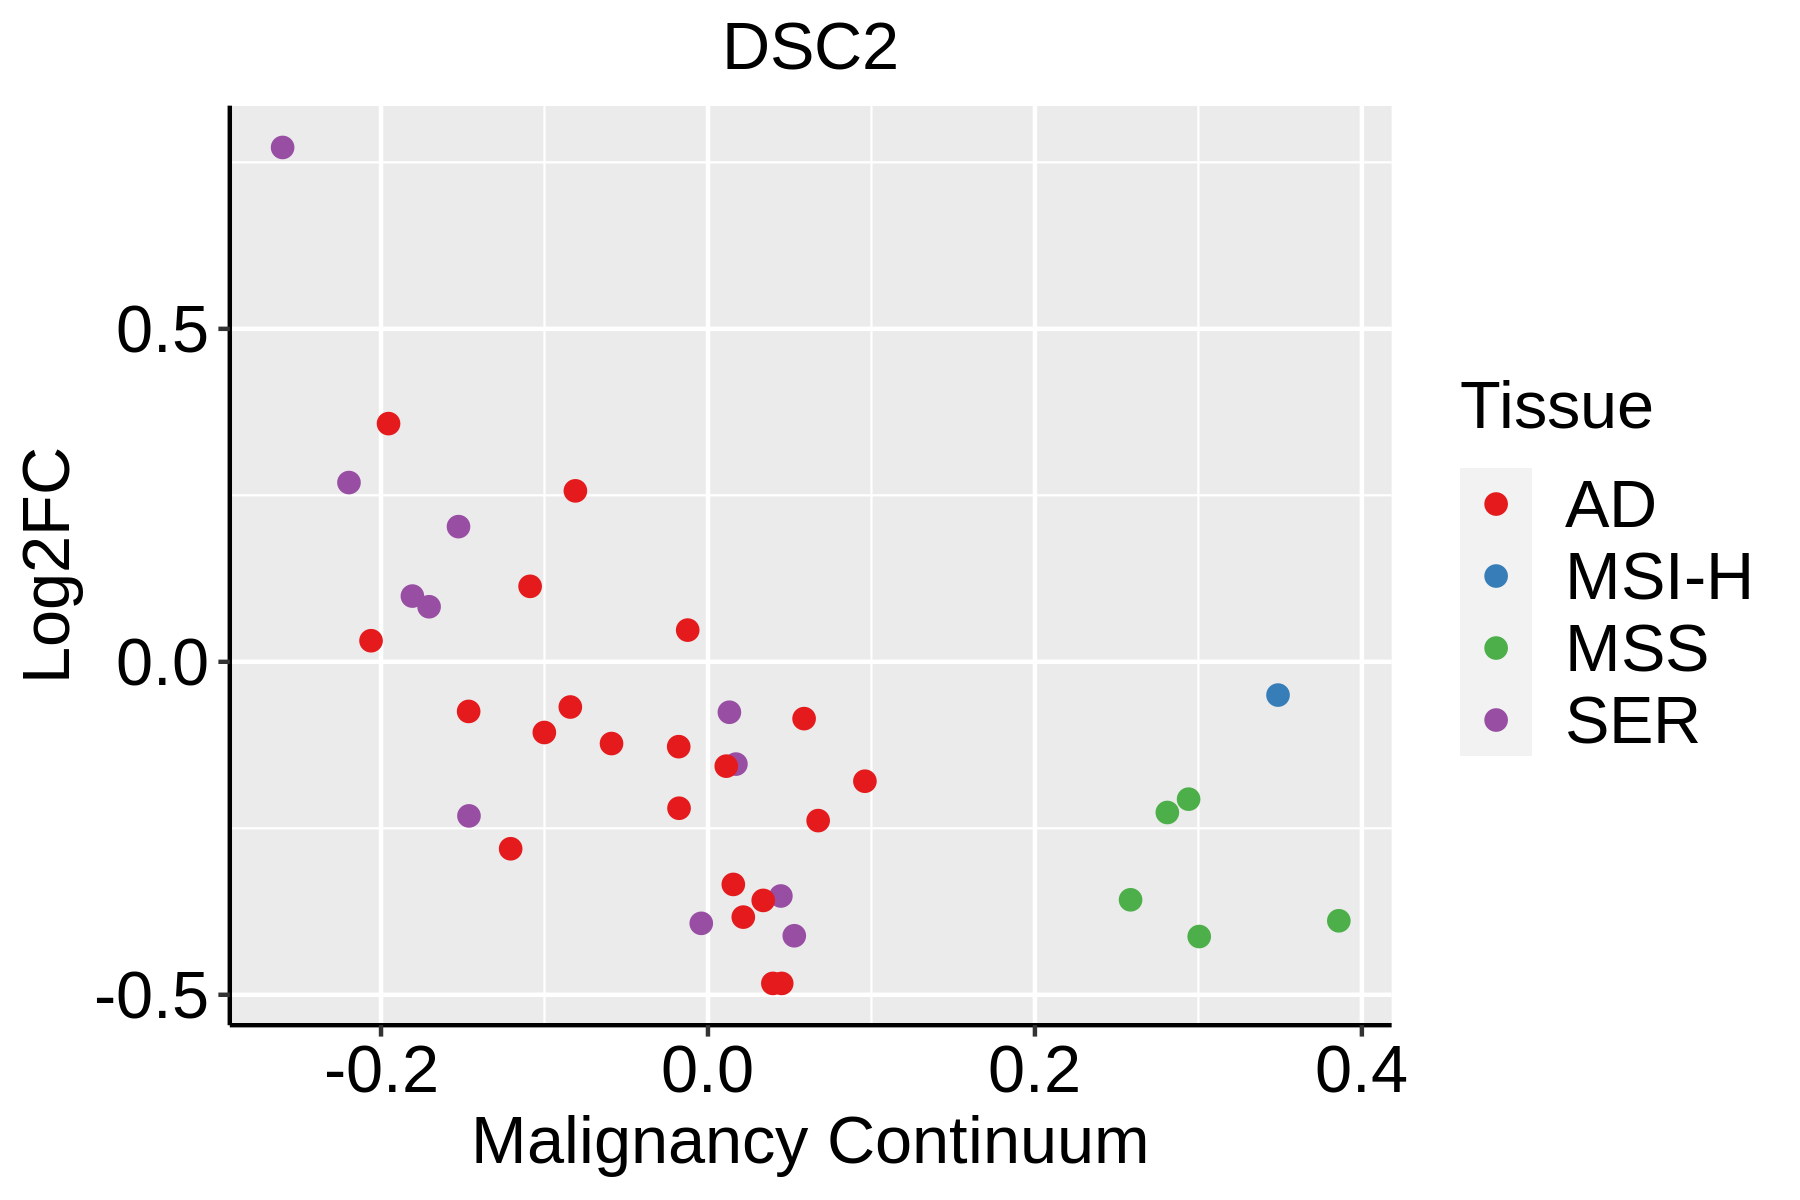 | AD: Adenomas |
| SER: Sessile serrated lesions | ||
| MSI-H: Microsatellite-high colorectal cancer | ||
| MSS: Microsatellite stable colorectal cancer | ||
| Esophagus |  | ESCC: Esophageal squamous cell carcinoma |
| HGIN: High-grade intraepithelial neoplasias | ||
| LGIN: Low-grade intraepithelial neoplasias | ||
| GC |  | CAG: Chronic atrophic gastritis |
| CAG with IM: Chronic atrophic gastritis with intestinal metaplasia | ||
| CSG: Chronic superficial gastritis | ||
| GC: Gastric cancer | ||
| SIM: Severe intestinal metaplasia | ||
| WIM: Wild intestinal metaplasia | ||
| Liver |  | HCC: Hepatocellular carcinoma |
| NAFLD: Non-alcoholic fatty liver disease | ||
| Oral Cavity |  | EOLP: Erosive Oral lichen planus |
| LP: leukoplakia | ||
| NEOLP: Non-erosive oral lichen planus | ||
| OSCC: Oral squamous cell carcinoma | ||
| Prostate | 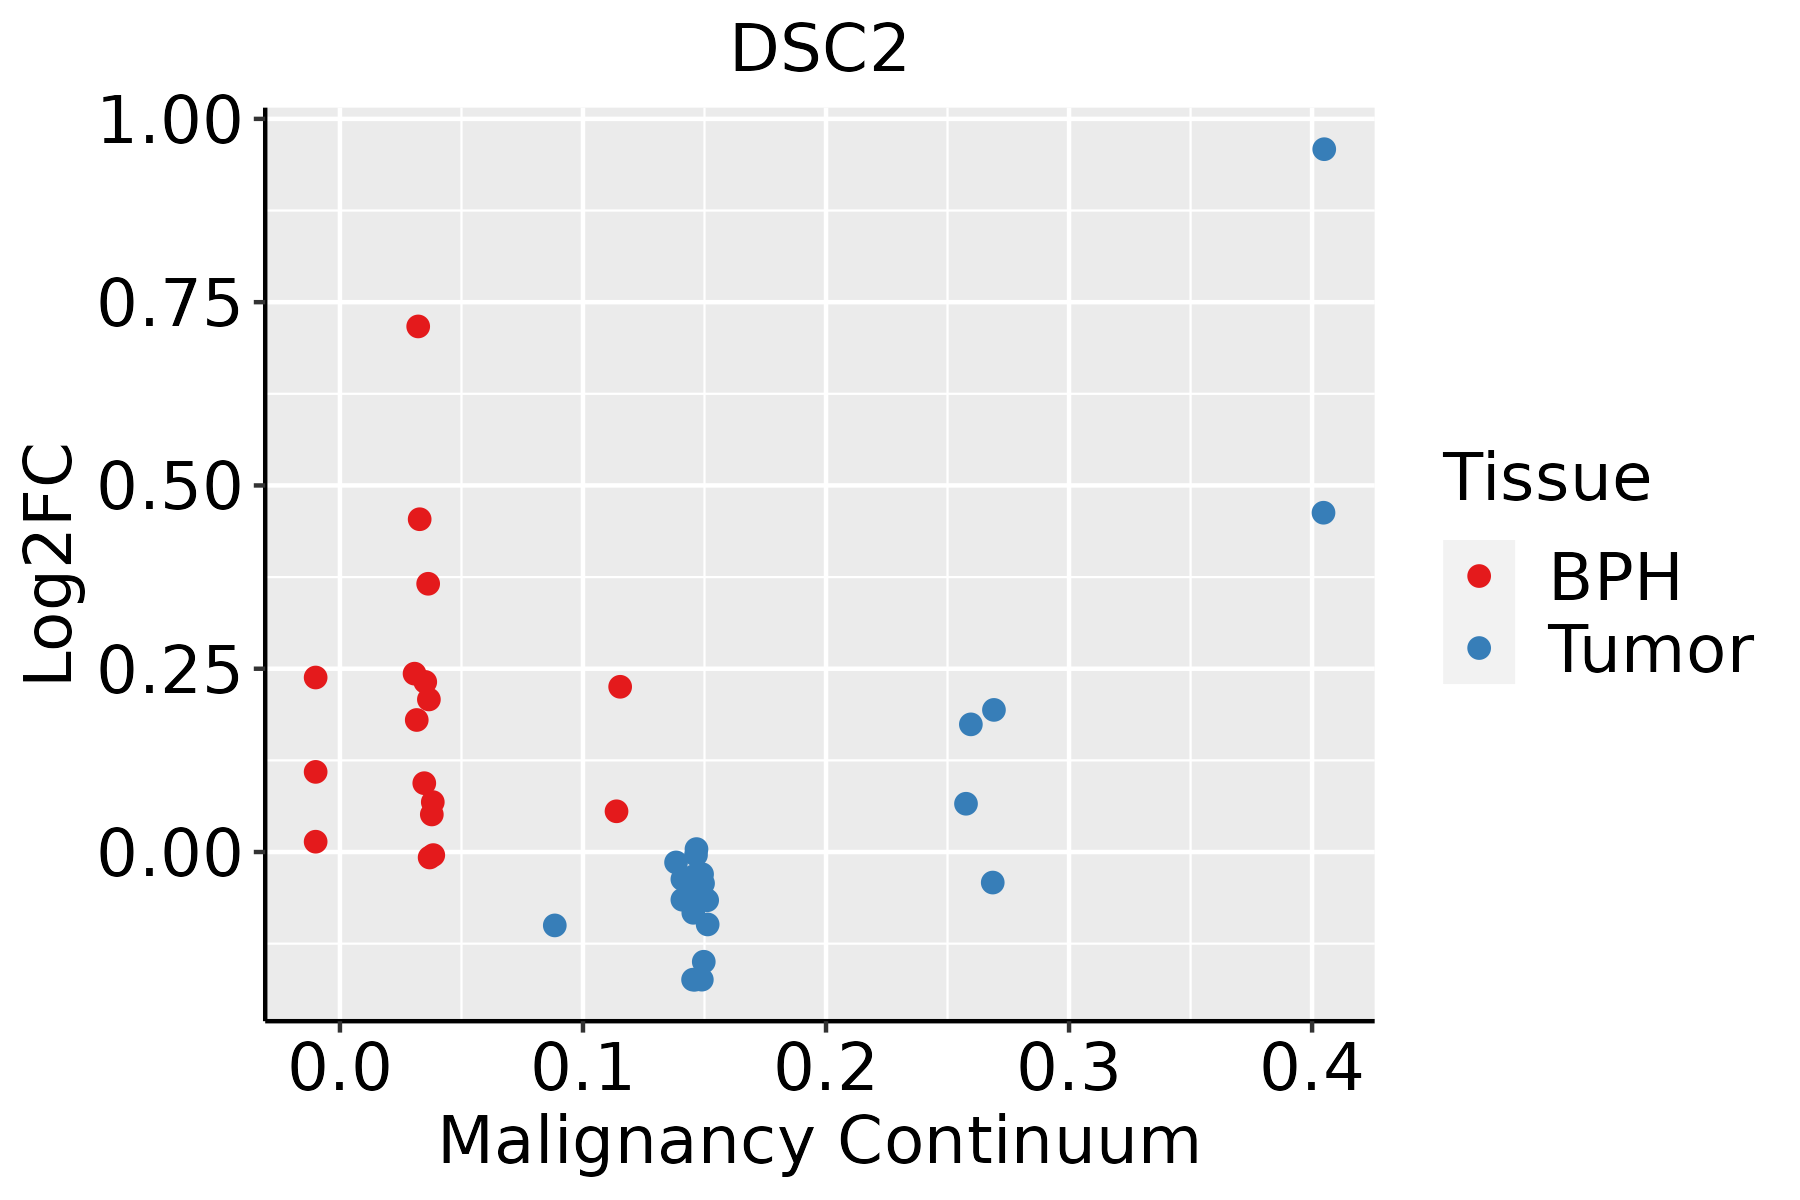 | BPH: Benign Prostatic Hyperplasia |
| Skin | 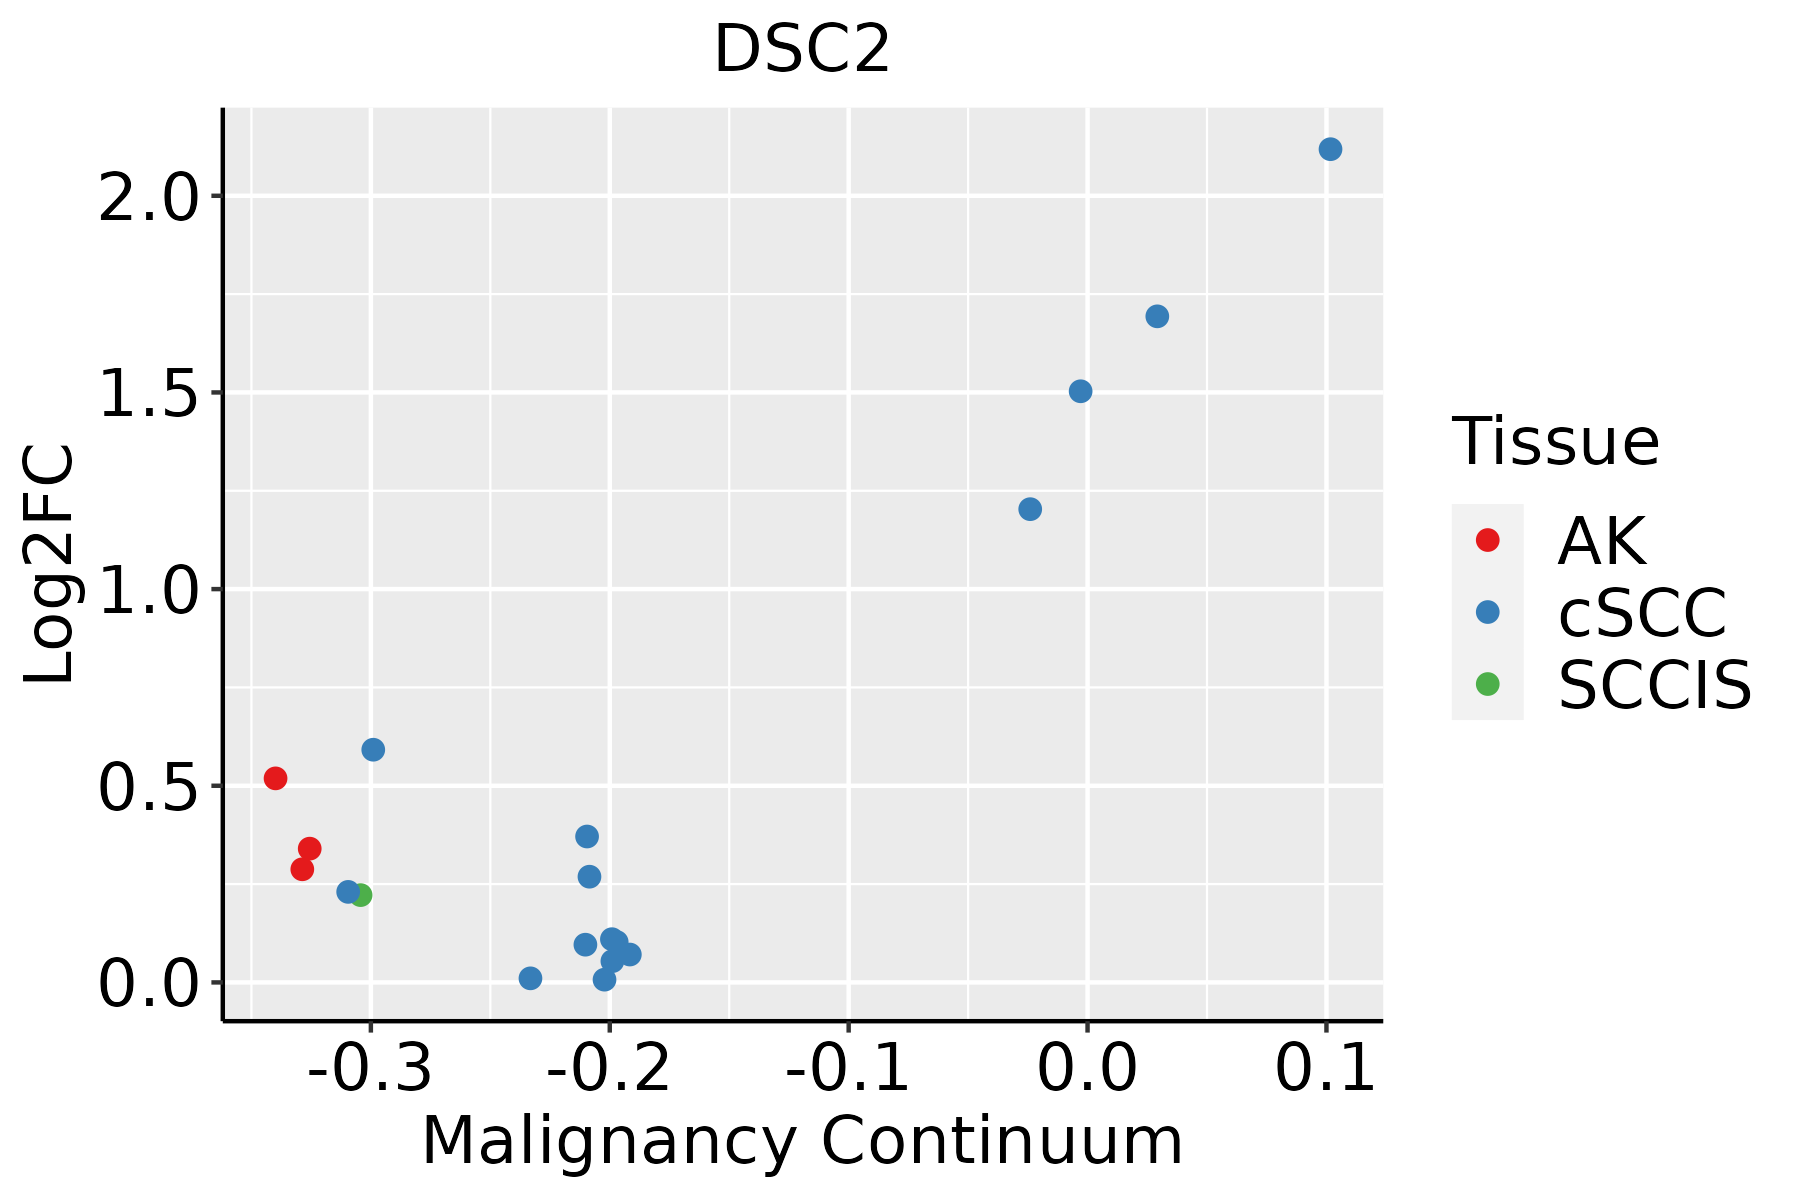 | AK: Actinic keratosis |
| cSCC: Cutaneous squamous cell carcinoma | ||
| SCCIS:squamous cell carcinoma in situ | ||
| Thyroid | 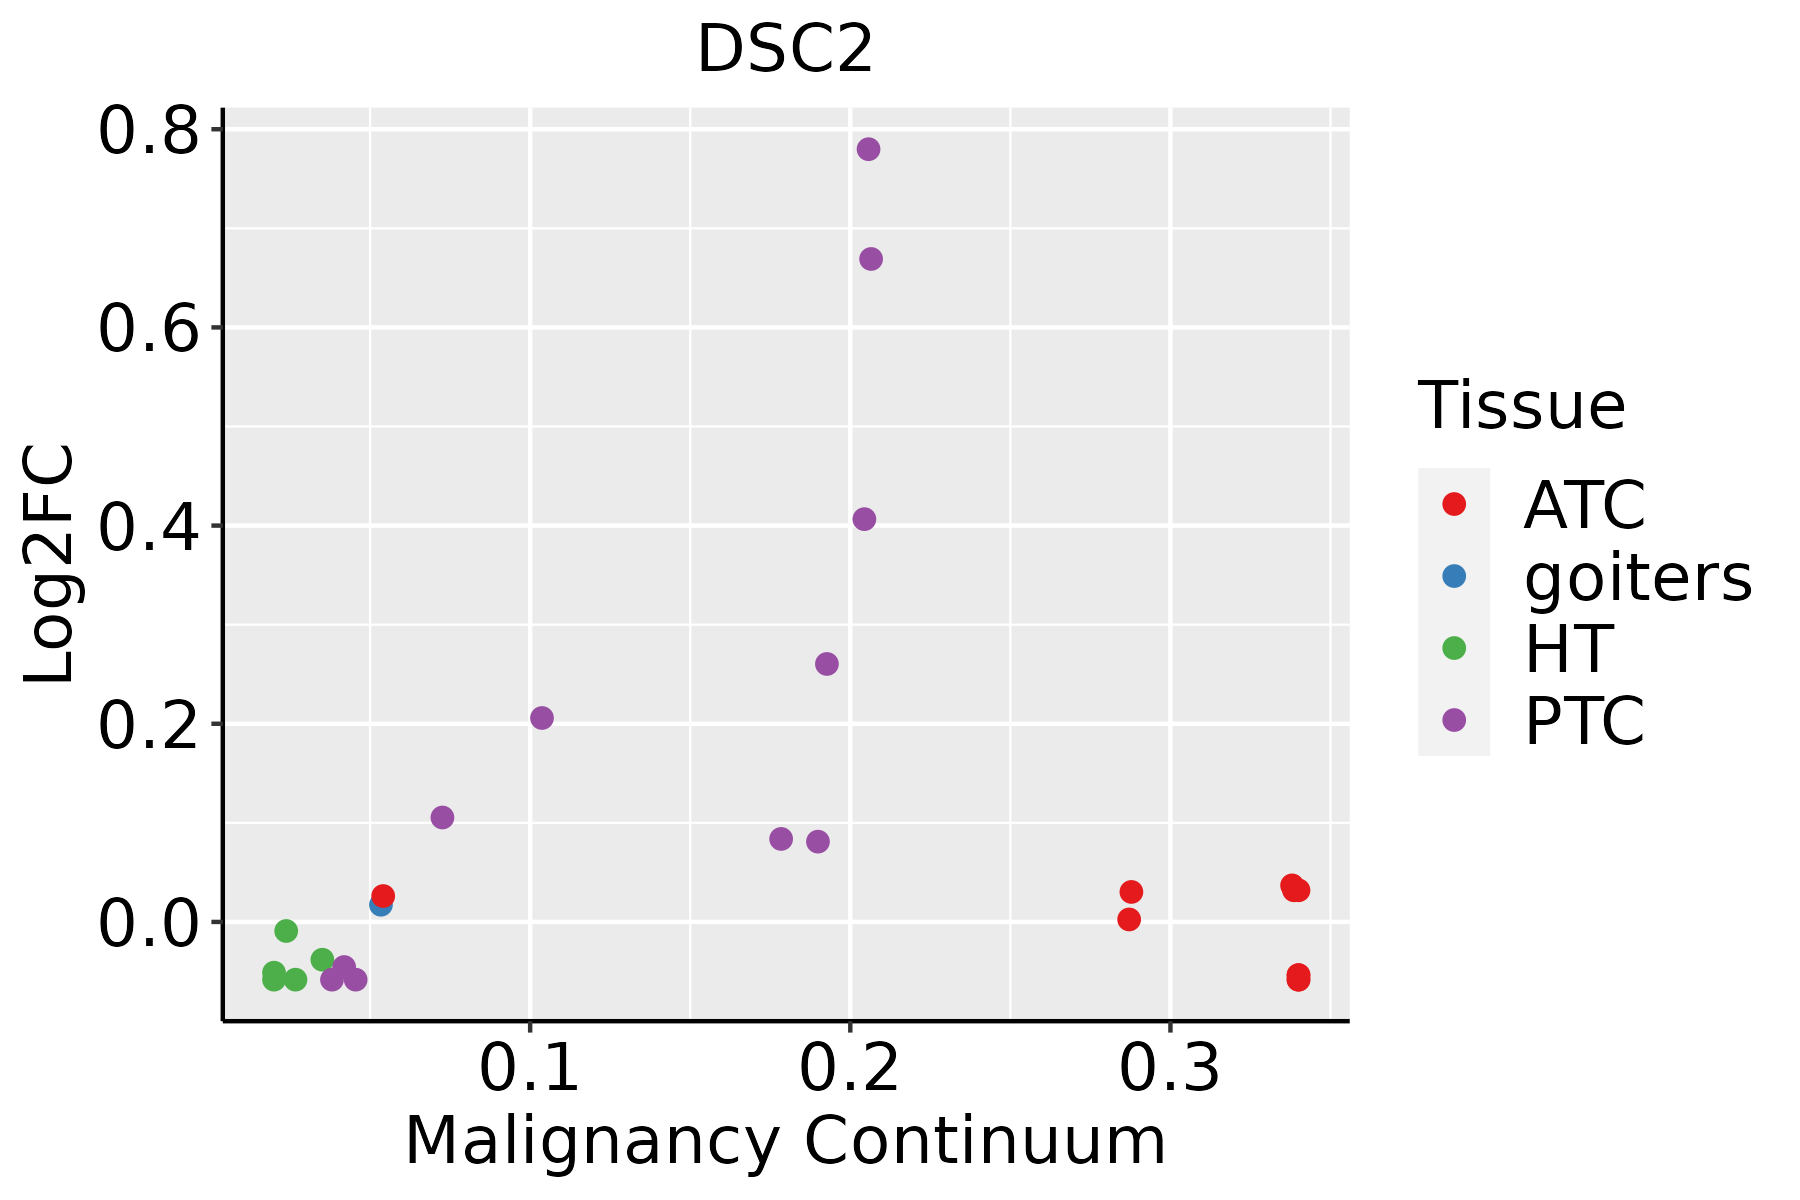 | ATC: Anaplastic thyroid cancer |
| HT: Hashimoto's thyroiditis | ||
| PTC: Papillary thyroid cancer |
| ∗log2FC in expression of this searched gene in stem-like cells from each diseased tissue sample relative to stem-like cells in normal samples in each tissue plotted against the malignancy continuum. Samples are colored based on if they are from different disease stage. |
Top |
Malignant transformation related pathway analysis |
| Find out the enriched GO biological processes and KEGG pathways involved in transition from healthy to precancer to cancer |
| Tissue | Disease Stage | Enriched GO biological Processes |
| Colorectum | AD |  |
| Colorectum | SER |  |
| Colorectum | MSS |  |
| Colorectum | MSI-H |  |
| Colorectum | FAP |  |
| ∗Top 15 enriched GO BP terms are showed in the bar plot of each disease state in each tissue. Each row represents a significant GO biological process which is colored according to the -log10(p.adjust). |
| Page: 1 2 3 4 5 6 7 8 9 |
| GO ID | Tissue | Disease Stage | Description | Gene Ratio | Bg Ratio | pvalue | p.adjust | Count |
| GO:003297014 | Breast | IDC | regulation of actin filament-based process | 56/1434 | 397/18723 | 6.37e-06 | 1.99e-04 | 56 |
| GO:003410913 | Breast | IDC | homotypic cell-cell adhesion | 20/1434 | 90/18723 | 1.20e-05 | 3.17e-04 | 20 |
| GO:008606511 | Breast | IDC | cell communication involved in cardiac conduction | 13/1434 | 58/18723 | 3.59e-04 | 5.18e-03 | 13 |
| GO:00613373 | Breast | IDC | cardiac conduction | 16/1434 | 98/18723 | 3.06e-03 | 2.60e-02 | 16 |
| GO:00423912 | Breast | IDC | regulation of membrane potential | 49/1434 | 434/18723 | 4.04e-03 | 3.25e-02 | 49 |
| GO:00860015 | Breast | IDC | cardiac muscle cell action potential | 13/1434 | 76/18723 | 4.81e-03 | 3.67e-02 | 13 |
| GO:00020271 | Breast | IDC | regulation of heart rate | 16/1434 | 103/18723 | 5.06e-03 | 3.79e-02 | 16 |
| GO:00030125 | Breast | IDC | muscle system process | 50/1434 | 452/18723 | 5.52e-03 | 4.05e-02 | 50 |
| GO:00015082 | Breast | IDC | action potential | 19/1434 | 134/18723 | 6.62e-03 | 4.62e-02 | 19 |
| GO:003297024 | Breast | DCIS | regulation of actin filament-based process | 56/1390 | 397/18723 | 2.50e-06 | 8.74e-05 | 56 |
| GO:003410923 | Breast | DCIS | homotypic cell-cell adhesion | 18/1390 | 90/18723 | 9.33e-05 | 1.71e-03 | 18 |
| GO:008606521 | Breast | DCIS | cell communication involved in cardiac conduction | 12/1390 | 58/18723 | 9.71e-04 | 1.08e-02 | 12 |
| GO:000301212 | Breast | DCIS | muscle system process | 50/1390 | 452/18723 | 3.02e-03 | 2.57e-02 | 50 |
| GO:006133711 | Breast | DCIS | cardiac conduction | 15/1390 | 98/18723 | 5.65e-03 | 4.09e-02 | 15 |
| GO:00423911 | Breast | DCIS | regulation of membrane potential | 47/1390 | 434/18723 | 5.87e-03 | 4.20e-02 | 47 |
| GO:003297010 | Cervix | CC | regulation of actin filament-based process | 96/2311 | 397/18723 | 4.00e-11 | 8.54e-09 | 96 |
| GO:003410910 | Cervix | CC | homotypic cell-cell adhesion | 26/2311 | 90/18723 | 2.12e-05 | 3.82e-04 | 26 |
| GO:00300487 | Cervix | CC | actin filament-based movement | 29/2311 | 127/18723 | 6.91e-04 | 6.33e-03 | 29 |
| GO:00989018 | Cervix | CC | regulation of cardiac muscle cell action potential | 9/2311 | 27/18723 | 3.82e-03 | 2.41e-02 | 9 |
| GO:00551174 | Cervix | CC | regulation of cardiac muscle contraction | 18/2311 | 77/18723 | 5.15e-03 | 3.03e-02 | 18 |
| Page: 1 2 3 4 5 6 7 8 9 10 |
| Pathway ID | Tissue | Disease Stage | Description | Gene Ratio | Bg Ratio | pvalue | p.adjust | qvalue | Count |
| hsa05412 | Colorectum | FAP | Arrhythmogenic right ventricular cardiomyopathy | 23/1404 | 77/8465 | 2.58e-03 | 1.19e-02 | 7.23e-03 | 23 |
| hsa054121 | Colorectum | FAP | Arrhythmogenic right ventricular cardiomyopathy | 23/1404 | 77/8465 | 2.58e-03 | 1.19e-02 | 7.23e-03 | 23 |
| hsa054122 | Colorectum | CRC | Arrhythmogenic right ventricular cardiomyopathy | 18/1091 | 77/8465 | 7.90e-03 | 3.77e-02 | 2.55e-02 | 18 |
| hsa054123 | Colorectum | CRC | Arrhythmogenic right ventricular cardiomyopathy | 18/1091 | 77/8465 | 7.90e-03 | 3.77e-02 | 2.55e-02 | 18 |
| Page: 1 |
Top |
Cell-cell communication analysis |
| Identification of potential cell-cell interactions between two cell types and their ligand-receptor pairs for different disease states |
| Ligand | Receptor | LRpair | Pathway | Tissue | Disease Stage |
| DSC2 | DSG2 | DSC2_DSG2 | DESMOSOME | Breast | DCIS |
| DSC2 | DSG2 | DSC2_DSG2 | DESMOSOME | Breast | Healthy |
| DSC2 | DSG2 | DSC2_DSG2 | DESMOSOME | Breast | Precancer |
| DSC2 | DSG2 | DSC2_DSG2 | DESMOSOME | Cervix | CC |
| DSC2 | DSG1 | DSC2_DSG1 | DESMOSOME | Cervix | Healthy |
| DSC2 | DSG2 | DSC2_DSG2 | DESMOSOME | Cervix | Precancer |
| DSC2 | DSG2 | DSC2_DSG2 | DESMOSOME | CRC | AD |
| DSC2 | DSG2 | DSC2_DSG2 | DESMOSOME | CRC | ADJ |
| DSC2 | DSG2 | DSC2_DSG2 | DESMOSOME | CRC | FAP |
| DSC2 | DSG2 | DSC2_DSG2 | DESMOSOME | CRC | Healthy |
| DSC2 | DSG2 | DSC2_DSG2 | DESMOSOME | CRC | MSI-H |
| DSC2 | DSG2 | DSC2_DSG2 | DESMOSOME | CRC | MSS |
| DSC2 | DSG2 | DSC2_DSG2 | DESMOSOME | CRC | SER |
| DSC2 | DSG2 | DSC2_DSG2 | DESMOSOME | Esophagus | ADJ |
| DSC2 | DSG2 | DSC2_DSG2 | DESMOSOME | Esophagus | ESCC |
| DSC2 | DSG1 | DSC2_DSG1 | DESMOSOME | HNSCC | OSCC |
| DSC2 | DSG2 | DSC2_DSG2 | DESMOSOME | HNSCC | OSCC |
| DSC2 | DSG1 | DSC2_DSG1 | DESMOSOME | HNSCC | Precancer |
| DSC2 | DSG2 | DSC2_DSG2 | DESMOSOME | HNSCC | Precancer |
| DSC2 | DSG2 | DSC2_DSG2 | DESMOSOME | Prostate | BPH |
| Page: 1 2 |
Top |
Single-cell gene regulatory network inference analysis |
| Find out the significant the regulons (TFs) and the target genes of each regulon across cell types for different disease states |
| TF | Cell Type | Tissue | Disease Stage | Target Gene | RSS | Regulon Activity |
| ∗The dot plots of a searched regulon are shown for all cell subpopulations in each disease state of each tissue based on the regulon specific score inferred using pySCENIC and by calculating the average expression. |
| Page: 1 |
Top |
Somatic mutation of malignant transformation related genes |
| Annotation of somatic variants for genes involved in malignant transformation |
| Hugo Symbol | Variant Class | Variant Classification | dbSNP RS | HGVSc | HGVSp | HGVSp Short | SWISSPROT | BIOTYPE | SIFT | PolyPhen | Tumor Sample Barcode | Tissue | Histology | Sex | Age | Stage | Therapy Types | Drugs | Outcome |
| DSC2 | SNV | Missense_Mutation | c.1436N>A | p.Arg479His | p.R479H | Q02487 | protein_coding | deleterious(0.04) | benign(0.02) | TCGA-A8-A07L-01 | Breast | breast invasive carcinoma | Female | <65 | III/IV | Chemotherapy | CR | ||
| DSC2 | SNV | Missense_Mutation | rs752873618 | c.2353N>A | p.Glu785Lys | p.E785K | Q02487 | protein_coding | deleterious(0.01) | probably_damaging(0.909) | TCGA-AN-A046-01 | Breast | breast invasive carcinoma | Female | >=65 | I/II | Unknown | Unknown | SD |
| DSC2 | SNV | Missense_Mutation | novel | c.2020N>A | p.Glu674Lys | p.E674K | Q02487 | protein_coding | deleterious(0.01) | benign(0.103) | TCGA-AN-A046-01 | Breast | breast invasive carcinoma | Female | >=65 | I/II | Unknown | Unknown | SD |
| DSC2 | SNV | Missense_Mutation | novel | c.1622N>C | p.Lys541Thr | p.K541T | Q02487 | protein_coding | tolerated(0.07) | possibly_damaging(0.47) | TCGA-AN-A046-01 | Breast | breast invasive carcinoma | Female | >=65 | I/II | Unknown | Unknown | SD |
| DSC2 | SNV | Missense_Mutation | novel | c.1003N>A | p.Leu335Ile | p.L335I | Q02487 | protein_coding | deleterious(0) | probably_damaging(0.913) | TCGA-AN-A046-01 | Breast | breast invasive carcinoma | Female | >=65 | I/II | Unknown | Unknown | SD |
| DSC2 | SNV | Missense_Mutation | c.1616N>T | p.Thr539Ile | p.T539I | Q02487 | protein_coding | tolerated(0.19) | benign(0.144) | TCGA-BH-A0DK-01 | Breast | breast invasive carcinoma | Female | <65 | I/II | Hormone Therapy | tamoxiphen | SD | |
| DSC2 | SNV | Missense_Mutation | c.1700N>C | p.Leu567Pro | p.L567P | Q02487 | protein_coding | deleterious(0) | probably_damaging(0.981) | TCGA-E2-A155-01 | Breast | breast invasive carcinoma | Female | <65 | I/II | Chemotherapy | cytoxan | SD | |
| DSC2 | SNV | Missense_Mutation | c.700N>A | p.Glu234Lys | p.E234K | Q02487 | protein_coding | deleterious(0.01) | probably_damaging(0.981) | TCGA-E9-A22B-01 | Breast | breast invasive carcinoma | Female | >=65 | I/II | Hormone Therapy | tamoxiphen | SD | |
| DSC2 | SNV | Missense_Mutation | novel | c.275N>T | p.Arg92Ile | p.R92I | Q02487 | protein_coding | deleterious(0) | probably_damaging(0.973) | TCGA-2W-A8YY-01 | Cervix | cervical & endocervical cancer | Female | <65 | I/II | Chemotherapy | cisplatin | CR |
| DSC2 | SNV | Missense_Mutation | c.274N>G | p.Arg92Gly | p.R92G | Q02487 | protein_coding | deleterious(0) | possibly_damaging(0.904) | TCGA-2W-A8YY-01 | Cervix | cervical & endocervical cancer | Female | <65 | I/II | Chemotherapy | cisplatin | CR |
| Page: 1 2 3 4 5 6 7 8 9 10 11 |
Top |
Related drugs of malignant transformation related genes |
| Identification of chemicals and drugs interact with genes involved in malignant transfromation |
| (DGIdb 4.0) |
| Entrez ID | Symbol | Category | Interaction Types | Drug Claim Name | Drug Name | PMIDs |
| Page: 1 |

Copyright 2023-Present -The University of Texas Health Science Center at Houston |