
|
|||||
|
 | |
| |
| |
| |
| |
| |
|
Gene: DROSHA |
Gene summary for DROSHA |
| Gene information | Species | Human | Gene symbol | DROSHA | Gene ID | 29102 |
| Gene name | drosha ribonuclease III | |
| Gene Alias | ETOHI2 | |
| Cytomap | 5p13.3 | |
| Gene Type | protein-coding | GO ID | GO:0001775 | UniProtAcc | Q9NRR4 |
Top |
Malignant transformation analysis |
| Identification of the aberrant gene expression in precancerous and cancerous lesions by comparing the gene expression of stem-like cells in diseased tissues with normal stem cells |
| Entrez ID | Symbol | Replicates | Species | Organ | Tissue | Adj P-value | Log2FC | Malignancy |
| 29102 | DROSHA | CCI_2 | Human | Cervix | CC | 1.20e-05 | 5.82e-01 | 0.5249 |
| 29102 | DROSHA | CCI_3 | Human | Cervix | CC | 8.41e-12 | 7.22e-01 | 0.516 |
| 29102 | DROSHA | LZE2T | Human | Esophagus | ESCC | 4.40e-02 | 3.16e-01 | 0.082 |
| 29102 | DROSHA | LZE4T | Human | Esophagus | ESCC | 6.69e-05 | 1.46e-01 | 0.0811 |
| 29102 | DROSHA | LZE5T | Human | Esophagus | ESCC | 2.55e-03 | 2.34e-01 | 0.0514 |
| 29102 | DROSHA | LZE7T | Human | Esophagus | ESCC | 1.54e-04 | 4.15e-01 | 0.0667 |
| 29102 | DROSHA | LZE8T | Human | Esophagus | ESCC | 8.60e-06 | 2.29e-01 | 0.067 |
| 29102 | DROSHA | LZE20T | Human | Esophagus | ESCC | 3.41e-05 | 3.25e-01 | 0.0662 |
| 29102 | DROSHA | LZE24T | Human | Esophagus | ESCC | 8.48e-06 | 1.32e-01 | 0.0596 |
| 29102 | DROSHA | P1T-E | Human | Esophagus | ESCC | 2.06e-07 | 3.69e-01 | 0.0875 |
| 29102 | DROSHA | P2T-E | Human | Esophagus | ESCC | 1.48e-15 | 2.03e-01 | 0.1177 |
| 29102 | DROSHA | P4T-E | Human | Esophagus | ESCC | 3.36e-05 | 1.70e-01 | 0.1323 |
| 29102 | DROSHA | P5T-E | Human | Esophagus | ESCC | 2.97e-11 | 1.94e-01 | 0.1327 |
| 29102 | DROSHA | P8T-E | Human | Esophagus | ESCC | 1.53e-26 | 4.79e-01 | 0.0889 |
| 29102 | DROSHA | P9T-E | Human | Esophagus | ESCC | 4.29e-08 | 1.36e-01 | 0.1131 |
| 29102 | DROSHA | P10T-E | Human | Esophagus | ESCC | 7.05e-19 | 3.83e-01 | 0.116 |
| 29102 | DROSHA | P11T-E | Human | Esophagus | ESCC | 1.22e-06 | 3.03e-01 | 0.1426 |
| 29102 | DROSHA | P12T-E | Human | Esophagus | ESCC | 4.06e-12 | 2.95e-01 | 0.1122 |
| 29102 | DROSHA | P15T-E | Human | Esophagus | ESCC | 2.67e-05 | 1.17e-01 | 0.1149 |
| 29102 | DROSHA | P16T-E | Human | Esophagus | ESCC | 6.24e-15 | 2.27e-01 | 0.1153 |
| Page: 1 2 3 4 |
| Tissue | Expression Dynamics | Abbreviation |
| Cervix |  | CC: Cervix cancer |
| HSIL_HPV: HPV-infected high-grade squamous intraepithelial lesions | ||
| N_HPV: HPV-infected normal cervix | ||
| Esophagus | 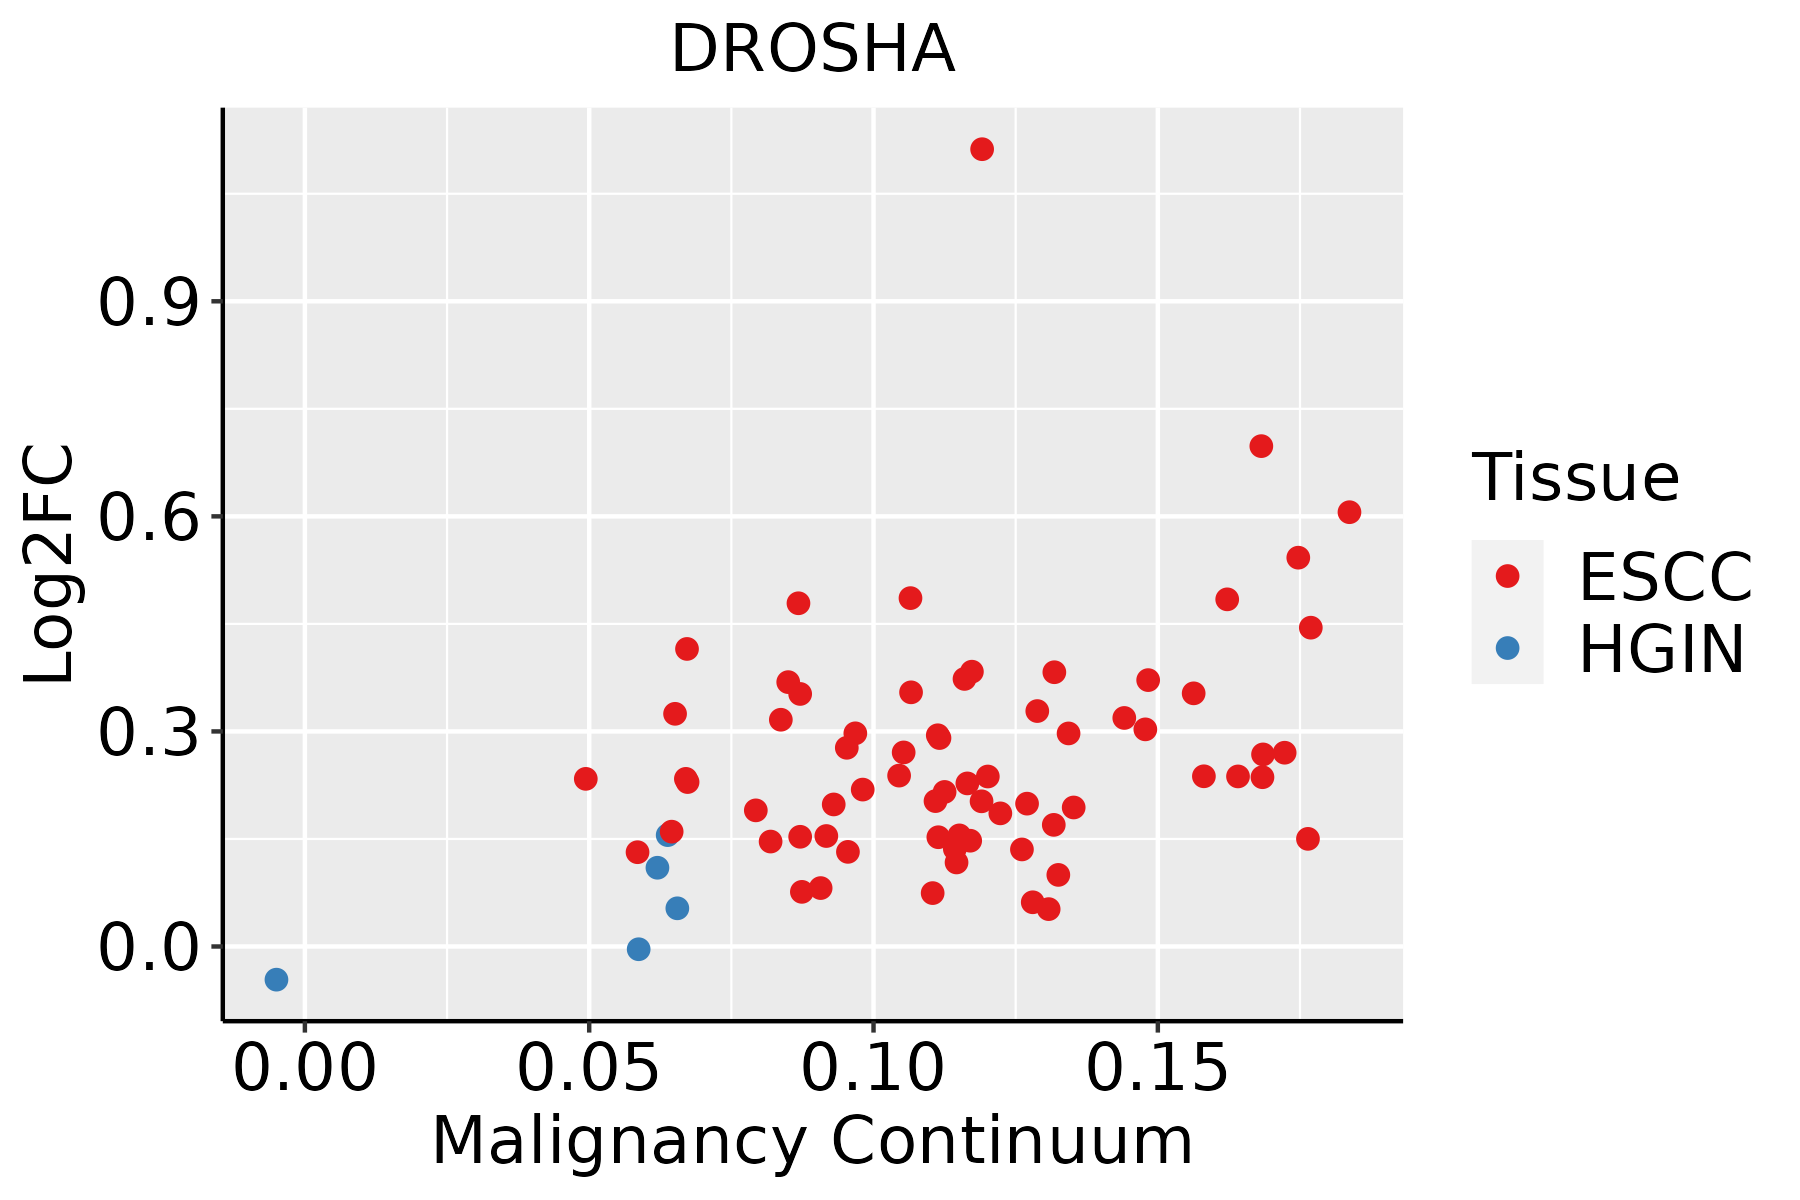 | ESCC: Esophageal squamous cell carcinoma |
| HGIN: High-grade intraepithelial neoplasias | ||
| LGIN: Low-grade intraepithelial neoplasias | ||
| Liver | 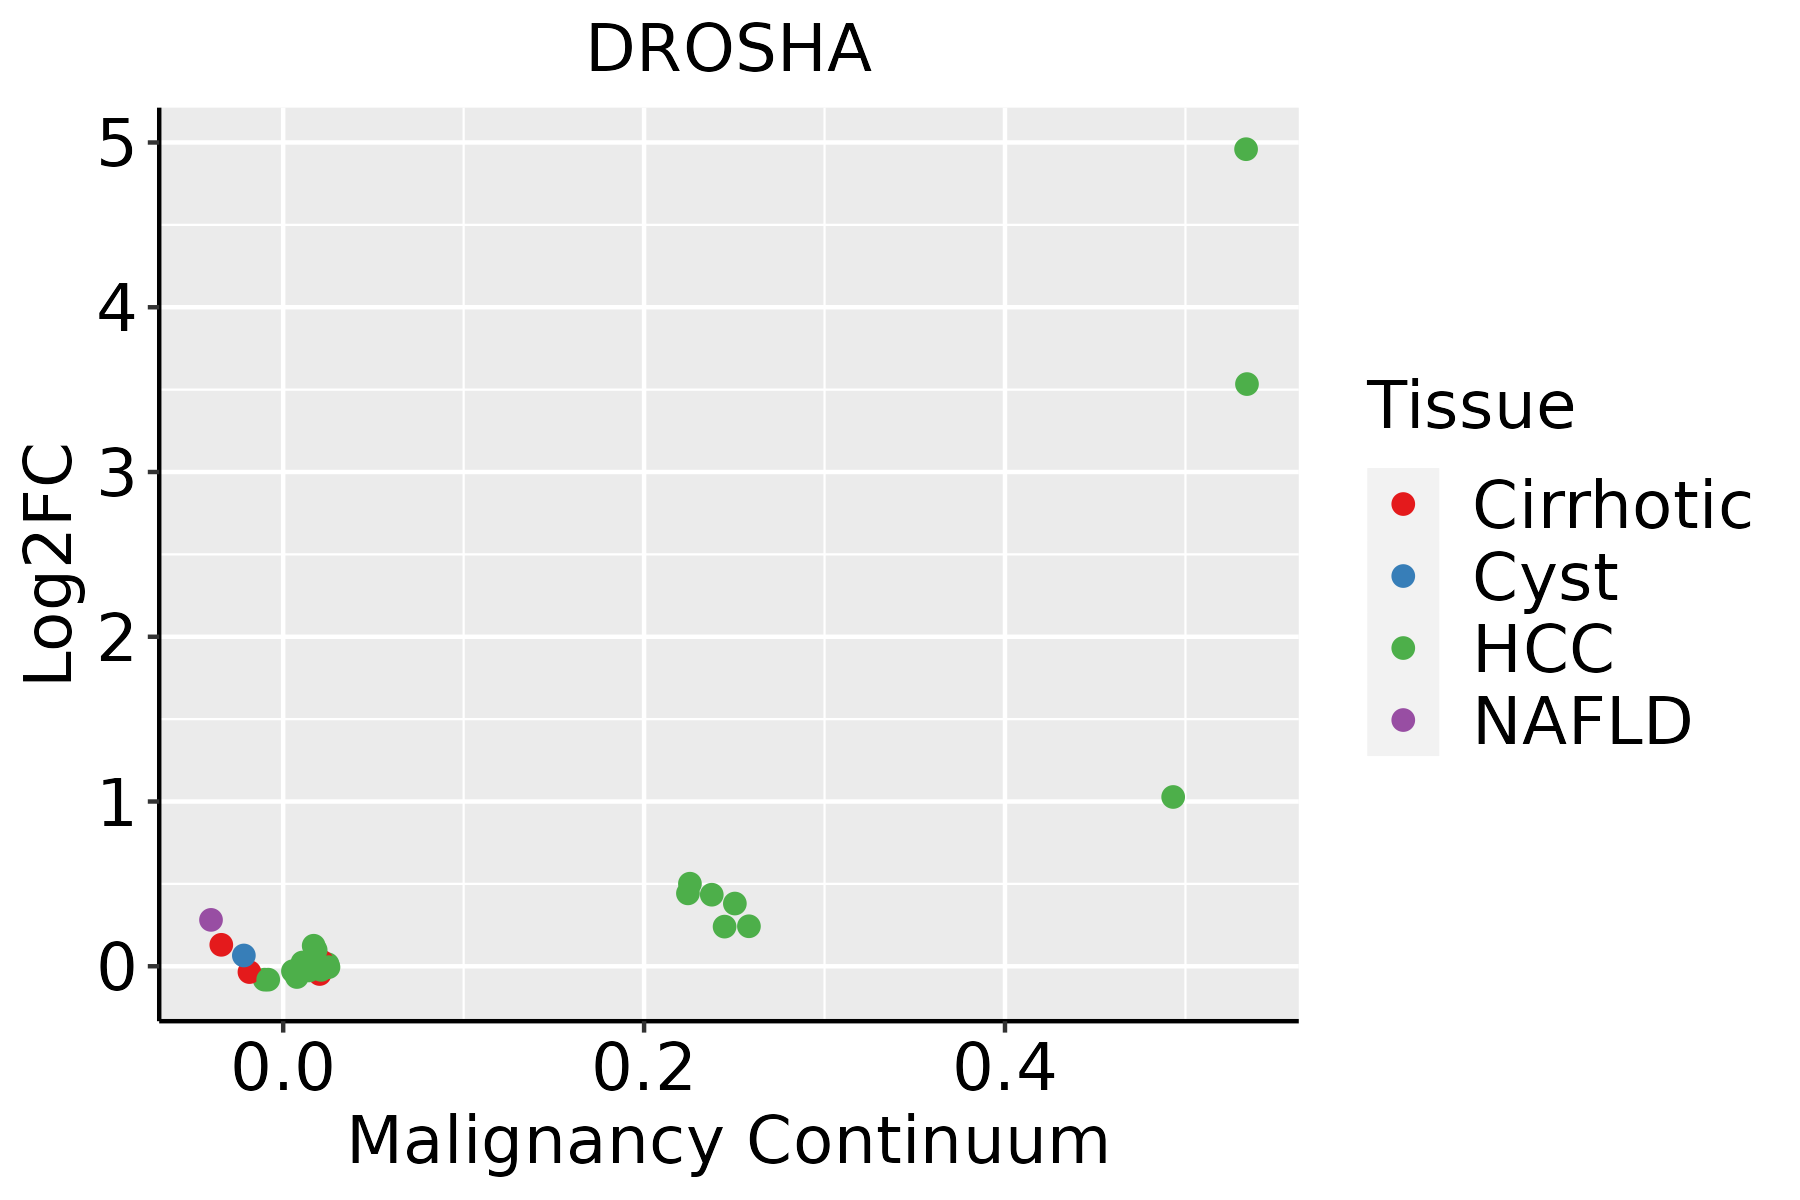 | HCC: Hepatocellular carcinoma |
| NAFLD: Non-alcoholic fatty liver disease |
| ∗log2FC in expression of this searched gene in stem-like cells from each diseased tissue sample relative to stem-like cells in normal samples in each tissue plotted against the malignancy continuum. Samples are colored based on if they are from different disease stage. |
Top |
Malignant transformation related pathway analysis |
| Find out the enriched GO biological processes and KEGG pathways involved in transition from healthy to precancer to cancer |
| Tissue | Disease Stage | Enriched GO biological Processes |
| Colorectum | AD |  |
| Colorectum | SER |  |
| Colorectum | MSS |  |
| Colorectum | MSI-H |  |
| Colorectum | FAP |  |
| ∗Top 15 enriched GO BP terms are showed in the bar plot of each disease state in each tissue. Each row represents a significant GO biological process which is colored according to the -log10(p.adjust). |
| Page: 1 2 3 4 5 6 7 8 9 |
| GO ID | Tissue | Disease Stage | Description | Gene Ratio | Bg Ratio | pvalue | p.adjust | Count |
| GO:00421108 | Cervix | CC | T cell activation | 107/2311 | 487/18723 | 1.24e-09 | 1.46e-07 | 107 |
| GO:00508638 | Cervix | CC | regulation of T cell activation | 80/2311 | 329/18723 | 1.28e-09 | 1.47e-07 | 80 |
| GO:190370610 | Cervix | CC | regulation of hemopoiesis | 80/2311 | 367/18723 | 2.14e-07 | 9.55e-06 | 80 |
| GO:00064019 | Cervix | CC | RNA catabolic process | 62/2311 | 278/18723 | 2.18e-06 | 6.56e-05 | 62 |
| GO:19021056 | Cervix | CC | regulation of leukocyte differentiation | 61/2311 | 279/18723 | 5.16e-06 | 1.29e-04 | 61 |
| GO:002261310 | Cervix | CC | ribonucleoprotein complex biogenesis | 88/2311 | 463/18723 | 2.11e-05 | 3.82e-04 | 88 |
| GO:004225410 | Cervix | CC | ribosome biogenesis | 62/2311 | 299/18723 | 2.48e-05 | 4.27e-04 | 62 |
| GO:00507273 | Cervix | CC | regulation of inflammatory response | 75/2311 | 386/18723 | 3.95e-05 | 6.18e-04 | 75 |
| GO:00467008 | Cervix | CC | heterocycle catabolic process | 80/2311 | 445/18723 | 3.23e-04 | 3.42e-03 | 80 |
| GO:0045580 | Cervix | CC | regulation of T cell differentiation | 33/2311 | 146/18723 | 3.75e-04 | 3.87e-03 | 33 |
| GO:00346559 | Cervix | CC | nucleobase-containing compound catabolic process | 74/2311 | 407/18723 | 3.77e-04 | 3.88e-03 | 74 |
| GO:00302173 | Cervix | CC | T cell differentiation | 51/2311 | 257/18723 | 3.81e-04 | 3.89e-03 | 51 |
| GO:19031314 | Cervix | CC | mononuclear cell differentiation | 76/2311 | 426/18723 | 5.66e-04 | 5.42e-03 | 76 |
| GO:00456192 | Cervix | CC | regulation of lymphocyte differentiation | 37/2311 | 174/18723 | 6.06e-04 | 5.69e-03 | 37 |
| GO:00442709 | Cervix | CC | cellular nitrogen compound catabolic process | 79/2311 | 451/18723 | 7.80e-04 | 6.91e-03 | 79 |
| GO:00194398 | Cervix | CC | aromatic compound catabolic process | 79/2311 | 467/18723 | 2.14e-03 | 1.54e-02 | 79 |
| GO:0045589 | Cervix | CC | regulation of regulatory T cell differentiation | 9/2311 | 28/18723 | 5.02e-03 | 2.98e-02 | 9 |
| GO:00300981 | Cervix | CC | lymphocyte differentiation | 63/2311 | 374/18723 | 6.21e-03 | 3.52e-02 | 63 |
| GO:19013618 | Cervix | CC | organic cyclic compound catabolic process | 80/2311 | 495/18723 | 6.77e-03 | 3.72e-02 | 80 |
| GO:00351966 | Cervix | CC | production of miRNAs involved in gene silencing by miRNA | 13/2311 | 52/18723 | 9.09e-03 | 4.60e-02 | 13 |
| Page: 1 2 3 4 |
| Pathway ID | Tissue | Disease Stage | Description | Gene Ratio | Bg Ratio | pvalue | p.adjust | qvalue | Count |
| hsa0520516 | Cervix | CC | Proteoglycans in cancer | 60/1267 | 205/8465 | 9.13e-08 | 1.18e-06 | 7.00e-07 | 60 |
| hsa0520517 | Cervix | CC | Proteoglycans in cancer | 60/1267 | 205/8465 | 9.13e-08 | 1.18e-06 | 7.00e-07 | 60 |
| hsa0520529 | Esophagus | ESCC | Proteoglycans in cancer | 138/4205 | 205/8465 | 1.79e-07 | 1.40e-06 | 7.15e-07 | 138 |
| hsa0520537 | Esophagus | ESCC | Proteoglycans in cancer | 138/4205 | 205/8465 | 1.79e-07 | 1.40e-06 | 7.15e-07 | 138 |
| hsa0520521 | Liver | HCC | Proteoglycans in cancer | 121/4020 | 205/8465 | 5.22e-04 | 2.18e-03 | 1.21e-03 | 121 |
| hsa0520531 | Liver | HCC | Proteoglycans in cancer | 121/4020 | 205/8465 | 5.22e-04 | 2.18e-03 | 1.21e-03 | 121 |
| Page: 1 |
Top |
Cell-cell communication analysis |
| Identification of potential cell-cell interactions between two cell types and their ligand-receptor pairs for different disease states |
| Ligand | Receptor | LRpair | Pathway | Tissue | Disease Stage |
| Page: 1 |
Top |
Single-cell gene regulatory network inference analysis |
| Find out the significant the regulons (TFs) and the target genes of each regulon across cell types for different disease states |
| TF | Cell Type | Tissue | Disease Stage | Target Gene | RSS | Regulon Activity |
| ∗The dot plots of a searched regulon are shown for all cell subpopulations in each disease state of each tissue based on the regulon specific score inferred using pySCENIC and by calculating the average expression. |
| Page: 1 |
Top |
Somatic mutation of malignant transformation related genes |
| Annotation of somatic variants for genes involved in malignant transformation |
| Hugo Symbol | Variant Class | Variant Classification | dbSNP RS | HGVSc | HGVSp | HGVSp Short | SWISSPROT | BIOTYPE | SIFT | PolyPhen | Tumor Sample Barcode | Tissue | Histology | Sex | Age | Stage | Therapy Types | Drugs | Outcome |
| DROSHA | SNV | Missense_Mutation | c.233N>G | p.Phe78Cys | p.F78C | Q9NRR4 | protein_coding | deleterious_low_confidence(0) | possibly_damaging(0.615) | TCGA-A2-A0SX-01 | Breast | breast invasive carcinoma | Female | <65 | I/II | Chemotherapy | adriamycin | PD | |
| DROSHA | SNV | Missense_Mutation | c.3278N>T | p.Thr1093Ile | p.T1093I | Q9NRR4 | protein_coding | deleterious(0) | benign(0.247) | TCGA-A8-A07W-01 | Breast | breast invasive carcinoma | Female | >=65 | III/IV | Hormone Therapy | exemestane | SD | |
| DROSHA | SNV | Missense_Mutation | c.3277N>T | p.Thr1093Ser | p.T1093S | Q9NRR4 | protein_coding | tolerated(0.13) | benign(0.007) | TCGA-A8-A07W-01 | Breast | breast invasive carcinoma | Female | >=65 | III/IV | Hormone Therapy | exemestane | SD | |
| DROSHA | SNV | Missense_Mutation | rs569160930 | c.110A>C | p.Gln37Pro | p.Q37P | Q9NRR4 | protein_coding | tolerated_low_confidence(0.18) | benign(0.099) | TCGA-AN-A0FW-01 | Breast | breast invasive carcinoma | Female | >=65 | III/IV | Unknown | Unknown | SD |
| DROSHA | SNV | Missense_Mutation | novel | c.496N>C | p.Tyr166His | p.Y166H | Q9NRR4 | protein_coding | tolerated_low_confidence(0.11) | probably_damaging(0.969) | TCGA-AO-A128-01 | Breast | breast invasive carcinoma | Female | <65 | I/II | Chemotherapy | doxorubicin | SD |
| DROSHA | SNV | Missense_Mutation | c.545N>C | p.Phe182Ser | p.F182S | Q9NRR4 | protein_coding | tolerated_low_confidence(0.22) | probably_damaging(0.91) | TCGA-B6-A0IJ-01 | Breast | breast invasive carcinoma | Female | <65 | I/II | Unknown | Unknown | SD | |
| DROSHA | SNV | Missense_Mutation | c.4051N>C | p.Glu1351Gln | p.E1351Q | Q9NRR4 | protein_coding | tolerated(0.34) | benign(0.018) | TCGA-BH-A0HP-01 | Breast | breast invasive carcinoma | Female | >=65 | III/IV | Chemotherapy | doxorubicin | SD | |
| DROSHA | SNV | Missense_Mutation | c.4070N>T | p.Trp1357Leu | p.W1357L | Q9NRR4 | protein_coding | tolerated_low_confidence(0.7) | benign(0) | TCGA-D8-A27G-01 | Breast | breast invasive carcinoma | Female | >=65 | I/II | Unknown | Unknown | SD | |
| DROSHA | SNV | Missense_Mutation | c.3847N>G | p.Leu1283Val | p.L1283V | Q9NRR4 | protein_coding | tolerated(0.53) | benign(0.055) | TCGA-E2-A10C-01 | Breast | breast invasive carcinoma | Female | <65 | I/II | Chemotherapy | cytoxan | SD | |
| DROSHA | insertion | Nonsense_Mutation | novel | c.497_498insGA | p.Tyr166Ter | p.Y166* | Q9NRR4 | protein_coding | TCGA-AO-A128-01 | Breast | breast invasive carcinoma | Female | <65 | I/II | Chemotherapy | doxorubicin | SD |
| Page: 1 2 3 4 5 6 7 8 9 10 11 12 13 14 15 |
Top |
Related drugs of malignant transformation related genes |
| Identification of chemicals and drugs interact with genes involved in malignant transfromation |
| (DGIdb 4.0) |
| Entrez ID | Symbol | Category | Interaction Types | Drug Claim Name | Drug Name | PMIDs |
| 29102 | DROSHA | NA | daunorubicin | DAUNORUBICIN | 24614921 | |
| 29102 | DROSHA | NA | vincristine | VINCRISTINE | 24614921 | |
| 29102 | DROSHA | NA | cyclophosphamide | CYCLOPHOSPHAMIDE | 24614921 | |
| 29102 | DROSHA | NA | mercaptopurine | MERCAPTOPURINE | 24614921 | |
| 29102 | DROSHA | NA | methotrexate | METHOTREXATE | 24614921 | |
| 29102 | DROSHA | NA | cytarabine | CYTARABINE | 24614921 | |
| 29102 | DROSHA | NA | prednisone | PREDNISONE | 24614921 |
| Page: 1 |

Copyright 2023-Present -The University of Texas Health Science Center at Houston |