
|
|||||
|
 | |
| |
| |
| |
| |
| |
|
Gene: DRAP1 |
Gene summary for DRAP1 |
| Gene information | Species | Human | Gene symbol | DRAP1 | Gene ID | 10589 |
| Gene name | DR1 associated protein 1 | |
| Gene Alias | NC2-alpha | |
| Cytomap | 11q13.1 | |
| Gene Type | protein-coding | GO ID | GO:0000122 | UniProtAcc | Q14919 |
Top |
Malignant transformation analysis |
| Identification of the aberrant gene expression in precancerous and cancerous lesions by comparing the gene expression of stem-like cells in diseased tissues with normal stem cells |
| Entrez ID | Symbol | Replicates | Species | Organ | Tissue | Adj P-value | Log2FC | Malignancy |
| 10589 | DRAP1 | CA_HPV_1 | Human | Cervix | CC | 2.34e-05 | -3.50e-02 | 0.0264 |
| 10589 | DRAP1 | CA_HPV_3 | Human | Cervix | CC | 2.04e-03 | 8.31e-02 | 0.0414 |
| 10589 | DRAP1 | CCI_1 | Human | Cervix | CC | 2.10e-09 | -7.19e-01 | 0.528 |
| 10589 | DRAP1 | CCI_2 | Human | Cervix | CC | 8.67e-09 | -7.13e-01 | 0.5249 |
| 10589 | DRAP1 | CCI_3 | Human | Cervix | CC | 7.93e-15 | -7.52e-01 | 0.516 |
| 10589 | DRAP1 | CCII_1 | Human | Cervix | CC | 3.73e-17 | -7.10e-01 | 0.3249 |
| 10589 | DRAP1 | H2 | Human | Cervix | HSIL_HPV | 2.03e-12 | -4.96e-01 | 0.0632 |
| 10589 | DRAP1 | L1 | Human | Cervix | CC | 1.63e-04 | -2.54e-01 | 0.0802 |
| 10589 | DRAP1 | T2 | Human | Cervix | CC | 3.15e-02 | -5.22e-01 | 0.0709 |
| 10589 | DRAP1 | HTA11_347_2000001011 | Human | Colorectum | AD | 1.90e-04 | 1.60e-01 | -0.1954 |
| 10589 | DRAP1 | HTA11_2112_2000001011 | Human | Colorectum | SER | 2.74e-02 | 3.69e-01 | -0.2196 |
| 10589 | DRAP1 | HTA11_696_2000001011 | Human | Colorectum | AD | 4.03e-09 | 1.90e-01 | -0.1464 |
| 10589 | DRAP1 | HTA11_866_2000001011 | Human | Colorectum | AD | 1.71e-09 | 2.40e-01 | -0.1001 |
| 10589 | DRAP1 | HTA11_1391_2000001011 | Human | Colorectum | AD | 1.25e-08 | 2.99e-01 | -0.059 |
| 10589 | DRAP1 | HTA11_546_2000001011 | Human | Colorectum | AD | 8.60e-03 | 2.48e-01 | -0.0842 |
| 10589 | DRAP1 | HTA11_866_3004761011 | Human | Colorectum | AD | 3.45e-05 | 2.01e-01 | 0.096 |
| 10589 | DRAP1 | HTA11_10711_2000001011 | Human | Colorectum | AD | 6.16e-03 | 2.03e-01 | 0.0338 |
| 10589 | DRAP1 | HTA11_7696_3000711011 | Human | Colorectum | AD | 1.55e-03 | 1.21e-01 | 0.0674 |
| 10589 | DRAP1 | HTA11_6818_2000001021 | Human | Colorectum | AD | 2.38e-09 | 3.50e-01 | 0.0588 |
| 10589 | DRAP1 | HTA11_99999970781_79442 | Human | Colorectum | MSS | 3.69e-04 | 1.23e-01 | 0.294 |
| Page: 1 2 3 4 5 6 7 8 9 10 |
| Tissue | Expression Dynamics | Abbreviation |
| Cervix |  | CC: Cervix cancer |
| HSIL_HPV: HPV-infected high-grade squamous intraepithelial lesions | ||
| N_HPV: HPV-infected normal cervix | ||
| Colorectum (GSE201348) |  | FAP: Familial adenomatous polyposis |
| CRC: Colorectal cancer | ||
| Colorectum (HTA11) |  | AD: Adenomas |
| SER: Sessile serrated lesions | ||
| MSI-H: Microsatellite-high colorectal cancer | ||
| MSS: Microsatellite stable colorectal cancer | ||
| Endometrium | 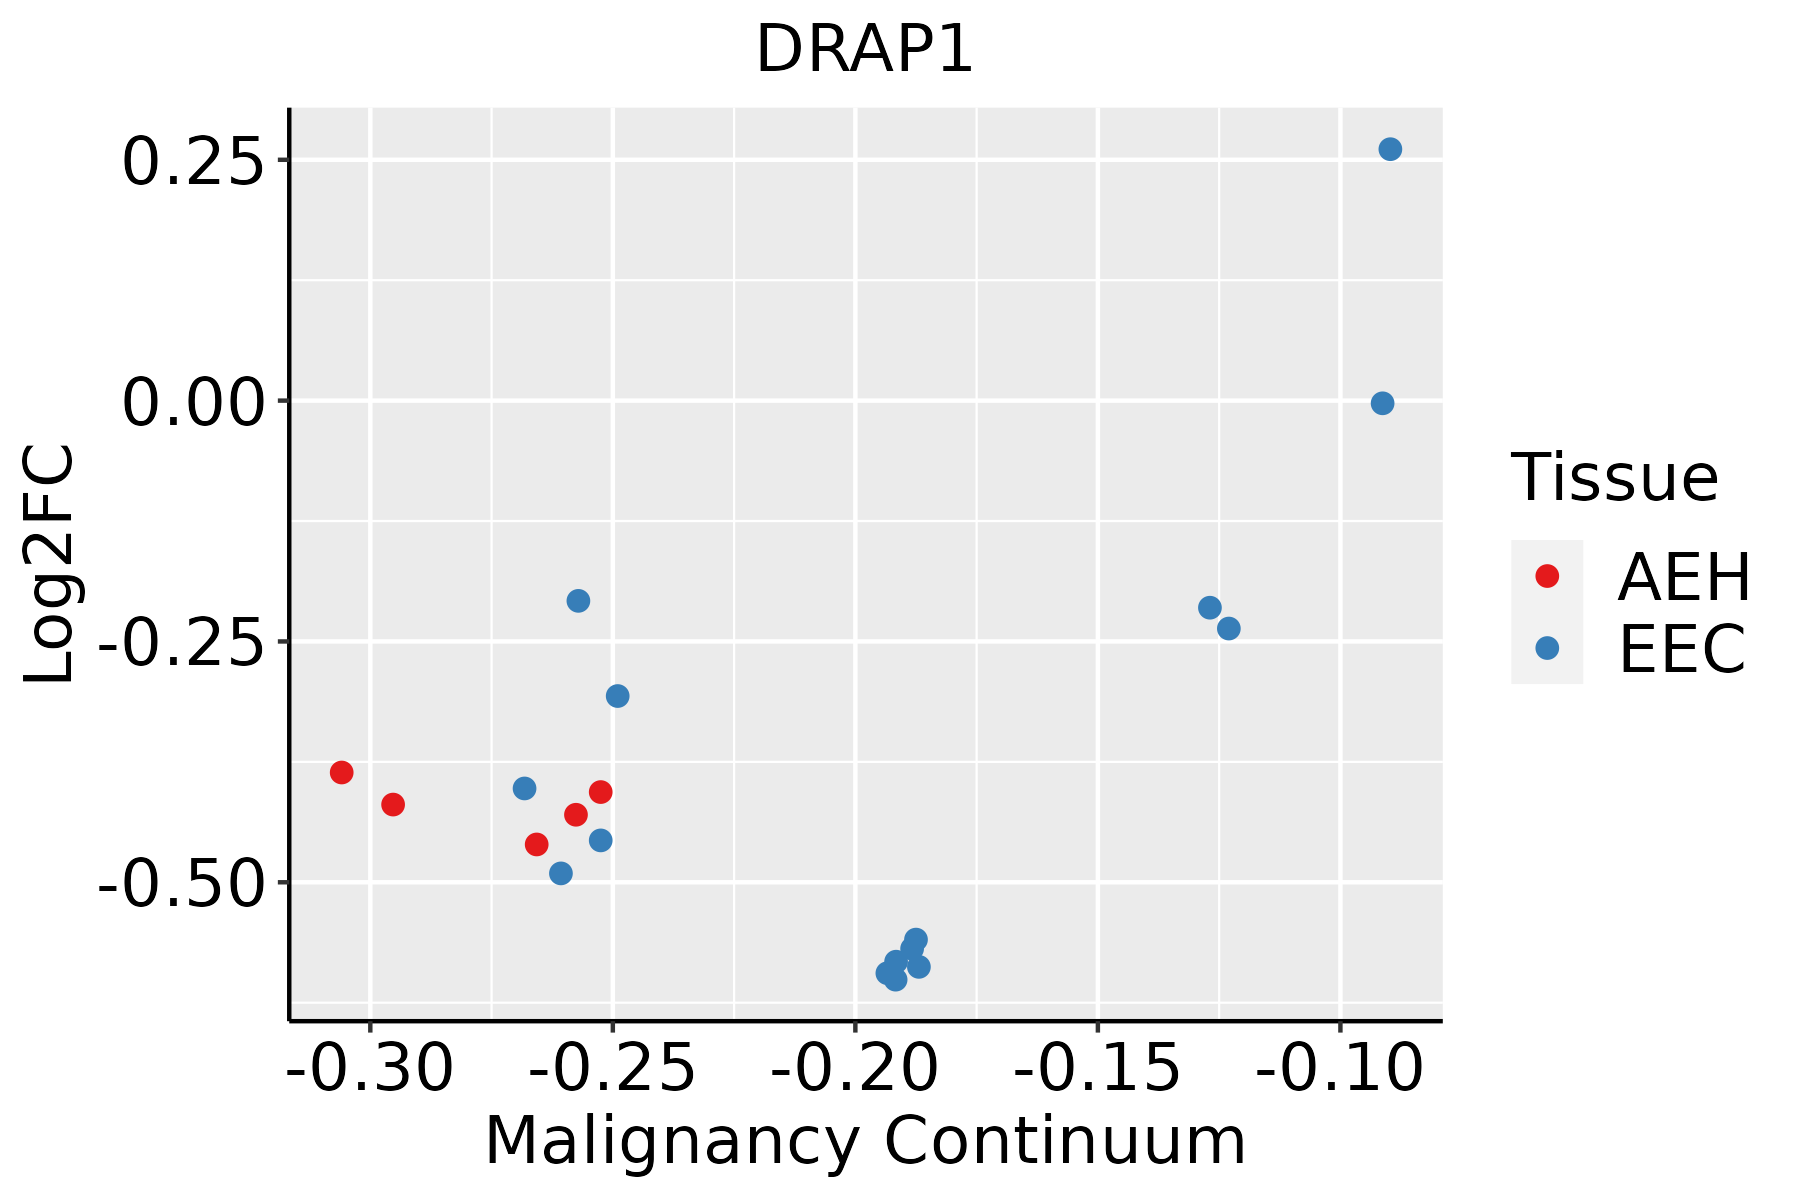 | AEH: Atypical endometrial hyperplasia |
| EEC: Endometrioid Cancer | ||
| Esophagus | 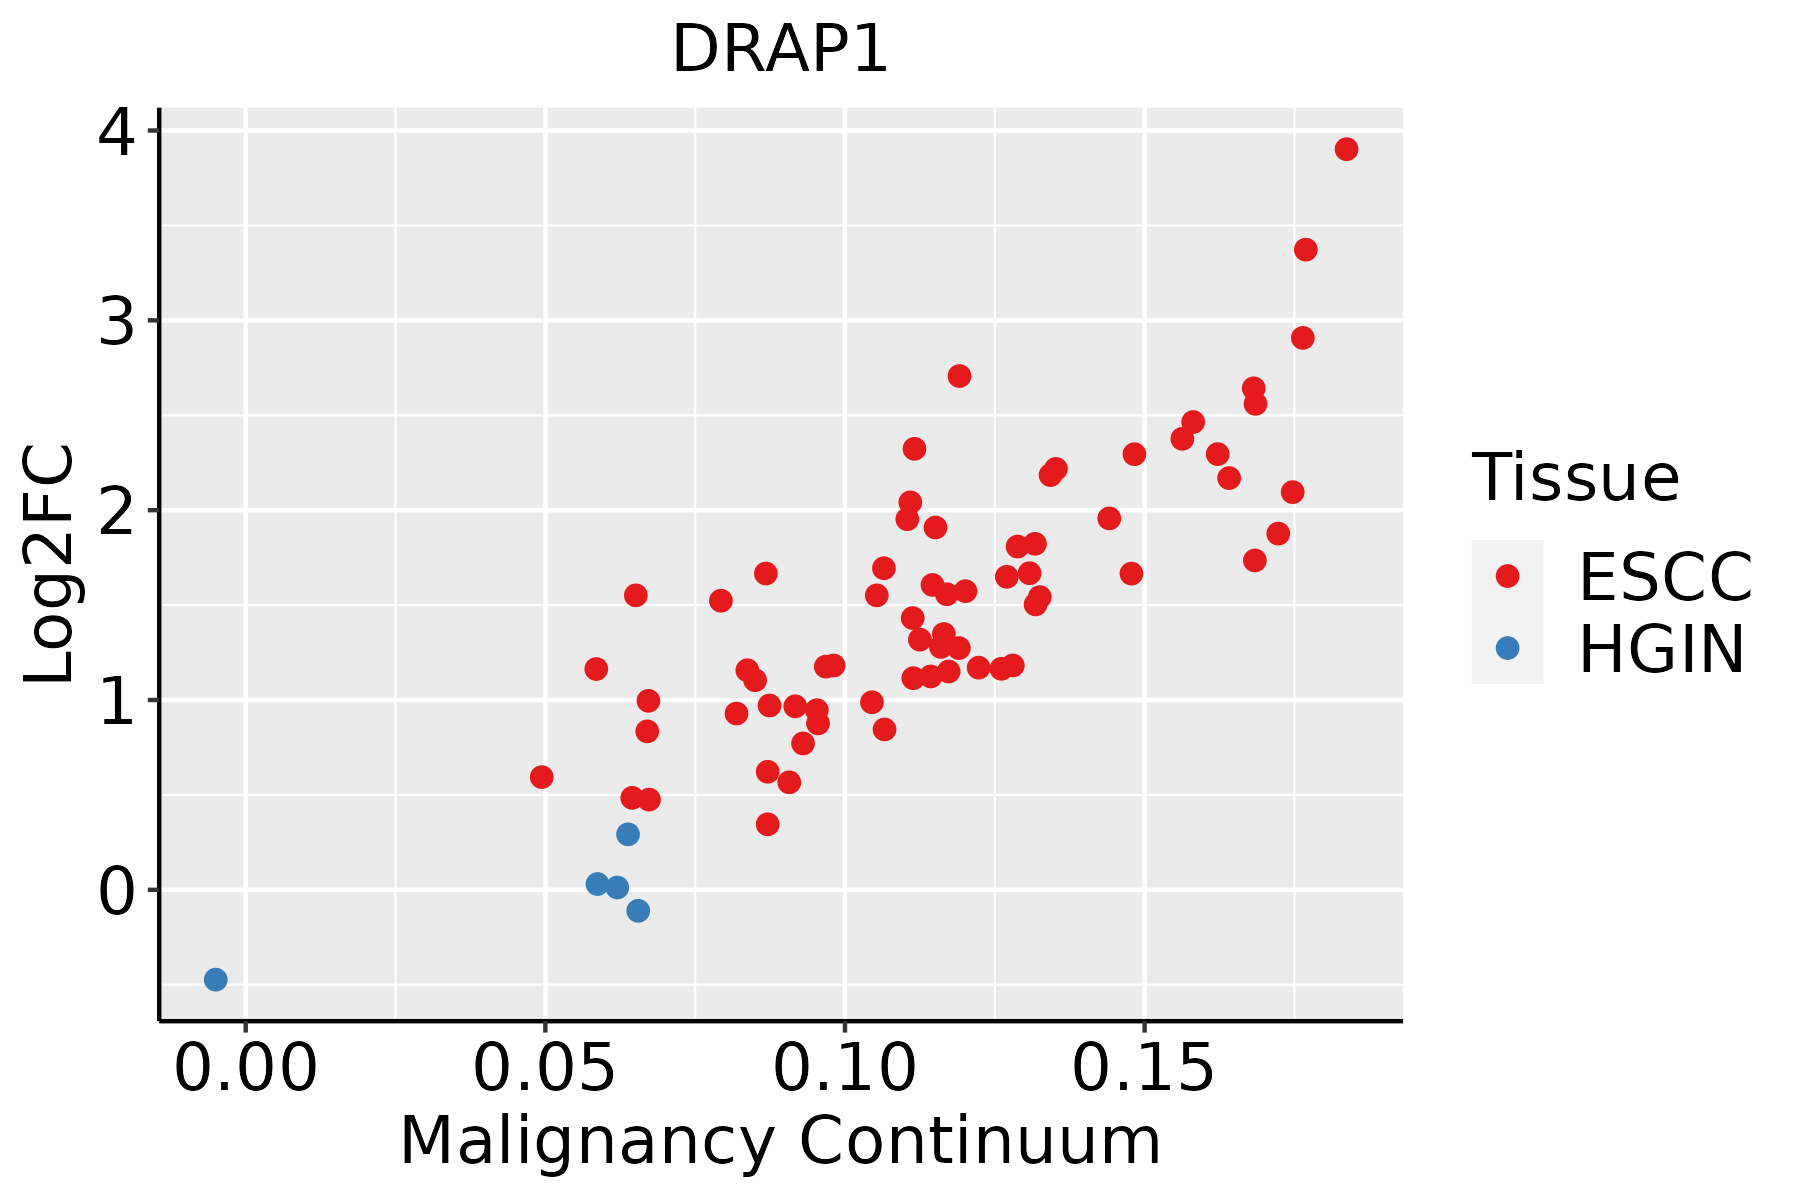 | ESCC: Esophageal squamous cell carcinoma |
| HGIN: High-grade intraepithelial neoplasias | ||
| LGIN: Low-grade intraepithelial neoplasias | ||
| Liver | 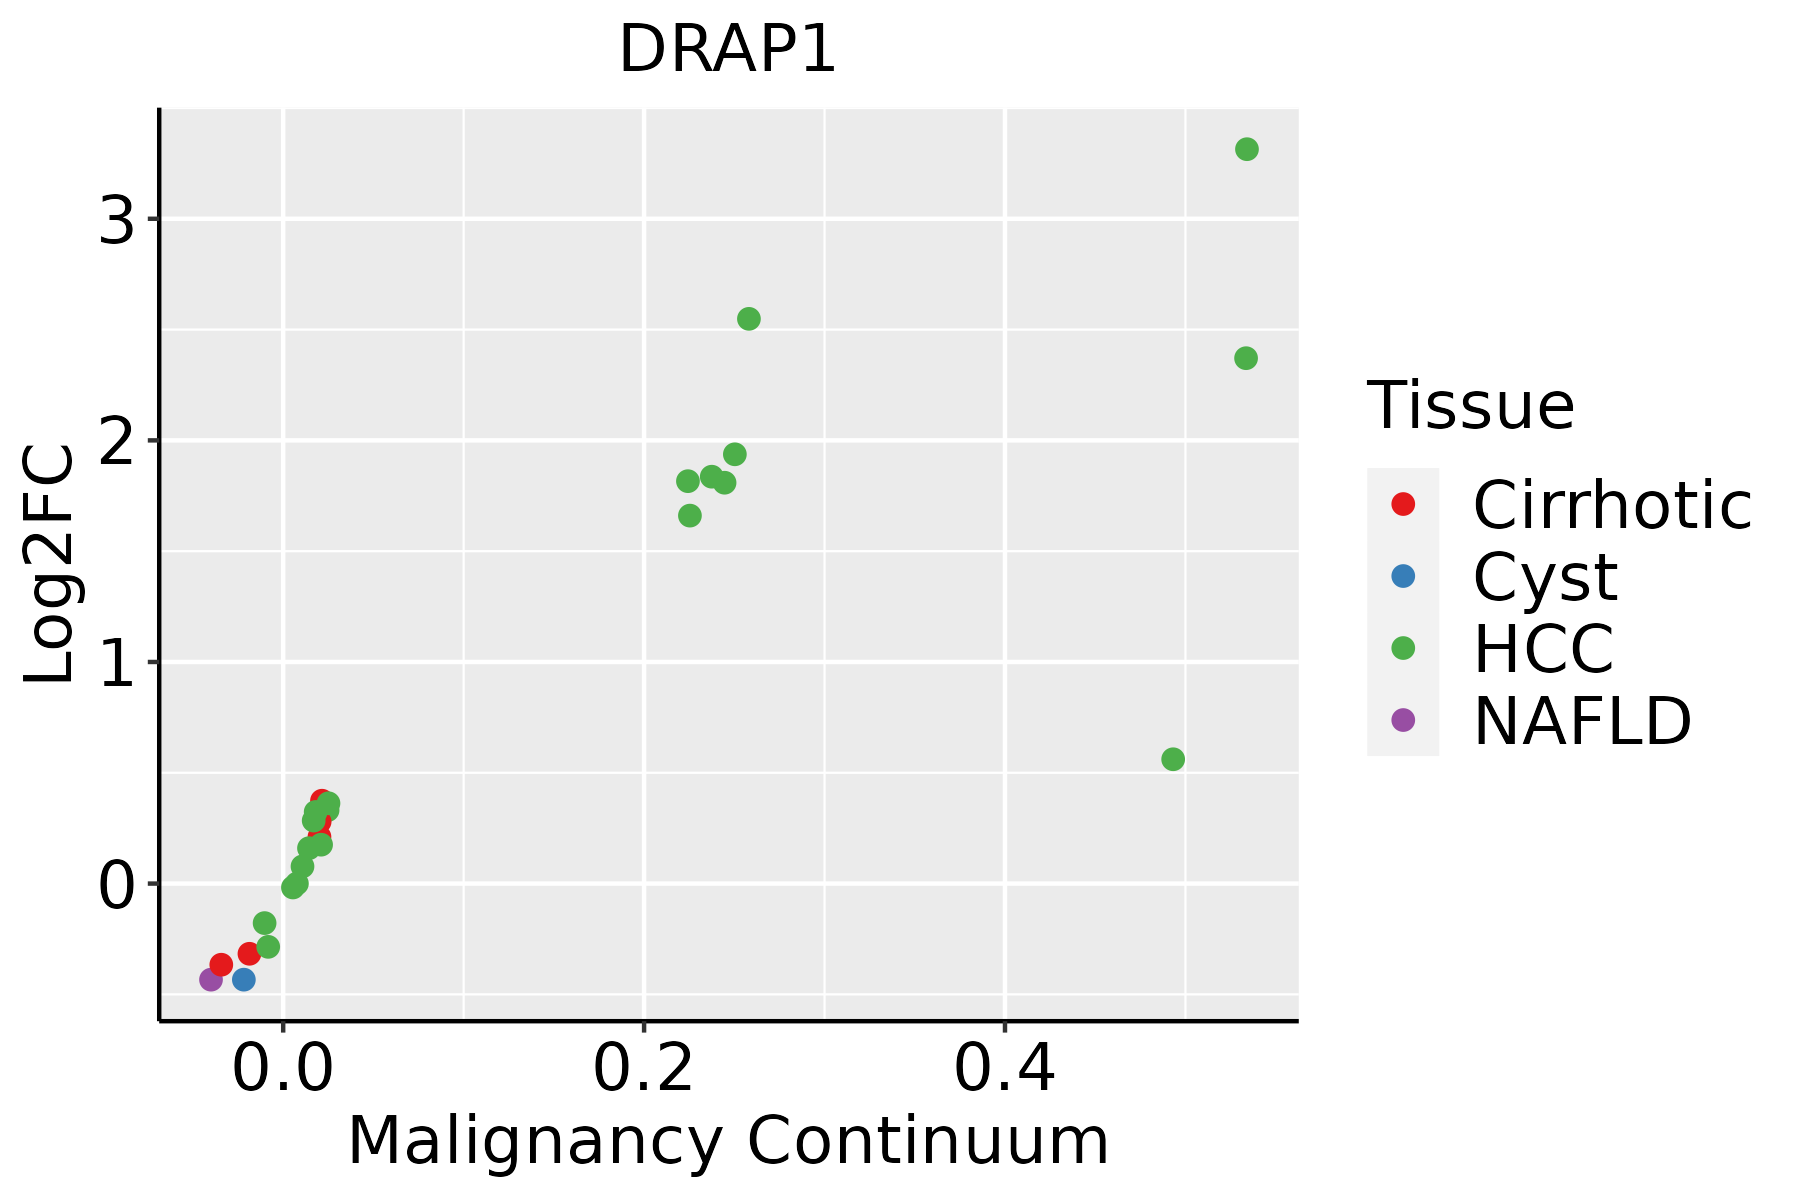 | HCC: Hepatocellular carcinoma |
| NAFLD: Non-alcoholic fatty liver disease | ||
| Oral Cavity | 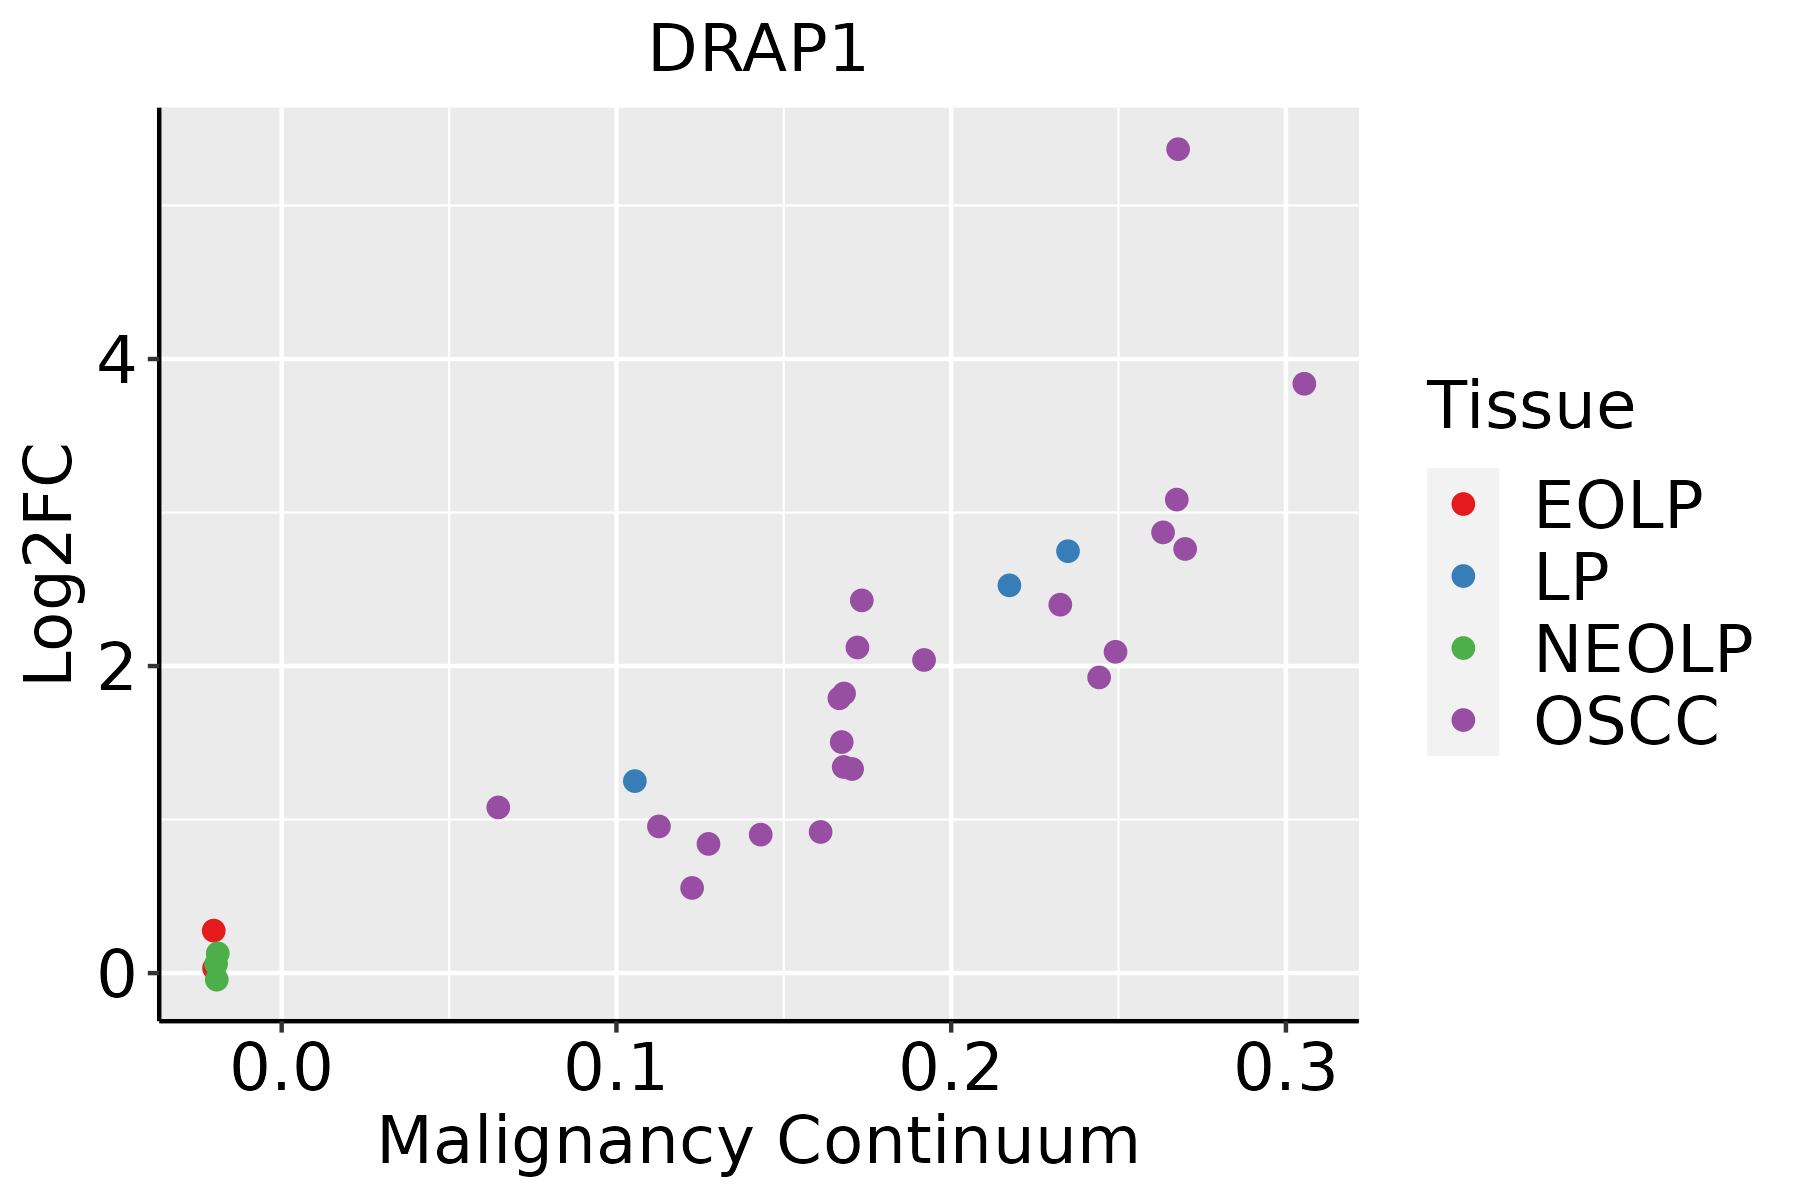 | EOLP: Erosive Oral lichen planus |
| LP: leukoplakia | ||
| NEOLP: Non-erosive oral lichen planus | ||
| OSCC: Oral squamous cell carcinoma | ||
| Prostate |  | BPH: Benign Prostatic Hyperplasia |
| Skin | 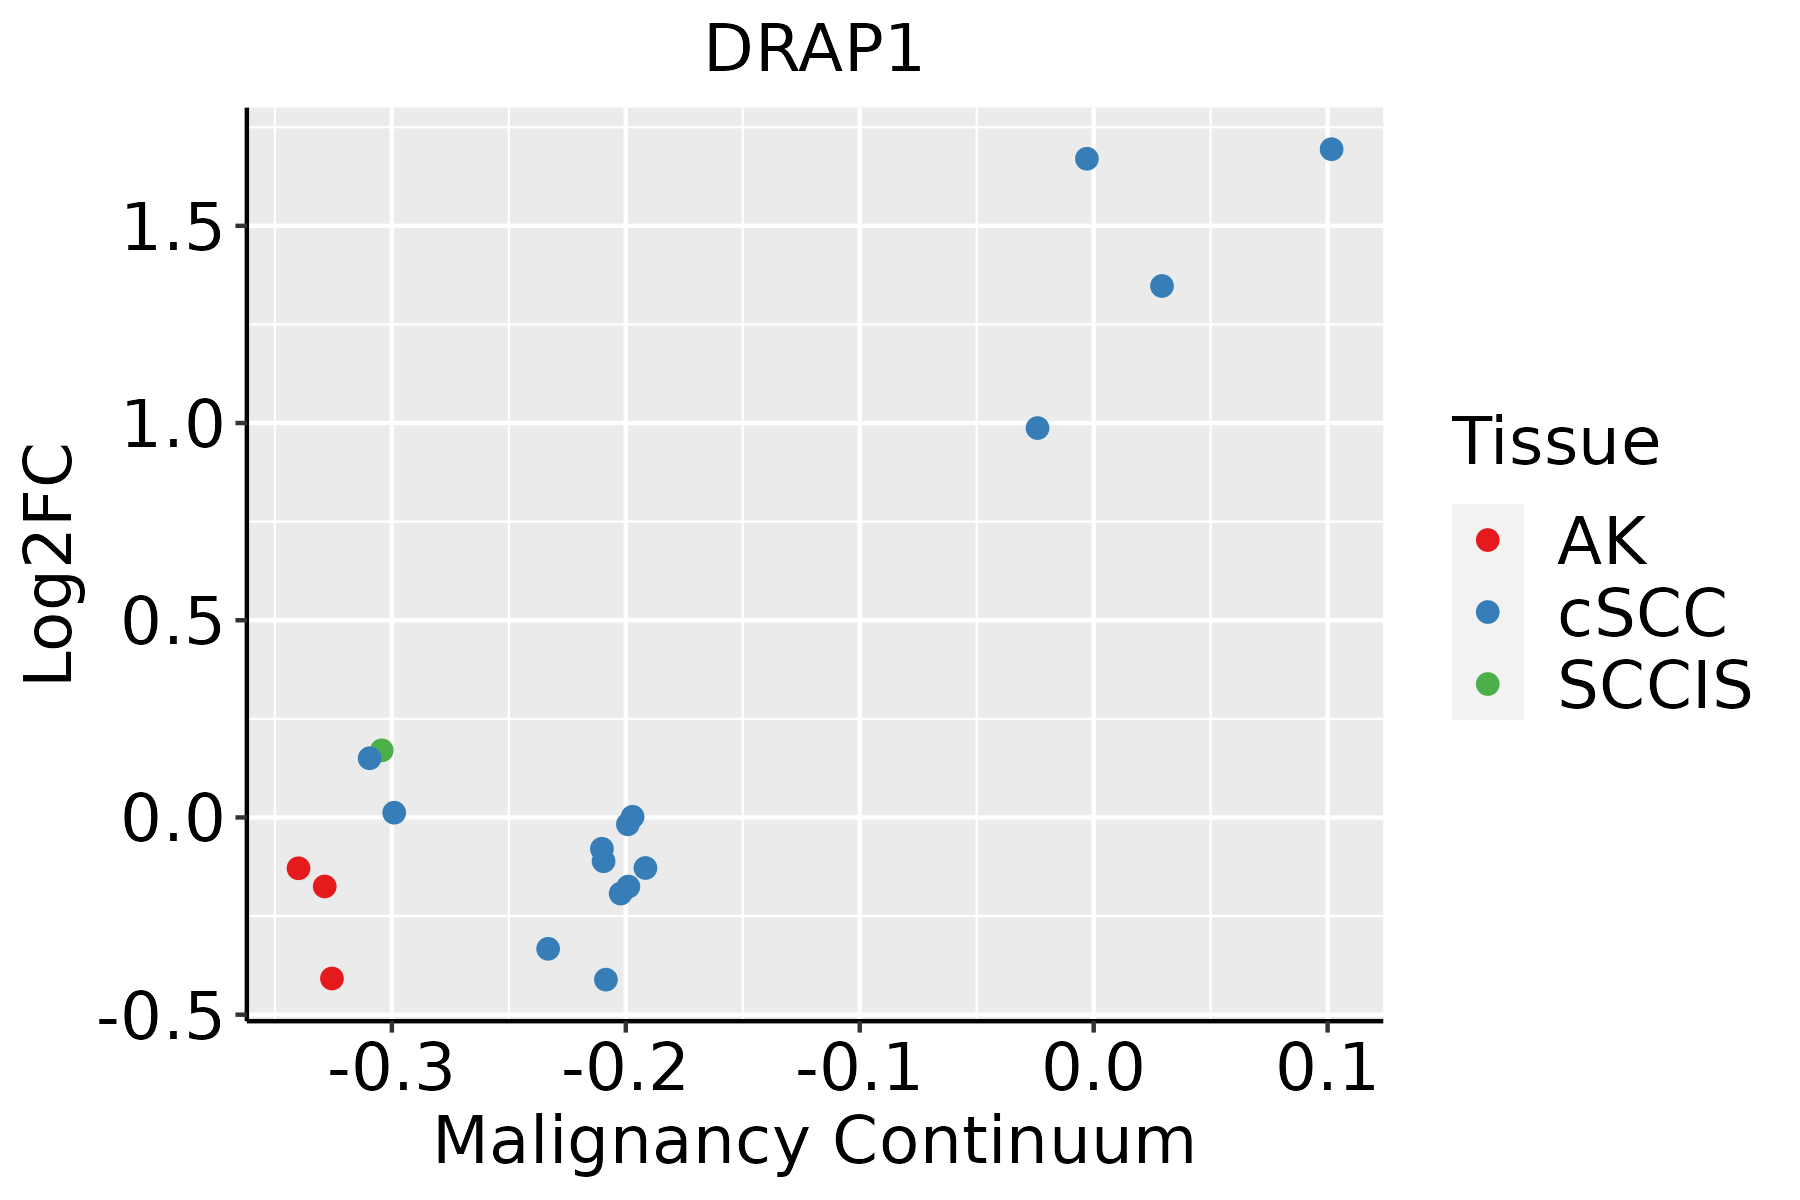 | AK: Actinic keratosis |
| cSCC: Cutaneous squamous cell carcinoma | ||
| SCCIS:squamous cell carcinoma in situ | ||
| Thyroid | 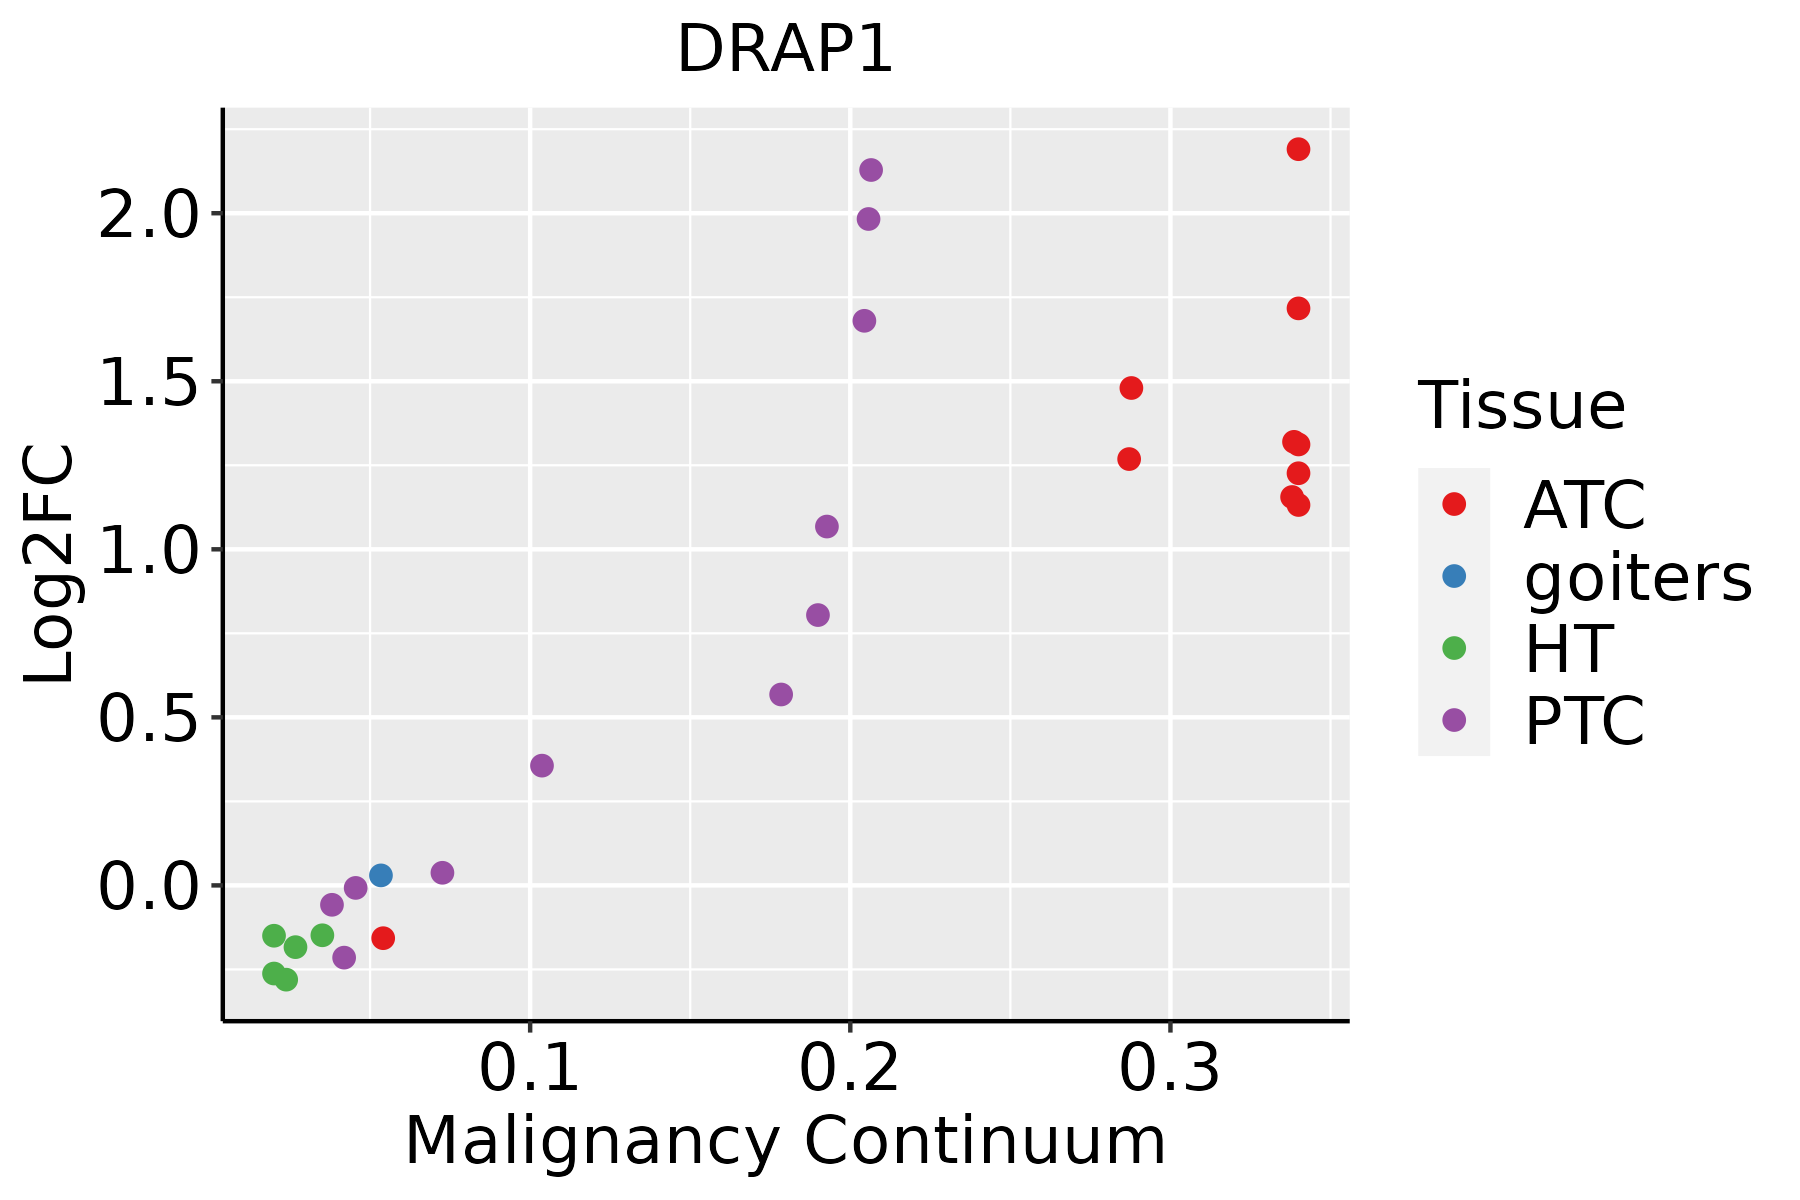 | ATC: Anaplastic thyroid cancer |
| HT: Hashimoto's thyroiditis | ||
| PTC: Papillary thyroid cancer |
| ∗log2FC in expression of this searched gene in stem-like cells from each diseased tissue sample relative to stem-like cells in normal samples in each tissue plotted against the malignancy continuum. Samples are colored based on if they are from different disease stage. |
Top |
Malignant transformation related pathway analysis |
| Find out the enriched GO biological processes and KEGG pathways involved in transition from healthy to precancer to cancer |
| Tissue | Disease Stage | Enriched GO biological Processes |
| Colorectum | AD |  |
| Colorectum | SER |  |
| Colorectum | MSS |  |
| Colorectum | MSI-H |  |
| Colorectum | FAP |  |
| ∗Top 15 enriched GO BP terms are showed in the bar plot of each disease state in each tissue. Each row represents a significant GO biological process which is colored according to the -log10(p.adjust). |
| Page: 1 2 3 4 5 6 7 8 9 |
| GO ID | Tissue | Disease Stage | Description | Gene Ratio | Bg Ratio | pvalue | p.adjust | Count |
| Page: 1 |
| Pathway ID | Tissue | Disease Stage | Description | Gene Ratio | Bg Ratio | pvalue | p.adjust | qvalue | Count |
| Page: 1 |
Top |
Cell-cell communication analysis |
| Identification of potential cell-cell interactions between two cell types and their ligand-receptor pairs for different disease states |
| Ligand | Receptor | LRpair | Pathway | Tissue | Disease Stage |
| Page: 1 |
Top |
Single-cell gene regulatory network inference analysis |
| Find out the significant the regulons (TFs) and the target genes of each regulon across cell types for different disease states |
| TF | Cell Type | Tissue | Disease Stage | Target Gene | RSS | Regulon Activity |
| ∗The dot plots of a searched regulon are shown for all cell subpopulations in each disease state of each tissue based on the regulon specific score inferred using pySCENIC and by calculating the average expression. |
| Page: 1 |
Top |
Somatic mutation of malignant transformation related genes |
| Annotation of somatic variants for genes involved in malignant transformation |
| Hugo Symbol | Variant Class | Variant Classification | dbSNP RS | HGVSc | HGVSp | HGVSp Short | SWISSPROT | BIOTYPE | SIFT | PolyPhen | Tumor Sample Barcode | Tissue | Histology | Sex | Age | Stage | Therapy Types | Drugs | Outcome |
| DRAP1 | SNV | Missense_Mutation | c.239T>A | p.Phe80Tyr | p.F80Y | Q14919 | protein_coding | deleterious(0.01) | possibly_damaging(0.804) | TCGA-OL-A66N-01 | Breast | breast invasive carcinoma | Female | <65 | III/IV | Unknown | Unknown | SD | |
| DRAP1 | SNV | Missense_Mutation | c.326N>A | p.Arg109His | p.R109H | Q14919 | protein_coding | tolerated(0.11) | benign(0.027) | TCGA-AA-3510-01 | Colorectum | colon adenocarcinoma | Male | >=65 | I/II | Unknown | Unknown | SD | |
| DRAP1 | SNV | Missense_Mutation | novel | c.8N>T | p.Ser3Ile | p.S3I | Q14919 | protein_coding | deleterious(0.03) | possibly_damaging(0.497) | TCGA-AA-A010-01 | Colorectum | colon adenocarcinoma | Female | <65 | I/II | Chemotherapy | folinic | CR |
| DRAP1 | SNV | Missense_Mutation | c.179N>A | p.Arg60Gln | p.R60Q | Q14919 | protein_coding | deleterious(0) | probably_damaging(0.932) | TCGA-AD-6889-01 | Colorectum | colon adenocarcinoma | Male | >=65 | I/II | Chemotherapy | xeloda | PD | |
| DRAP1 | SNV | Missense_Mutation | rs781734189 | c.598G>A | p.Glu200Lys | p.E200K | Q14919 | protein_coding | deleterious_low_confidence(0.01) | benign(0.269) | TCGA-AZ-4315-01 | Colorectum | colon adenocarcinoma | Male | <65 | I/II | Unknown | Unknown | SD |
| DRAP1 | SNV | Missense_Mutation | rs143922438 | c.580G>A | p.Ala194Thr | p.A194T | Q14919 | protein_coding | tolerated_low_confidence(0.15) | benign(0.11) | TCGA-EI-6507-01 | Colorectum | rectum adenocarcinoma | Male | <65 | I/II | Unknown | Unknown | SD |
| DRAP1 | insertion | Frame_Shift_Ins | rs751570365 | c.513-1_513insC | p.Thr174AspfsTer23 | p.T174Dfs*23 | Q14919 | protein_coding | TCGA-A6-6780-01 | Colorectum | colon adenocarcinoma | Male | >=65 | I/II | Unknown | Unknown | SD | ||
| DRAP1 | SNV | Missense_Mutation | c.266C>A | p.Ser89Tyr | p.S89Y | Q14919 | protein_coding | deleterious(0) | possibly_damaging(0.79) | TCGA-AP-A0LM-01 | Endometrium | uterine corpus endometrioid carcinoma | Female | <65 | III/IV | Chemotherapy | cisplatin | SD | |
| DRAP1 | SNV | Missense_Mutation | rs777331540 | c.538G>A | p.Ala180Thr | p.A180T | Q14919 | protein_coding | tolerated_low_confidence(0.65) | benign(0) | TCGA-AP-A0LM-01 | Endometrium | uterine corpus endometrioid carcinoma | Female | <65 | III/IV | Chemotherapy | cisplatin | SD |
| DRAP1 | SNV | Missense_Mutation | rs777331540 | c.538G>A | p.Ala180Thr | p.A180T | Q14919 | protein_coding | tolerated_low_confidence(0.65) | benign(0) | TCGA-AX-A0J1-01 | Endometrium | uterine corpus endometrioid carcinoma | Female | >=65 | I/II | Unknown | Unknown | SD |
| Page: 1 2 |
Top |
Related drugs of malignant transformation related genes |
| Identification of chemicals and drugs interact with genes involved in malignant transfromation |
| (DGIdb 4.0) |
| Entrez ID | Symbol | Category | Interaction Types | Drug Claim Name | Drug Name | PMIDs |
| Page: 1 |

Copyright 2023-Present -The University of Texas Health Science Center at Houston |