
|
|||||
|
 | |
| |
| |
| |
| |
| |
|
Gene: DRAM2 |
Gene summary for DRAM2 |
| Gene information | Species | Human | Gene symbol | DRAM2 | Gene ID | 128338 |
| Gene name | DNA damage regulated autophagy modulator 2 | |
| Gene Alias | CORD21 | |
| Cytomap | 1p13.3 | |
| Gene Type | protein-coding | GO ID | GO:0001894 | UniProtAcc | A0A024R0B7 |
Top |
Malignant transformation analysis |
| Identification of the aberrant gene expression in precancerous and cancerous lesions by comparing the gene expression of stem-like cells in diseased tissues with normal stem cells |
| Entrez ID | Symbol | Replicates | Species | Organ | Tissue | Adj P-value | Log2FC | Malignancy |
| 128338 | DRAM2 | LZE4T | Human | Esophagus | ESCC | 5.24e-11 | 3.15e-01 | 0.0811 |
| 128338 | DRAM2 | LZE7T | Human | Esophagus | ESCC | 6.00e-04 | 3.99e-01 | 0.0667 |
| 128338 | DRAM2 | LZE8T | Human | Esophagus | ESCC | 5.20e-04 | 6.05e-02 | 0.067 |
| 128338 | DRAM2 | LZE20T | Human | Esophagus | ESCC | 3.82e-04 | 2.10e-01 | 0.0662 |
| 128338 | DRAM2 | LZE22T | Human | Esophagus | ESCC | 3.95e-02 | 2.38e-01 | 0.068 |
| 128338 | DRAM2 | LZE24T | Human | Esophagus | ESCC | 1.48e-22 | 5.38e-01 | 0.0596 |
| 128338 | DRAM2 | LZE21T | Human | Esophagus | ESCC | 4.97e-03 | 7.93e-02 | 0.0655 |
| 128338 | DRAM2 | P1T-E | Human | Esophagus | ESCC | 1.87e-02 | 4.19e-01 | 0.0875 |
| 128338 | DRAM2 | P2T-E | Human | Esophagus | ESCC | 8.54e-23 | 4.81e-01 | 0.1177 |
| 128338 | DRAM2 | P4T-E | Human | Esophagus | ESCC | 1.39e-25 | 5.77e-01 | 0.1323 |
| 128338 | DRAM2 | P5T-E | Human | Esophagus | ESCC | 1.49e-14 | 1.92e-01 | 0.1327 |
| 128338 | DRAM2 | P8T-E | Human | Esophagus | ESCC | 3.64e-26 | 4.65e-01 | 0.0889 |
| 128338 | DRAM2 | P9T-E | Human | Esophagus | ESCC | 1.25e-16 | 3.86e-01 | 0.1131 |
| 128338 | DRAM2 | P10T-E | Human | Esophagus | ESCC | 1.50e-25 | 5.65e-01 | 0.116 |
| 128338 | DRAM2 | P11T-E | Human | Esophagus | ESCC | 9.26e-07 | 2.90e-01 | 0.1426 |
| 128338 | DRAM2 | P12T-E | Human | Esophagus | ESCC | 1.91e-71 | 1.56e+00 | 0.1122 |
| 128338 | DRAM2 | P15T-E | Human | Esophagus | ESCC | 8.36e-22 | 3.88e-01 | 0.1149 |
| 128338 | DRAM2 | P16T-E | Human | Esophagus | ESCC | 2.03e-14 | 2.44e-01 | 0.1153 |
| 128338 | DRAM2 | P17T-E | Human | Esophagus | ESCC | 1.13e-03 | 1.93e-01 | 0.1278 |
| 128338 | DRAM2 | P19T-E | Human | Esophagus | ESCC | 6.32e-06 | 3.12e-01 | 0.1662 |
| Page: 1 2 3 4 5 6 |
| Tissue | Expression Dynamics | Abbreviation |
| Esophagus |  | ESCC: Esophageal squamous cell carcinoma |
| HGIN: High-grade intraepithelial neoplasias | ||
| LGIN: Low-grade intraepithelial neoplasias | ||
| Liver | 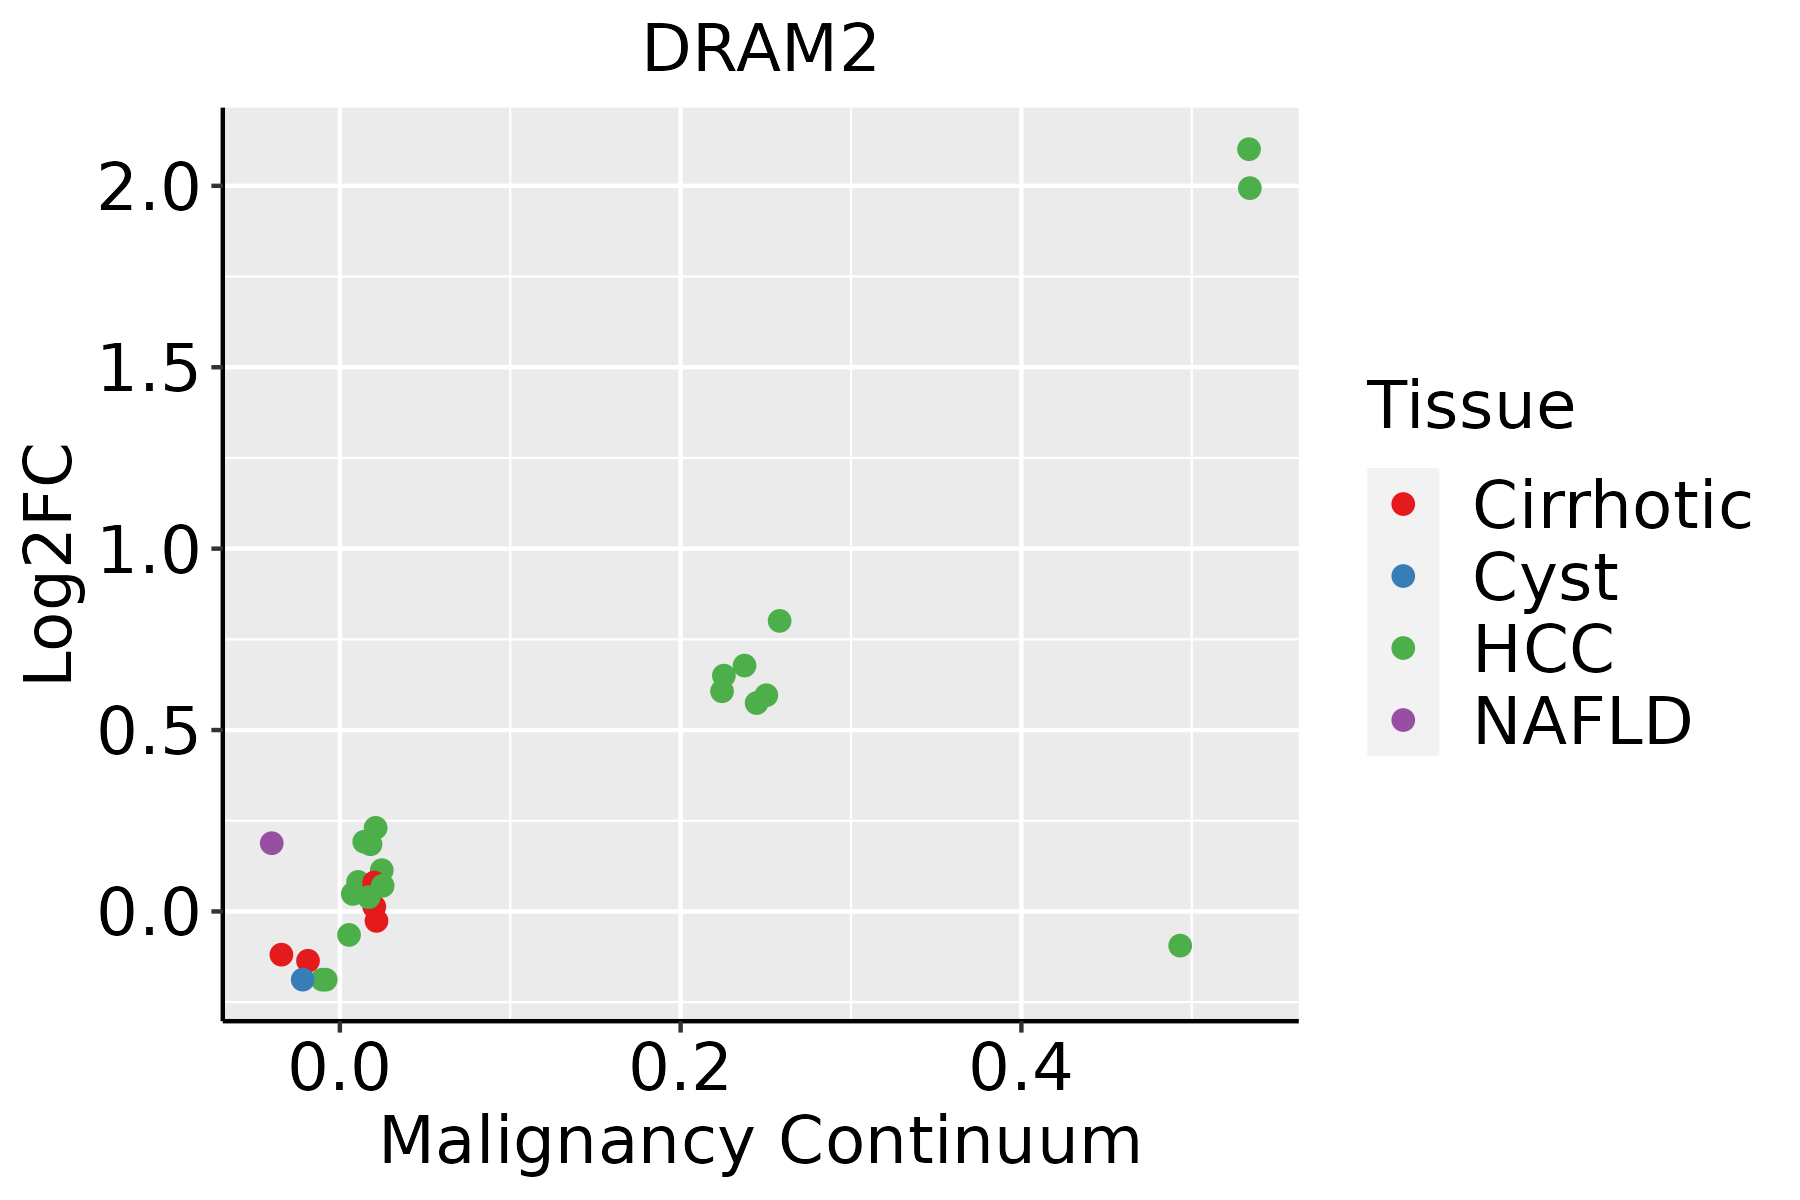 | HCC: Hepatocellular carcinoma |
| NAFLD: Non-alcoholic fatty liver disease | ||
| Oral Cavity |  | EOLP: Erosive Oral lichen planus |
| LP: leukoplakia | ||
| NEOLP: Non-erosive oral lichen planus | ||
| OSCC: Oral squamous cell carcinoma | ||
| Skin | 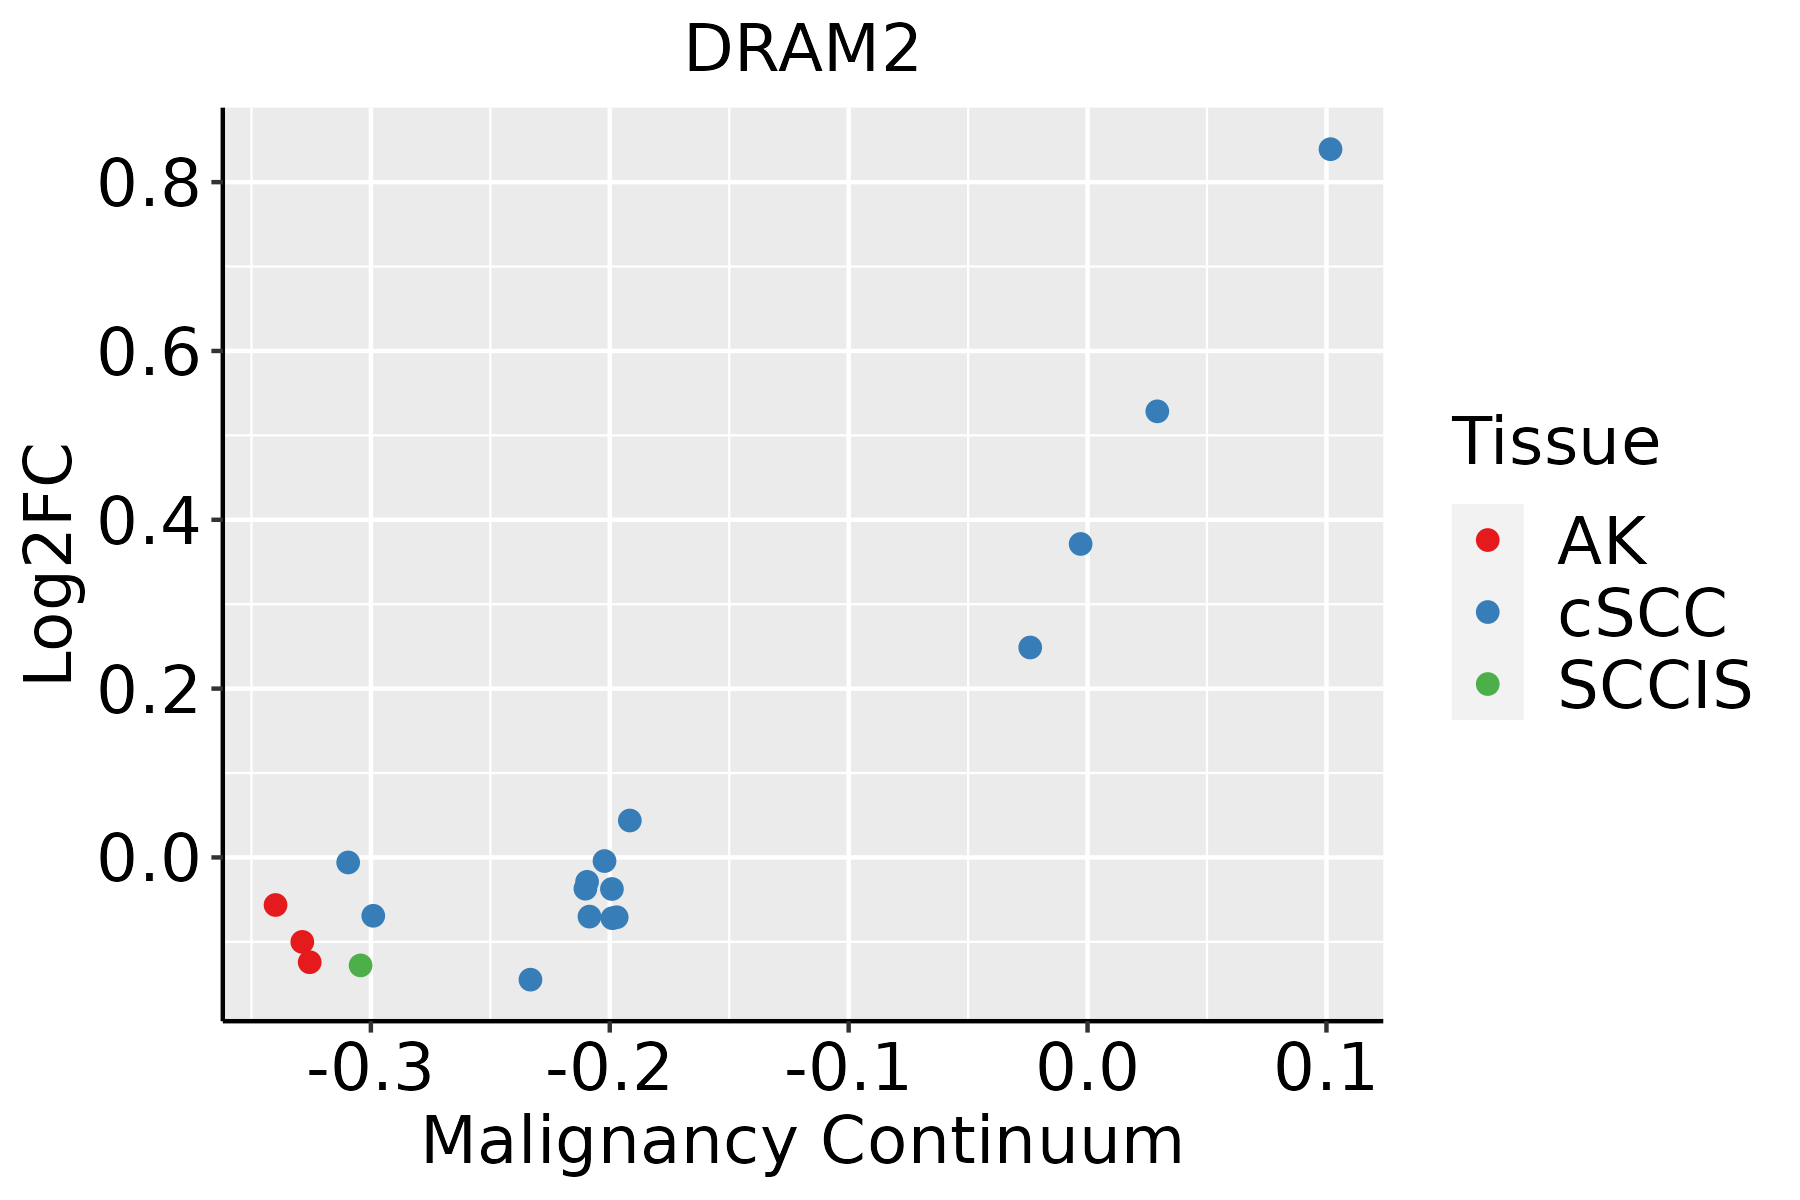 | AK: Actinic keratosis |
| cSCC: Cutaneous squamous cell carcinoma | ||
| SCCIS:squamous cell carcinoma in situ |
| ∗log2FC in expression of this searched gene in stem-like cells from each diseased tissue sample relative to stem-like cells in normal samples in each tissue plotted against the malignancy continuum. Samples are colored based on if they are from different disease stage. |
Top |
Malignant transformation related pathway analysis |
| Find out the enriched GO biological processes and KEGG pathways involved in transition from healthy to precancer to cancer |
| Tissue | Disease Stage | Enriched GO biological Processes |
| Colorectum | AD |  |
| Colorectum | SER |  |
| Colorectum | MSS |  |
| Colorectum | MSI-H |  |
| Colorectum | FAP |  |
| ∗Top 15 enriched GO BP terms are showed in the bar plot of each disease state in each tissue. Each row represents a significant GO biological process which is colored according to the -log10(p.adjust). |
| Page: 1 2 3 4 5 6 7 8 9 |
| GO ID | Tissue | Disease Stage | Description | Gene Ratio | Bg Ratio | pvalue | p.adjust | Count |
| GO:001050617 | Esophagus | ESCC | regulation of autophagy | 220/8552 | 317/18723 | 6.72e-18 | 6.36e-16 | 220 |
| GO:001050611 | Liver | Cirrhotic | regulation of autophagy | 132/4634 | 317/18723 | 2.17e-11 | 1.33e-09 | 132 |
| GO:001050621 | Liver | HCC | regulation of autophagy | 210/7958 | 317/18723 | 7.59e-18 | 8.45e-16 | 210 |
| GO:001050610 | Oral cavity | OSCC | regulation of autophagy | 198/7305 | 317/18723 | 1.63e-17 | 1.51e-15 | 198 |
| GO:001050615 | Oral cavity | LP | regulation of autophagy | 132/4623 | 317/18723 | 1.82e-11 | 1.28e-09 | 132 |
| GO:001050619 | Skin | cSCC | regulation of autophagy | 127/4864 | 317/18723 | 2.36e-08 | 6.71e-07 | 127 |
| Page: 1 |
| Pathway ID | Tissue | Disease Stage | Description | Gene Ratio | Bg Ratio | pvalue | p.adjust | qvalue | Count |
| Page: 1 |
Top |
Cell-cell communication analysis |
| Identification of potential cell-cell interactions between two cell types and their ligand-receptor pairs for different disease states |
| Ligand | Receptor | LRpair | Pathway | Tissue | Disease Stage |
| Page: 1 |
Top |
Single-cell gene regulatory network inference analysis |
| Find out the significant the regulons (TFs) and the target genes of each regulon across cell types for different disease states |
| TF | Cell Type | Tissue | Disease Stage | Target Gene | RSS | Regulon Activity |
| ∗The dot plots of a searched regulon are shown for all cell subpopulations in each disease state of each tissue based on the regulon specific score inferred using pySCENIC and by calculating the average expression. |
| Page: 1 |
Top |
Somatic mutation of malignant transformation related genes |
| Annotation of somatic variants for genes involved in malignant transformation |
| Hugo Symbol | Variant Class | Variant Classification | dbSNP RS | HGVSc | HGVSp | HGVSp Short | SWISSPROT | BIOTYPE | SIFT | PolyPhen | Tumor Sample Barcode | Tissue | Histology | Sex | Age | Stage | Therapy Types | Drugs | Outcome |
| DRAM2 | SNV | Missense_Mutation | novel | c.145G>A | p.Val49Ile | p.V49I | Q6UX65 | protein_coding | tolerated(0.67) | benign(0.003) | TCGA-2W-A8YY-01 | Cervix | cervical & endocervical cancer | Female | <65 | I/II | Chemotherapy | cisplatin | CR |
| DRAM2 | SNV | Missense_Mutation | rs774377749 | c.328N>A | p.Ala110Thr | p.A110T | Q6UX65 | protein_coding | deleterious(0.04) | probably_damaging(0.999) | TCGA-5M-AAT6-01 | Colorectum | colon adenocarcinoma | Female | <65 | III/IV | Unknown | Unknown | PD |
| DRAM2 | SNV | Missense_Mutation | rs145044841 | c.188C>T | p.Ala63Val | p.A63V | Q6UX65 | protein_coding | deleterious(0.03) | benign(0.251) | TCGA-AA-3494-01 | Colorectum | colon adenocarcinoma | Male | <65 | III/IV | Chemotherapy | folinic | PR |
| DRAM2 | SNV | Missense_Mutation | c.701C>A | p.Ser234Tyr | p.S234Y | Q6UX65 | protein_coding | deleterious(0.04) | benign(0.003) | TCGA-AA-3510-01 | Colorectum | colon adenocarcinoma | Male | >=65 | I/II | Unknown | Unknown | SD | |
| DRAM2 | SNV | Missense_Mutation | novel | c.781N>A | p.Leu261Ile | p.L261I | Q6UX65 | protein_coding | deleterious(0.04) | benign(0.005) | TCGA-AA-3947-01 | Colorectum | colon adenocarcinoma | Female | <65 | I/II | Unknown | Unknown | SD |
| DRAM2 | SNV | Missense_Mutation | novel | c.374N>T | p.Ala125Val | p.A125V | Q6UX65 | protein_coding | deleterious(0) | probably_damaging(0.932) | TCGA-AA-3950-01 | Colorectum | colon adenocarcinoma | Female | >=65 | I/II | Unknown | Unknown | SD |
| DRAM2 | SNV | Missense_Mutation | c.779N>A | p.Arg260Gln | p.R260Q | Q6UX65 | protein_coding | tolerated(0.61) | benign(0) | TCGA-AA-A01R-01 | Colorectum | colon adenocarcinoma | Male | <65 | III/IV | Chemotherapy | 5-fluorouracil | PD | |
| DRAM2 | SNV | Missense_Mutation | c.157N>G | p.Lys53Glu | p.K53E | Q6UX65 | protein_coding | deleterious(0.03) | benign(0.119) | TCGA-AG-A026-01 | Colorectum | rectum adenocarcinoma | Male | >=65 | I/II | Unknown | Unknown | PD | |
| DRAM2 | deletion | Frame_Shift_Del | c.84delN | p.Thr29LeufsTer3 | p.T29Lfs*3 | Q6UX65 | protein_coding | TCGA-AA-3667-01 | Colorectum | colon adenocarcinoma | Female | <65 | I/II | Unknown | Unknown | SD | |||
| DRAM2 | SNV | Missense_Mutation | rs759094596 | c.221N>A | p.Arg74His | p.R74H | Q6UX65 | protein_coding | deleterious(0.02) | probably_damaging(1) | TCGA-AJ-A3EL-01 | Endometrium | uterine corpus endometrioid carcinoma | Female | <65 | I/II | Unknown | Unknown | SD |
| Page: 1 2 3 |
Top |
Related drugs of malignant transformation related genes |
| Identification of chemicals and drugs interact with genes involved in malignant transfromation |
| (DGIdb 4.0) |
| Entrez ID | Symbol | Category | Interaction Types | Drug Claim Name | Drug Name | PMIDs |
| Page: 1 |

Copyright 2023-Present -The University of Texas Health Science Center at Houston |