Schematic overview of the cellular and molecular mechanisms involved in the cancer progression, including the proposed cellular and molecular mechanisms in cancer cells trajectory. AT1: alveolar type 1 cells; AT2: alveolar type 2 cells; AAH: atypical adenomatous hyperplasia; AIS: adenocarcinoma in situ; MIA: minimally invasive adenocarcinoma; IA: invasive adenocarcinoma; EMT: epithelial-mesenchymal transition

Home

Download

Statistics

Help

Contact

Center for Computational Systems Medicine
leaf

Gene summary

leaf

Malignant transformation analysis

leaf

Malignant transformation related pathway analysis

leaf

Cell-cell communication analysis

leaf

Single-cell gene regulatory network inference analysis

leaf

Somatic mutation of malignant transformation related genes

leaf

Related drugs of malignant transformation related genes

Gene: DR1

Gene summary for DR1

check button Gene summary.

Gene informationSpeciesHuman
Gene symbol

DR1

Gene ID

1810

Gene namedown-regulator of transcription 1
Gene AliasNC2
Cytomap1p22.1
Gene Typeprotein-coding
GO ID

GO:0000122

UniProtAcc

Q01658


Top

Malignant transformation analysis

check button Identification of the aberrant gene expression in precancerous and cancerous lesions by comparing the gene expression of stem-like cells in diseased tissues with normal stem cells
check button Malignant transformation involving gene list.
Entrez IDSymbolReplicatesSpeciesOrganTissueAdj P-valueLog2FCMalignancy
1810DR1LZE4THumanEsophagusESCC1.67e-111.98e-010.0811
1810DR1LZE5THumanEsophagusESCC7.01e-041.10e-010.0514
1810DR1LZE8THumanEsophagusESCC1.60e-02-8.08e-020.067
1810DR1LZE20THumanEsophagusESCC4.18e-071.65e-010.0662
1810DR1LZE22THumanEsophagusESCC2.43e-032.40e-010.068
1810DR1LZE24THumanEsophagusESCC2.94e-104.24e-010.0596
1810DR1P2T-EHumanEsophagusESCC7.94e-366.94e-010.1177
1810DR1P4T-EHumanEsophagusESCC4.76e-233.55e-010.1323
1810DR1P5T-EHumanEsophagusESCC4.54e-266.38e-010.1327
1810DR1P8T-EHumanEsophagusESCC1.15e-223.52e-010.0889
1810DR1P9T-EHumanEsophagusESCC2.00e-162.70e-010.1131
1810DR1P10T-EHumanEsophagusESCC1.51e-367.30e-010.116
1810DR1P11T-EHumanEsophagusESCC2.61e-115.52e-010.1426
1810DR1P12T-EHumanEsophagusESCC1.79e-842.02e+000.1122
1810DR1P15T-EHumanEsophagusESCC4.18e-266.79e-010.1149
1810DR1P16T-EHumanEsophagusESCC3.22e-272.94e-010.1153
1810DR1P17T-EHumanEsophagusESCC3.09e-054.32e-010.1278
1810DR1P19T-EHumanEsophagusESCC1.27e-068.87e-010.1662
1810DR1P20T-EHumanEsophagusESCC6.66e-287.21e-010.1124
1810DR1P21T-EHumanEsophagusESCC1.01e-201.98e-010.1617
Page: 1 2 3 4 5 6 

check button Transcriptomic changes along malignancy continuum.
TissueExpression DynamicsAbbreviation
EsophagusThe image shows the transcriptomic changes along malignancy continuum.log2FC in expression of this searched gene in stem-like cells from each diseased tissue sample relative to stem-like cells in normal samples in each tissue plotted against the malignancy continuum. Samples are colored based on if they are from different disease stage.ESCC: Esophageal squamous cell carcinoma
HGIN: High-grade intraepithelial neoplasias
LGIN: Low-grade intraepithelial neoplasias
LiverThe image shows the transcriptomic changes along malignancy continuum.log2FC in expression of this searched gene in stem-like cells from each diseased tissue sample relative to stem-like cells in normal samples in each tissue plotted against the malignancy continuum. Samples are colored based on if they are from different disease stage.
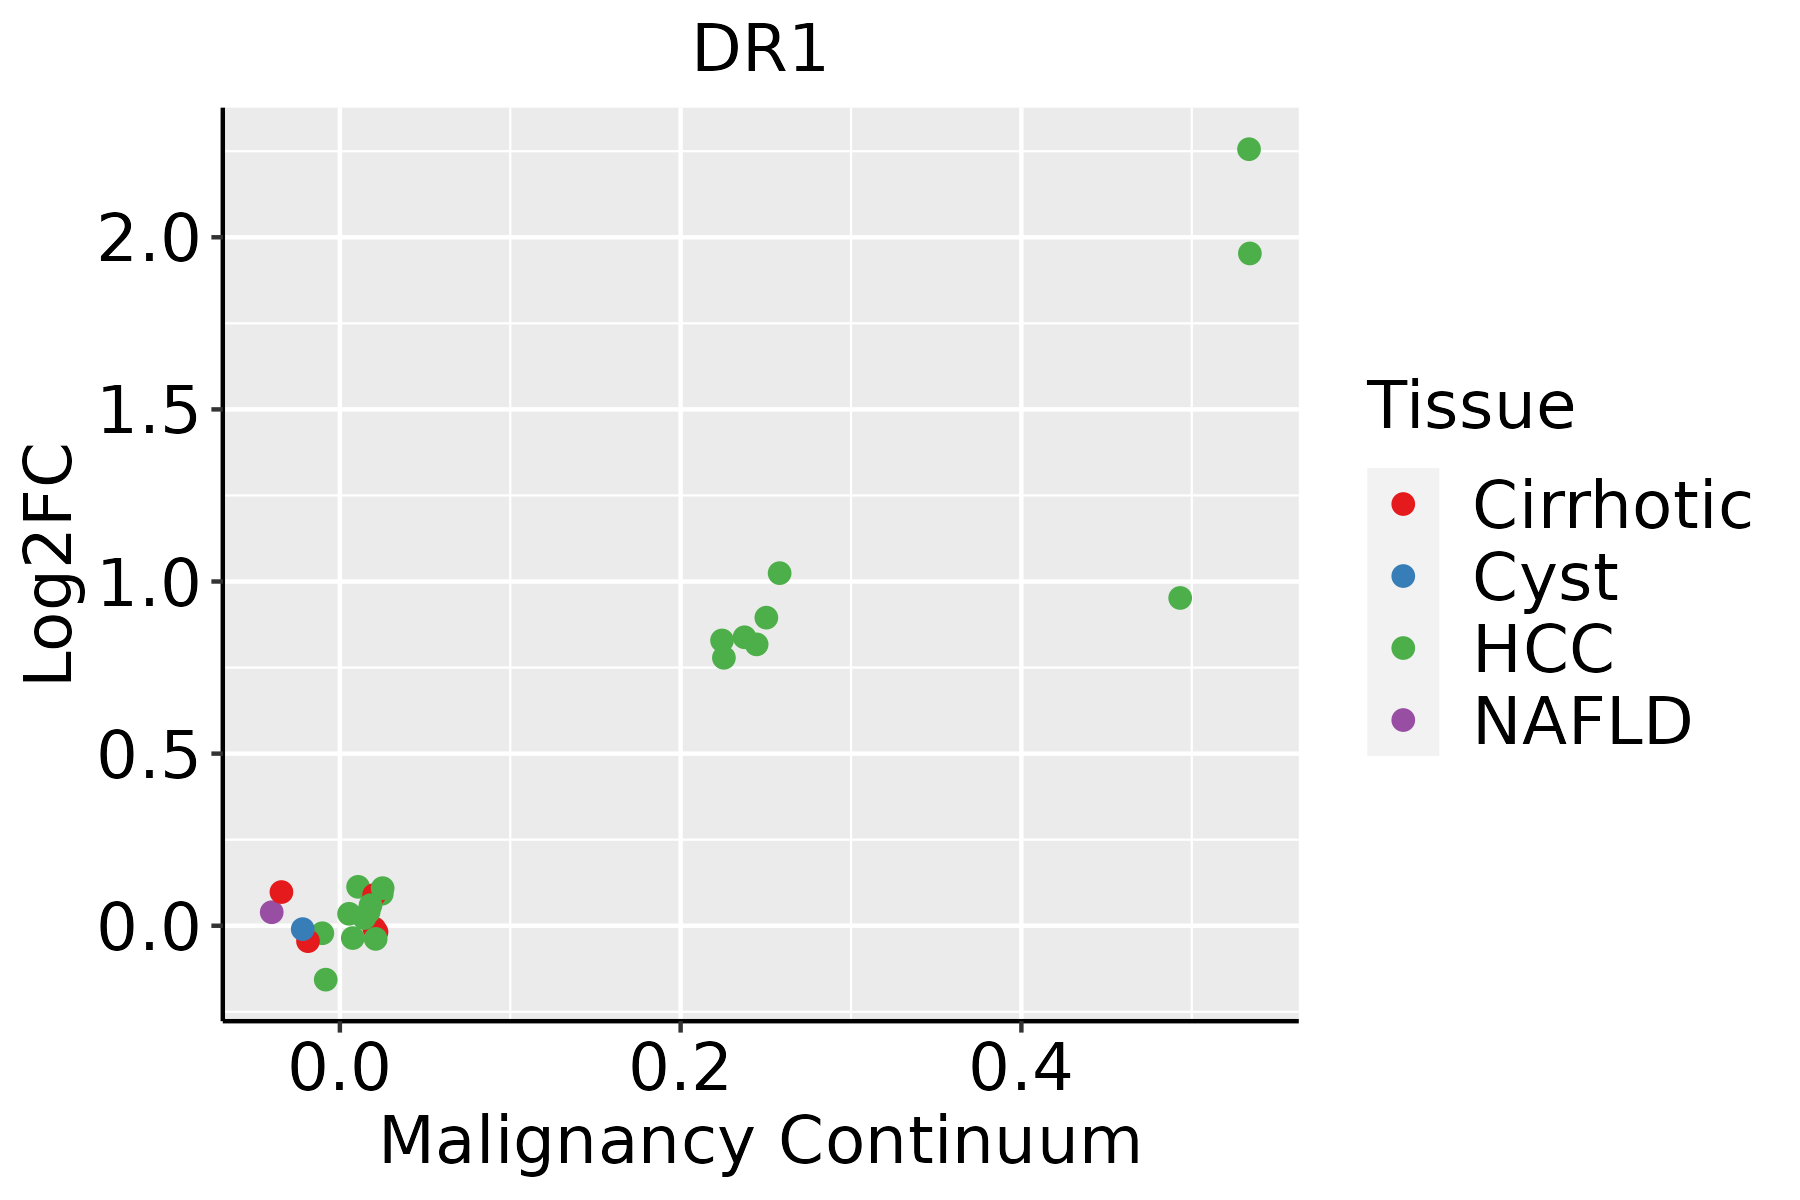
HCC: Hepatocellular carcinoma
NAFLD: Non-alcoholic fatty liver disease
Oral CavityThe image shows the transcriptomic changes along malignancy continuum.log2FC in expression of this searched gene in stem-like cells from each diseased tissue sample relative to stem-like cells in normal samples in each tissue plotted against the malignancy continuum. Samples are colored based on if they are from different disease stage.EOLP: Erosive Oral lichen planus
LP: leukoplakia
NEOLP: Non-erosive oral lichen planus
OSCC: Oral squamous cell carcinoma
SkinThe image shows the transcriptomic changes along malignancy continuum.log2FC in expression of this searched gene in stem-like cells from each diseased tissue sample relative to stem-like cells in normal samples in each tissue plotted against the malignancy continuum. Samples are colored based on if they are from different disease stage.
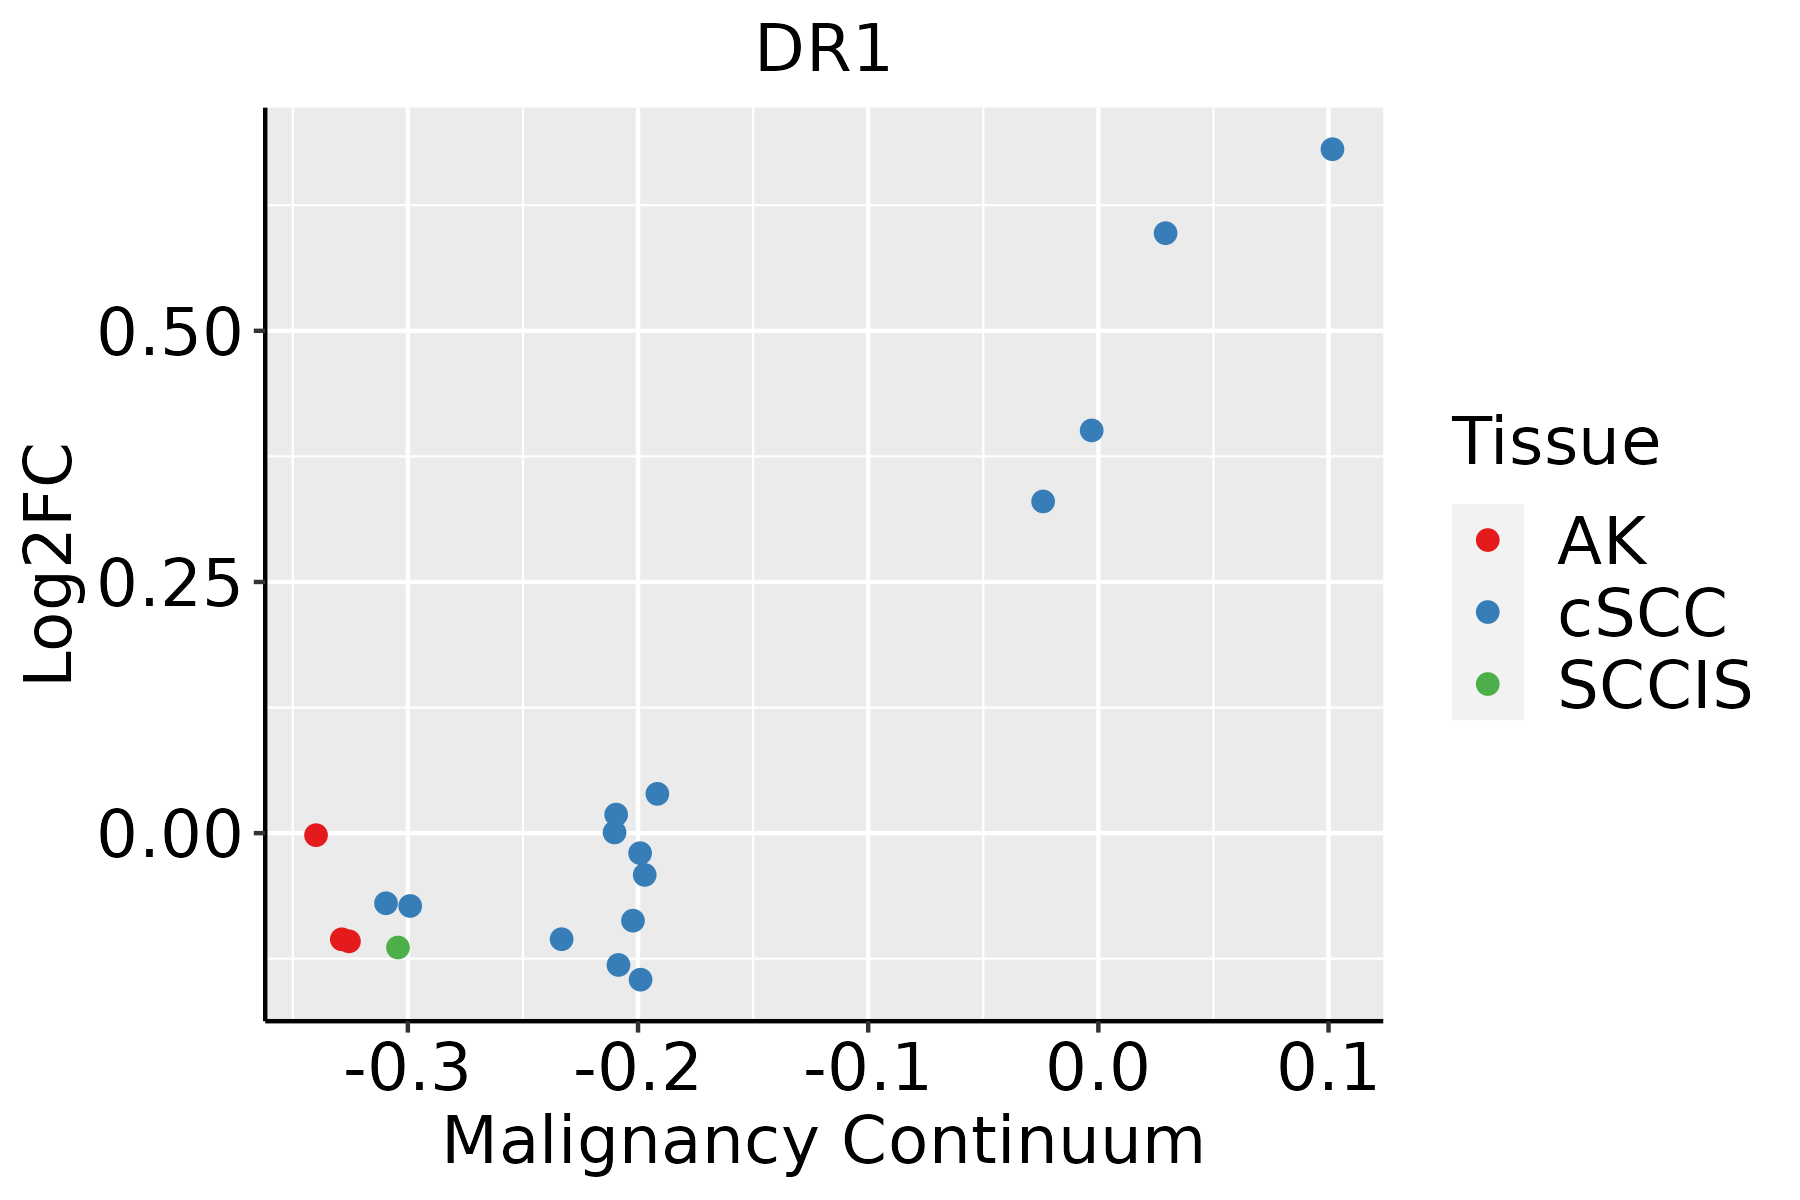
AK: Actinic keratosis
cSCC: Cutaneous squamous cell carcinoma
SCCIS:squamous cell carcinoma in situ
ThyroidThe image shows the transcriptomic changes along malignancy continuum.log2FC in expression of this searched gene in stem-like cells from each diseased tissue sample relative to stem-like cells in normal samples in each tissue plotted against the malignancy continuum. Samples are colored based on if they are from different disease stage.
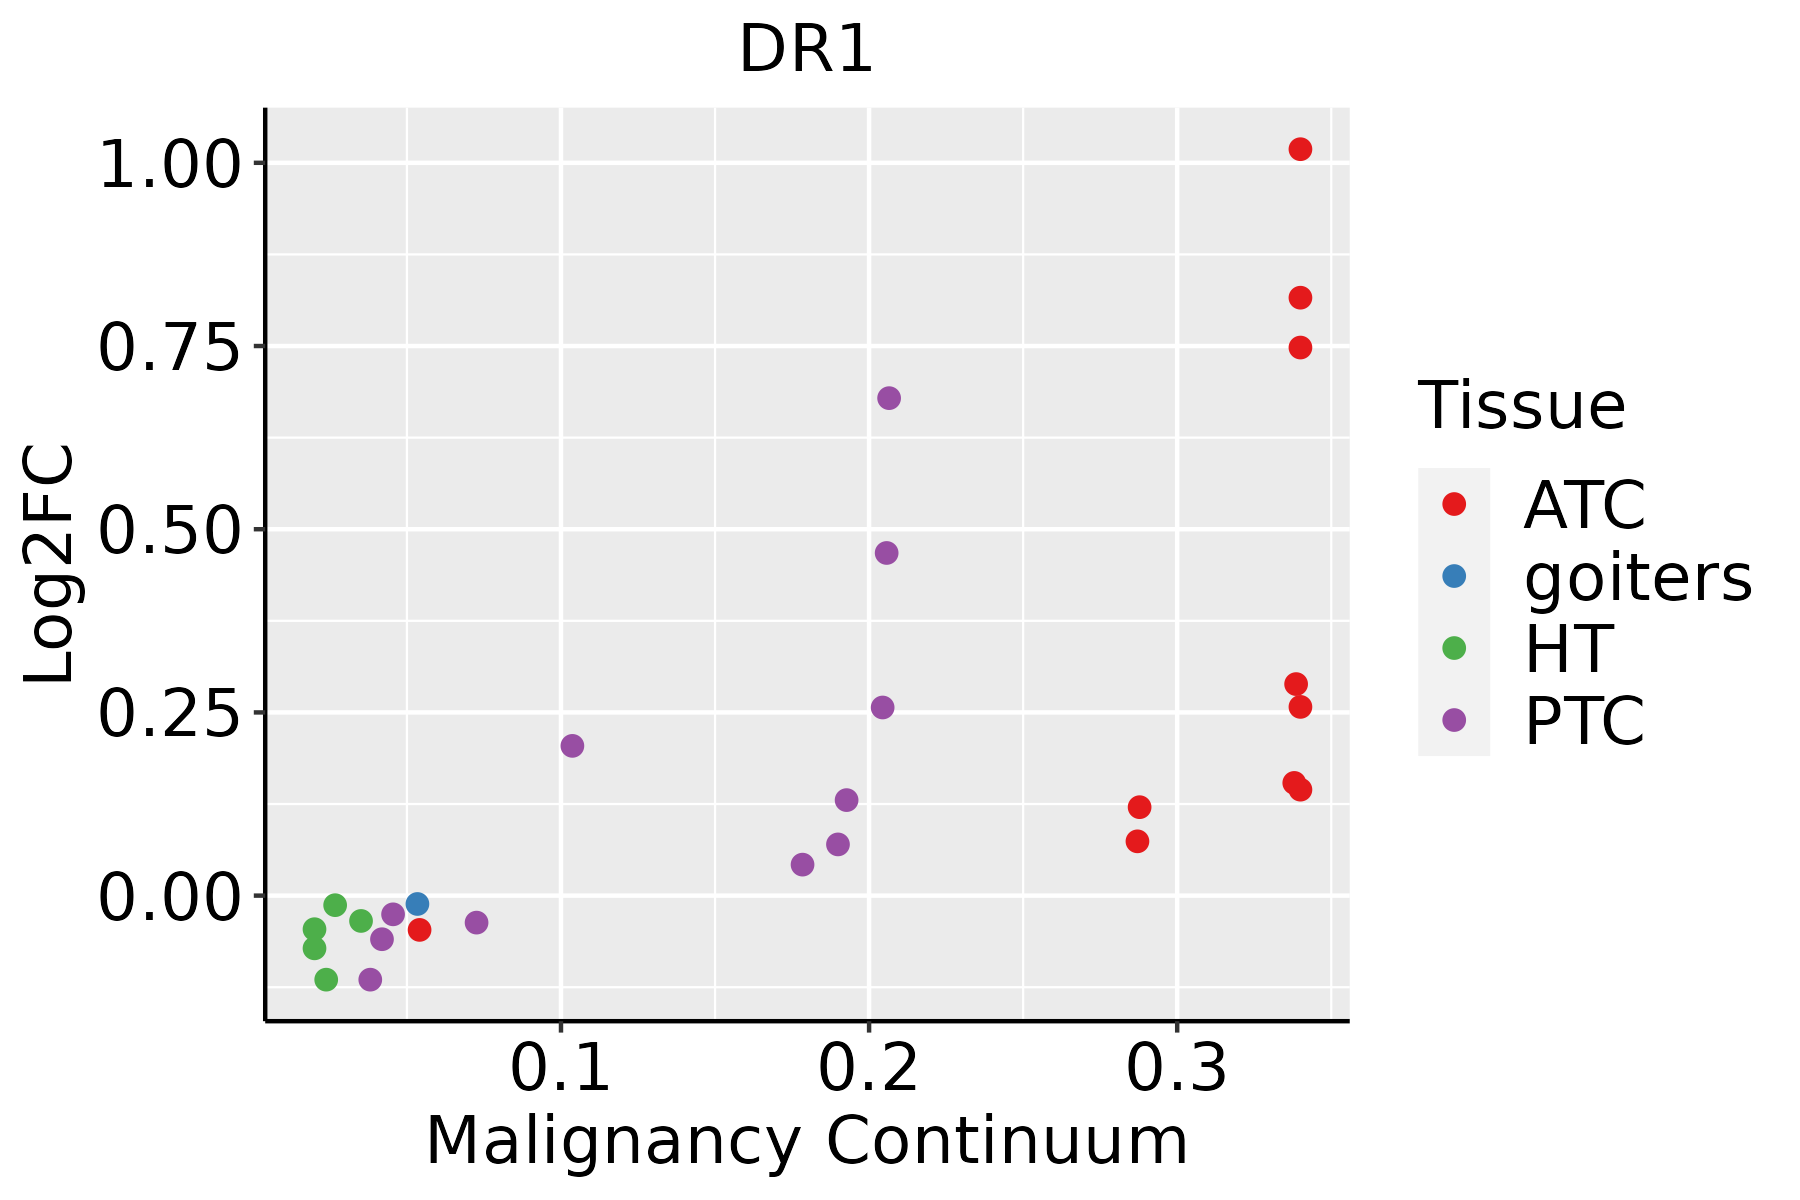
ATC: Anaplastic thyroid cancer
HT: Hashimoto's thyroiditis
PTC: Papillary thyroid cancer
∗log2FC in expression of this searched gene in stem-like cells from each diseased tissue sample relative to stem-like cells in normal samples in each tissue plotted against the malignancy continuum. Samples are colored based on if they are from different disease stage.

Top

Malignant transformation related pathway analysis

check buttonFind out the enriched GO biological processes and KEGG pathways involved in transition from healthy to precancer to cancer
check button Figure of enriched GO biological processes.
TissueDisease StageEnriched GO biological Processes
ColorectumADGO analysis - Figure of enriched GO biological processes: Top 15 enriched GO BP terms are showed in the bar plot of each disease state in each tissue. Each row represents a significant GO biological process which is colored according to the -log10(p.adjust).
ColorectumSERGO analysis - Figure of enriched GO biological processes: Top 15 enriched GO BP terms are showed in the bar plot of each disease state in each tissue. Each row represents a significant GO biological process which is colored according to the -log10(p.adjust).
ColorectumMSSGO analysis - Figure of enriched GO biological processes: Top 15 enriched GO BP terms are showed in the bar plot of each disease state in each tissue. Each row represents a significant GO biological process which is colored according to the -log10(p.adjust).
ColorectumMSI-HGO analysis - Figure of enriched GO biological processes: Top 15 enriched GO BP terms are showed in the bar plot of each disease state in each tissue. Each row represents a significant GO biological process which is colored according to the -log10(p.adjust).
ColorectumFAPGO analysis - Figure of enriched GO biological processes: Top 15 enriched GO BP terms are showed in the bar plot of each disease state in each tissue. Each row represents a significant GO biological process which is colored according to the -log10(p.adjust).
∗Top 15 enriched GO BP terms are showed in the bar plot of each disease state in each tissue. Each row represents a significant GO biological process which is colored according to the -log10(p.adjust).
Page: 1 2 3 4 5 6 7 8 9 

check button Enriched GO biological processes.
GO IDTissueDisease StageDescriptionGene RatioBg Ratiopvaluep.adjustCount
GO:0007015ColorectumADactin filament organization167/3918442/187231.65e-167.94e-14167
GO:0032535ColorectumADregulation of cellular component size142/3918383/187231.74e-133.41e-11142
GO:1902903ColorectumADregulation of supramolecular fiber organization139/3918383/187232.01e-123.19e-10139
GO:0032970ColorectumADregulation of actin filament-based process142/3918397/187234.05e-125.90e-10142
GO:0110053ColorectumADregulation of actin filament organization108/3918278/187235.02e-126.98e-10108
GO:0008154ColorectumADactin polymerization or depolymerization90/3918218/187236.14e-128.23e-1090
GO:0008064ColorectumADregulation of actin polymerization or depolymerization79/3918188/187234.17e-114.74e-0979
GO:0030832ColorectumADregulation of actin filament length79/3918189/187235.71e-116.27e-0979
GO:1902905ColorectumADpositive regulation of supramolecular fiber organization85/3918209/187235.95e-116.33e-0985
GO:0048732ColorectumADgland development149/3918436/187236.07e-116.33e-09149
GO:0032956ColorectumADregulation of actin cytoskeleton organization127/3918358/187231.03e-101.04e-08127
GO:0051495ColorectumADpositive regulation of cytoskeleton organization89/3918226/187231.61e-101.56e-0889
GO:0045216ColorectumADcell-cell junction organization80/3918200/187235.57e-104.58e-0880
GO:0022411ColorectumADcellular component disassembly147/3918443/187238.53e-106.76e-08147
GO:0022613ColorectumADribonucleoprotein complex biogenesis151/3918463/187231.96e-091.39e-07151
GO:0022604ColorectumADregulation of cell morphogenesis109/3918309/187233.08e-092.07e-07109
GO:0034329ColorectumADcell junction assembly136/3918420/187232.02e-081.15e-06136
GO:0010810ColorectumADregulation of cell-substrate adhesion81/3918221/187234.80e-082.55e-0681
GO:0032984ColorectumADprotein-containing complex disassembly81/3918224/187239.41e-084.65e-0681
GO:0051052ColorectumADregulation of DNA metabolic process116/3918359/187232.47e-071.00e-05116
Page: 1 2 3 4 5 6 7 8 9 10 11 12 13 14 15 16 17 18 19 20 21 22 23 24 25 26 27 28 29 30 31 32 33 34 35 36 37 38 39 40 41 42 43 44 45 46 47 48 49 50 51 52 53 54 55 56 57 58 

check button Enriched KEGG pathways.
Pathway IDTissueDisease StageDescriptionGene RatioBg Ratiopvaluep.adjustqvalueCount
Page: 1 

Top

Cell-cell communication analysis

check buttonIdentification of potential cell-cell interactions between two cell types and their ligand-receptor pairs for different disease states
LigandReceptorLRpairPathwayTissueDisease Stage
Page: 1 

Top

Single-cell gene regulatory network inference analysis

check buttonFind out the significant the regulons (TFs) and the target genes of each regulon across cell types for different disease states
TFCell TypeTissueDisease StageTarget GeneRSSRegulon Activity
∗The dot plots of a searched regulon are shown for all cell subpopulations in each disease state of each tissue based on the regulon specific score inferred using pySCENIC and by calculating the average expression.
Page: 1 

Top

Somatic mutation of malignant transformation related genes

check buttonAnnotation of somatic variants for genes involved in malignant transformation
Hugo SymbolVariant ClassVariant ClassificationdbSNP RSHGVScHGVSpHGVSp ShortSWISSPROTBIOTYPESIFTPolyPhenTumor Sample BarcodeTissueHistologySexAgeStageTherapy TypesDrugsOutcome
DR1SNVMissense_Mutationnovelc.25N>Ap.Asp9Asnp.D9NQ01658protein_codingdeleterious(0)probably_damaging(0.975)TCGA-C5-A1MH-01Cervixcervical & endocervical cancerFemale>=65III/IVChemotherapycisplatinPD
DR1SNVMissense_Mutationc.145N>Ap.Leu49Ilep.L49IQ01658protein_codingdeleterious(0.02)probably_damaging(0.92)TCGA-CA-6715-01Colorectumcolon adenocarcinomaMale<65III/IVChemotherapyoxaliplatinCR
DR1SNVMissense_Mutationc.146N>Gp.Leu49Argp.L49RQ01658protein_codingdeleterious(0)probably_damaging(0.975)TCGA-A5-A2K5-01Endometriumuterine corpus endometrioid carcinomaFemale>=65I/IIUnknownUnknownSD
DR1SNVMissense_Mutationc.328N>Cp.Asn110Hisp.N110HQ01658protein_codingtolerated(0.08)benign(0.222)TCGA-AP-A0LM-01Endometriumuterine corpus endometrioid carcinomaFemale<65III/IVChemotherapycisplatinSD
DR1SNVMissense_Mutationnovelc.253N>Gp.Ser85Glyp.S85GQ01658protein_codingtolerated(0.29)benign(0.04)TCGA-AP-A1DK-01Endometriumuterine corpus endometrioid carcinomaFemale<65I/IIUnknownUnknownSD
DR1SNVMissense_Mutationc.161N>Tp.Ala54Valp.A54VQ01658protein_codingdeleterious(0.02)possibly_damaging(0.668)TCGA-AX-A0J0-01Endometriumuterine corpus endometrioid carcinomaFemale<65I/IIUnknownUnknownSD
DR1SNVMissense_Mutationnovelc.41C>Tp.Pro14Leup.P14LQ01658protein_codingdeleterious(0)possibly_damaging(0.618)TCGA-AX-A3FT-01Endometriumuterine corpus endometrioid carcinomaFemale<65I/IIUnknownUnknownSD
DR1SNVMissense_Mutationrs182894486c.403G>Ap.Glu135Lysp.E135KQ01658protein_codingtolerated(0.16)possibly_damaging(0.522)TCGA-B5-A0JY-01Endometriumuterine corpus endometrioid carcinomaFemale<65III/IVChemotherapydoxorubicinSD
DR1SNVMissense_Mutationc.472G>Ap.Ala158Thrp.A158TQ01658protein_codingtolerated(0.38)probably_damaging(0.956)TCGA-BK-A0C9-01Endometriumuterine corpus endometrioid carcinomaFemale<65I/IIUnknownUnknownSD
DR1SNVMissense_Mutationc.516N>Ap.Asp172Glup.D172EQ01658protein_codingtolerated_low_confidence(0.32)benign(0)TCGA-D1-A176-01Endometriumuterine corpus endometrioid carcinomaFemale>=65I/IIUnknownUnknownSD
Page: 1 2 

Top

Related drugs of malignant transformation related genes

check buttonIdentification of chemicals and drugs interact with genes involved in malignant transfromation
(DGIdb 4.0)
Entrez IDSymbolCategoryInteraction TypesDrug Claim NameDrug NamePMIDs
Page: 1