Schematic overview of the cellular and molecular mechanisms involved in the cancer progression, including the proposed cellular and molecular mechanisms in cancer cells trajectory. AT1: alveolar type 1 cells; AT2: alveolar type 2 cells; AAH: atypical adenomatous hyperplasia; AIS: adenocarcinoma in situ; MIA: minimally invasive adenocarcinoma; IA: invasive adenocarcinoma; EMT: epithelial-mesenchymal transition

Home

Download

Statistics

Help

Contact

Center for Computational Systems Medicine
leaf

Gene summary

leaf

Malignant transformation analysis

leaf

Malignant transformation related pathway analysis

leaf

Cell-cell communication analysis

leaf

Single-cell gene regulatory network inference analysis

leaf

Somatic mutation of malignant transformation related genes

leaf

Related drugs of malignant transformation related genes

Gene: DPYSL3

Gene summary for DPYSL3

check button Gene summary.

Gene informationSpeciesHuman
Gene symbol

DPYSL3

Gene ID

1809

Gene namedihydropyrimidinase like 3
Gene AliasCRMP-4
Cytomap5q32
Gene Typeprotein-coding
GO ID

GO:0006928

UniProtAcc

A0A140VK07


Top

Malignant transformation analysis

check button Identification of the aberrant gene expression in precancerous and cancerous lesions by comparing the gene expression of stem-like cells in diseased tissues with normal stem cells
check button Malignant transformation involving gene list.
Entrez IDSymbolReplicatesSpeciesOrganTissueAdj P-valueLog2FCMalignancy
1809DPYSL3LZE4THumanEsophagusESCC5.03e-062.24e-010.0811
1809DPYSL3LZE7THumanEsophagusESCC1.86e-098.30e-010.0667
1809DPYSL3LZE8THumanEsophagusESCC7.46e-104.58e-010.067
1809DPYSL3LZE24THumanEsophagusESCC1.26e-042.01e-010.0596
1809DPYSL3LZE21THumanEsophagusESCC1.68e-055.91e-010.0655
1809DPYSL3P2T-EHumanEsophagusESCC1.74e-052.81e-010.1177
1809DPYSL3P4T-EHumanEsophagusESCC1.16e-156.17e-010.1323
1809DPYSL3P5T-EHumanEsophagusESCC1.57e-224.78e-010.1327
1809DPYSL3P8T-EHumanEsophagusESCC5.85e-356.64e-010.0889
1809DPYSL3P9T-EHumanEsophagusESCC1.01e-338.43e-010.1131
1809DPYSL3P10T-EHumanEsophagusESCC5.33e-214.92e-010.116
1809DPYSL3P11T-EHumanEsophagusESCC2.81e-281.21e+000.1426
1809DPYSL3P12T-EHumanEsophagusESCC1.80e-431.05e+000.1122
1809DPYSL3P15T-EHumanEsophagusESCC8.89e-349.03e-010.1149
1809DPYSL3P16T-EHumanEsophagusESCC6.79e-125.16e-020.1153
1809DPYSL3P19T-EHumanEsophagusESCC1.63e-131.26e+000.1662
1809DPYSL3P21T-EHumanEsophagusESCC1.58e-357.25e-010.1617
1809DPYSL3P22T-EHumanEsophagusESCC1.35e-021.42e-010.1236
1809DPYSL3P23T-EHumanEsophagusESCC2.95e-431.19e+000.108
1809DPYSL3P24T-EHumanEsophagusESCC1.32e-094.26e-010.1287
Page: 1 2 3 4 5 

check button Transcriptomic changes along malignancy continuum.
TissueExpression DynamicsAbbreviation
EsophagusThe image shows the transcriptomic changes along malignancy continuum.log2FC in expression of this searched gene in stem-like cells from each diseased tissue sample relative to stem-like cells in normal samples in each tissue plotted against the malignancy continuum. Samples are colored based on if they are from different disease stage.ESCC: Esophageal squamous cell carcinoma
HGIN: High-grade intraepithelial neoplasias
LGIN: Low-grade intraepithelial neoplasias
LungThe image shows the transcriptomic changes along malignancy continuum.log2FC in expression of this searched gene in stem-like cells from each diseased tissue sample relative to stem-like cells in normal samples in each tissue plotted against the malignancy continuum. Samples are colored based on if they are from different disease stage.
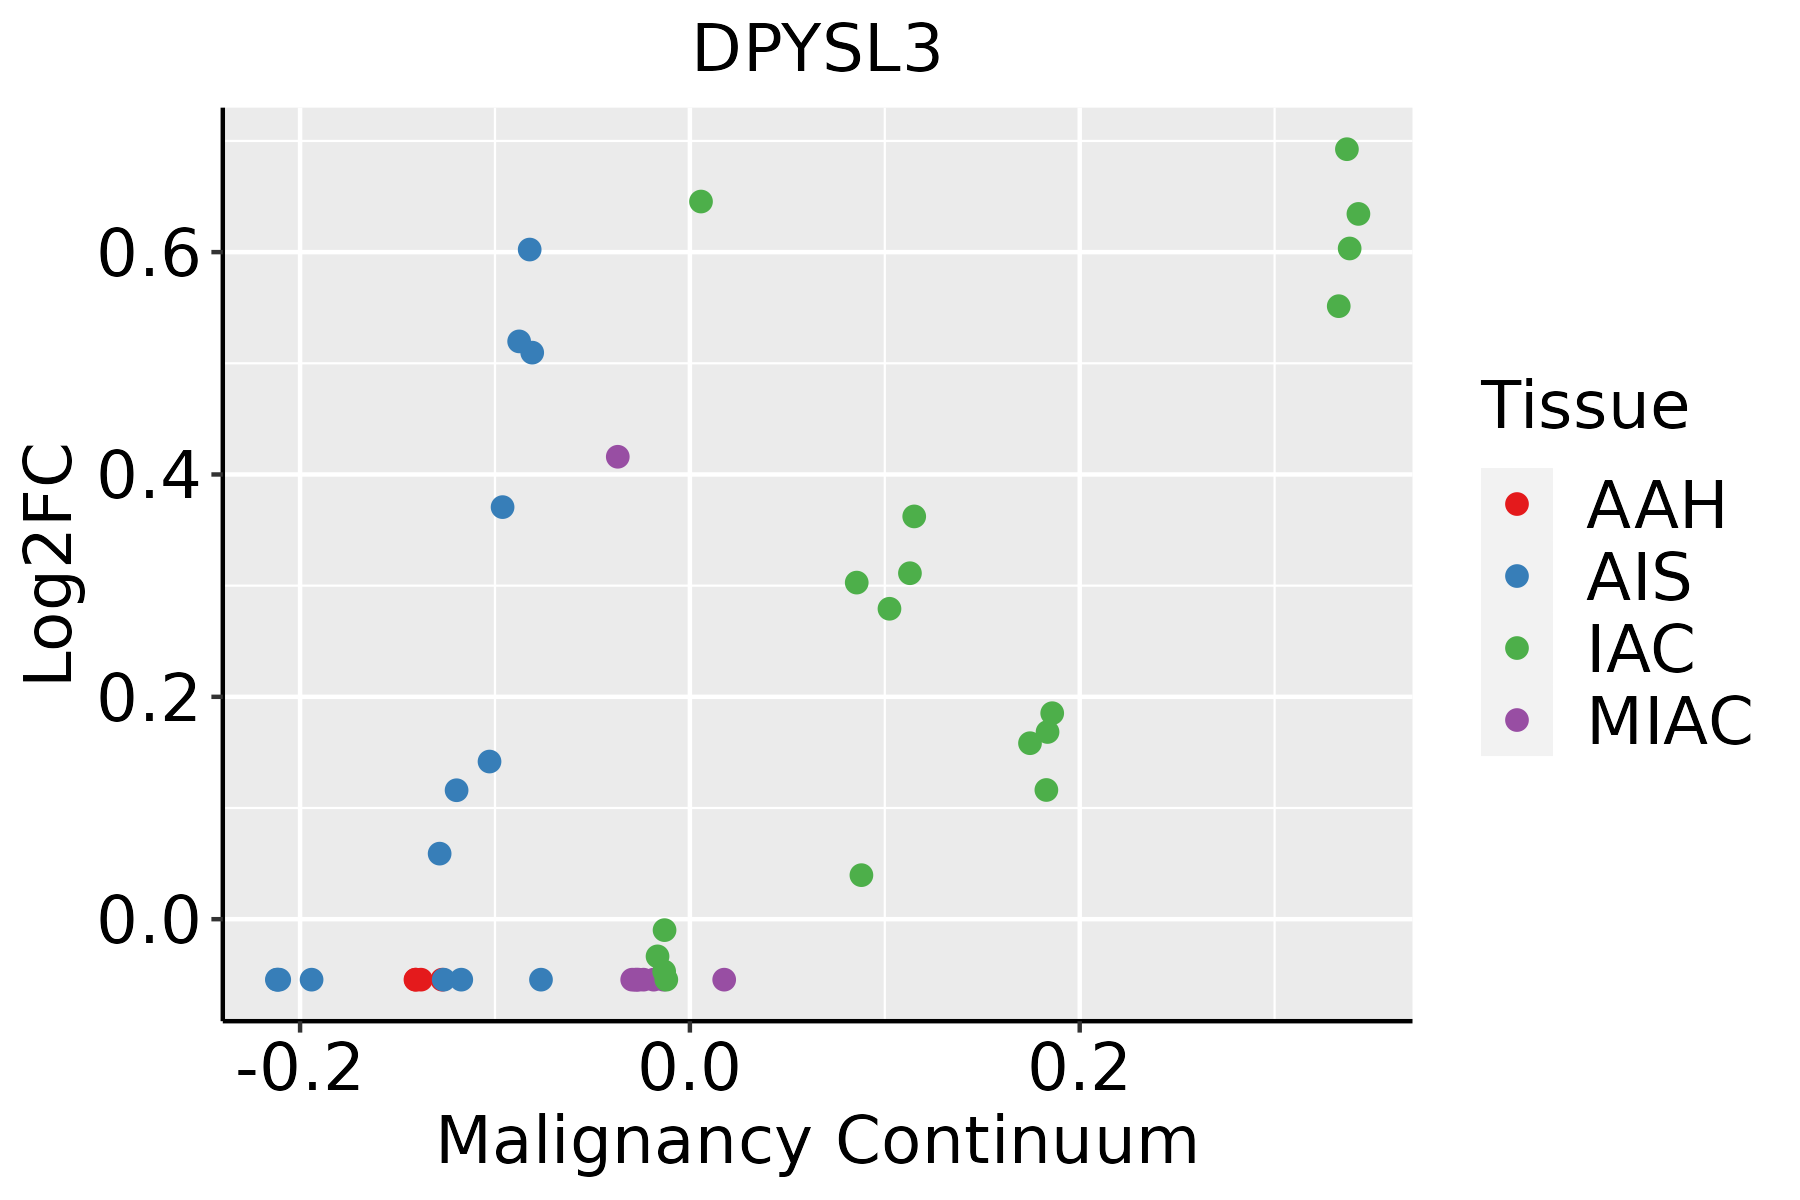
AAH: Atypical adenomatous hyperplasia
AIS: Adenocarcinoma in situ
IAC: Invasive lung adenocarcinoma
MIA: Minimally invasive adenocarcinoma
Oral CavityThe image shows the transcriptomic changes along malignancy continuum.log2FC in expression of this searched gene in stem-like cells from each diseased tissue sample relative to stem-like cells in normal samples in each tissue plotted against the malignancy continuum. Samples are colored based on if they are from different disease stage.
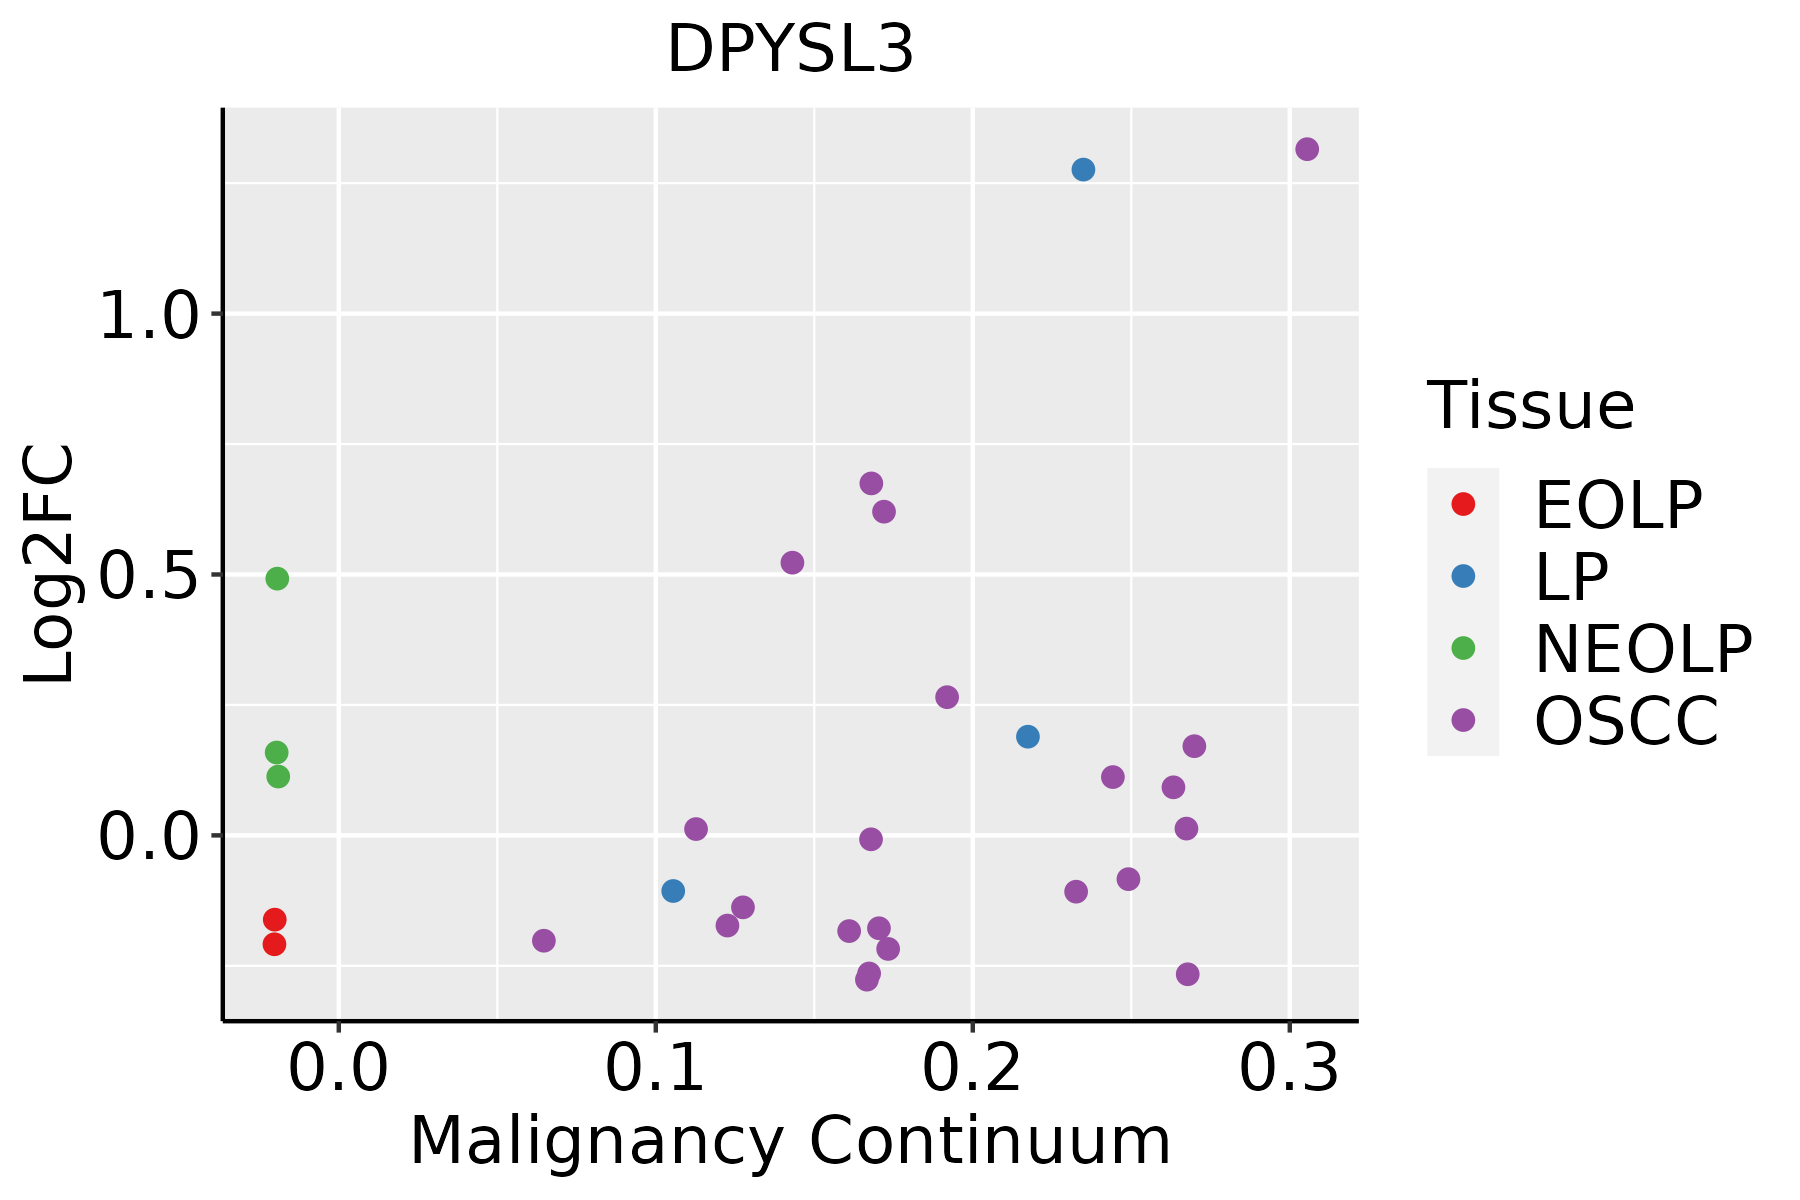
EOLP: Erosive Oral lichen planus
LP: leukoplakia
NEOLP: Non-erosive oral lichen planus
OSCC: Oral squamous cell carcinoma
ThyroidThe image shows the transcriptomic changes along malignancy continuum.log2FC in expression of this searched gene in stem-like cells from each diseased tissue sample relative to stem-like cells in normal samples in each tissue plotted against the malignancy continuum. Samples are colored based on if they are from different disease stage.
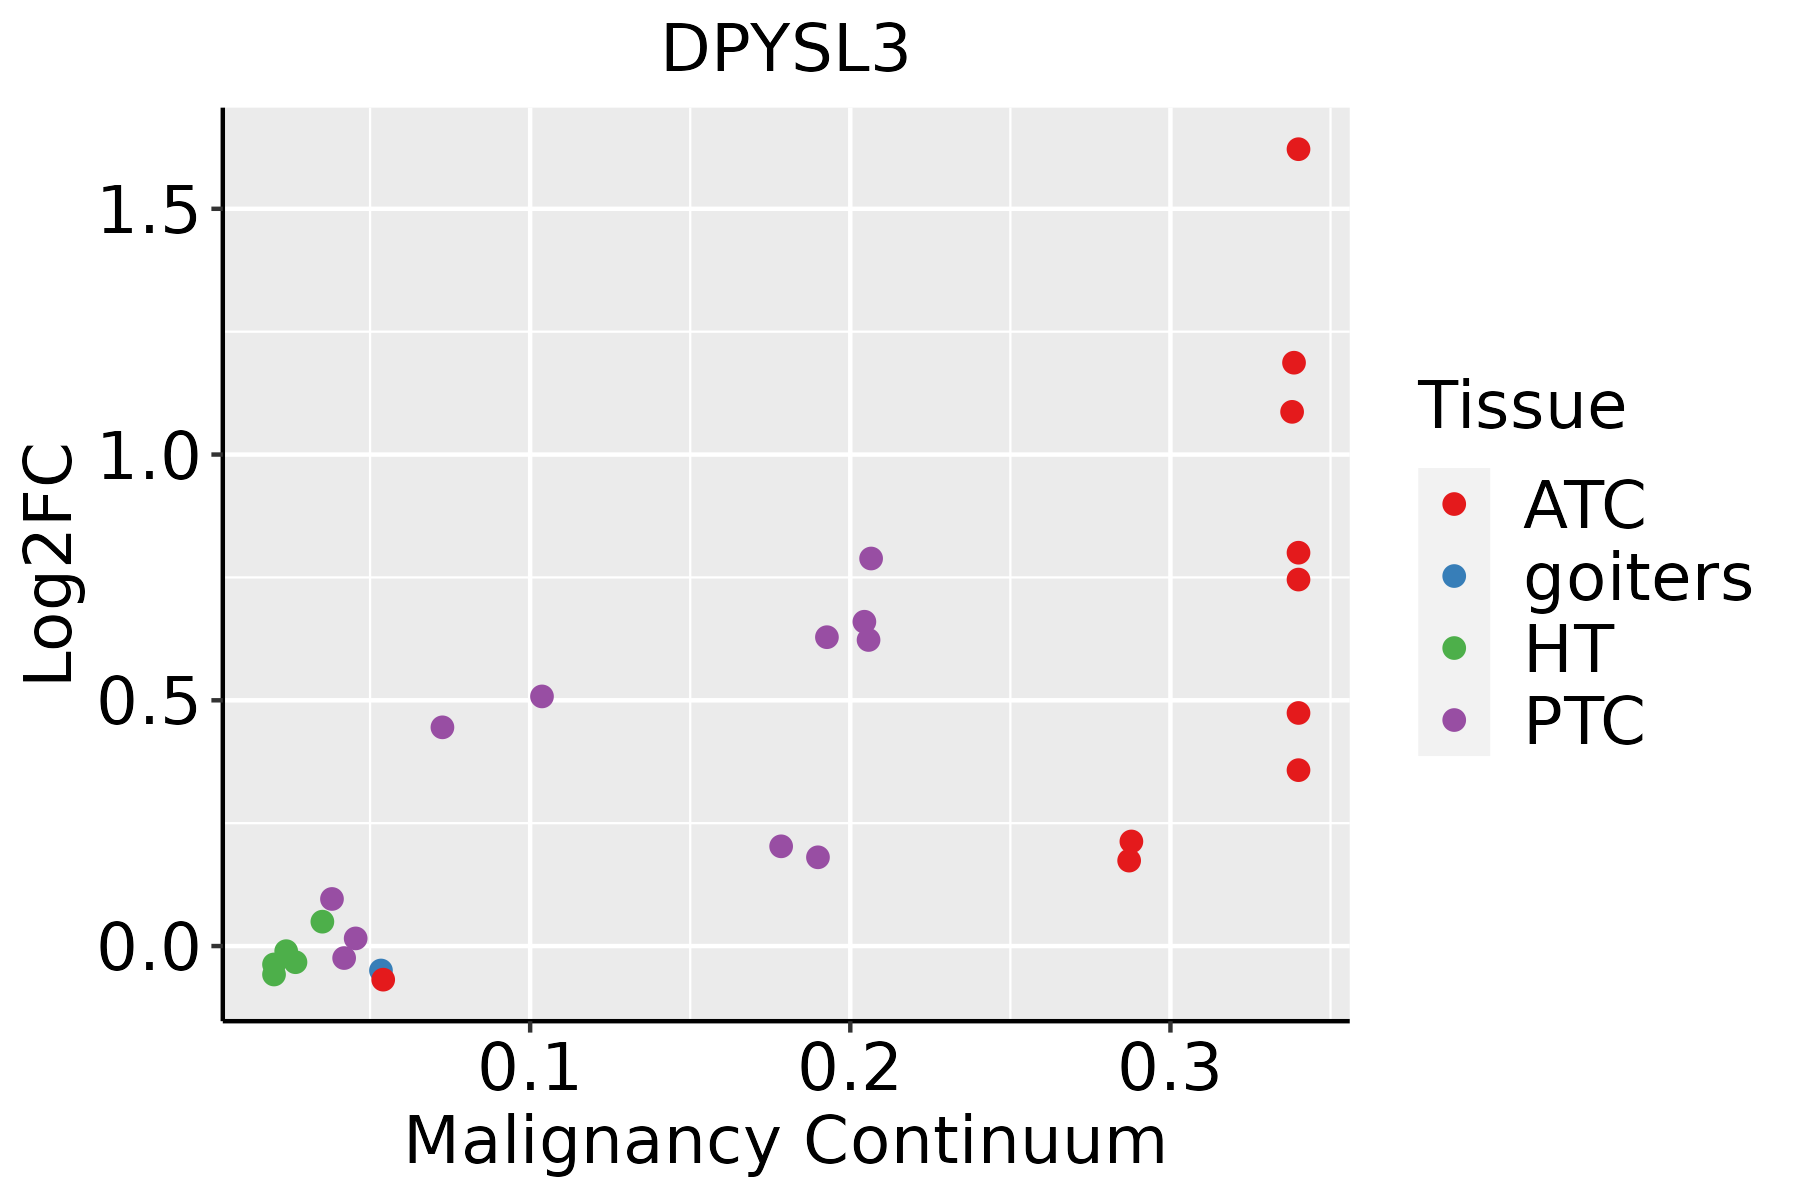
ATC: Anaplastic thyroid cancer
HT: Hashimoto's thyroiditis
PTC: Papillary thyroid cancer
∗log2FC in expression of this searched gene in stem-like cells from each diseased tissue sample relative to stem-like cells in normal samples in each tissue plotted against the malignancy continuum. Samples are colored based on if they are from different disease stage.

Top

Malignant transformation related pathway analysis

check buttonFind out the enriched GO biological processes and KEGG pathways involved in transition from healthy to precancer to cancer
check button Figure of enriched GO biological processes.
TissueDisease StageEnriched GO biological Processes
ColorectumADGO analysis - Figure of enriched GO biological processes: Top 15 enriched GO BP terms are showed in the bar plot of each disease state in each tissue. Each row represents a significant GO biological process which is colored according to the -log10(p.adjust).
ColorectumSERGO analysis - Figure of enriched GO biological processes: Top 15 enriched GO BP terms are showed in the bar plot of each disease state in each tissue. Each row represents a significant GO biological process which is colored according to the -log10(p.adjust).
ColorectumMSSGO analysis - Figure of enriched GO biological processes: Top 15 enriched GO BP terms are showed in the bar plot of each disease state in each tissue. Each row represents a significant GO biological process which is colored according to the -log10(p.adjust).
ColorectumMSI-HGO analysis - Figure of enriched GO biological processes: Top 15 enriched GO BP terms are showed in the bar plot of each disease state in each tissue. Each row represents a significant GO biological process which is colored according to the -log10(p.adjust).
ColorectumFAPGO analysis - Figure of enriched GO biological processes: Top 15 enriched GO BP terms are showed in the bar plot of each disease state in each tissue. Each row represents a significant GO biological process which is colored according to the -log10(p.adjust).
∗Top 15 enriched GO BP terms are showed in the bar plot of each disease state in each tissue. Each row represents a significant GO biological process which is colored according to the -log10(p.adjust).
Page: 1 2 3 4 5 6 7 8 9 

check button Enriched GO biological processes.
GO IDTissueDisease StageDescriptionGene RatioBg Ratiopvaluep.adjustCount
GO:000701527EsophagusESCCactin filament organization259/8552442/187232.37e-084.50e-07259
GO:005101727EsophagusESCCactin filament bundle assembly100/8552157/187233.87e-064.17e-05100
GO:006157227EsophagusESCCactin filament bundle organization101/8552161/187239.22e-068.82e-05101
GO:003134616EsophagusESCCpositive regulation of cell projection organization201/8552353/187231.19e-051.11e-04201
GO:001097516EsophagusESCCregulation of neuron projection development240/8552445/187232.48e-041.53e-03240
GO:006049118EsophagusESCCregulation of cell projection assembly110/8552188/187232.60e-041.58e-03110
GO:012003218EsophagusESCCregulation of plasma membrane bounded cell projection assembly108/8552186/187234.37e-042.46e-03108
GO:01200347EsophagusESCCpositive regulation of plasma membrane bounded cell projection assembly64/8552105/187231.15e-035.70e-0364
GO:00486785EsophagusESCCresponse to axon injury51/855283/187232.74e-031.16e-0251
GO:00109764EsophagusESCCpositive regulation of neuron projection development91/8552163/187235.72e-032.13e-0291
GO:00070158LungIACactin filament organization92/2061442/187231.01e-091.93e-0792
GO:00510178LungIACactin filament bundle assembly40/2061157/187232.66e-072.14e-0540
GO:00615728LungIACactin filament bundle organization40/2061161/187235.43e-073.32e-0540
GO:00109756LungIACregulation of neuron projection development82/2061445/187231.82e-068.78e-0582
GO:00313455LungIACnegative regulation of cell projection organization41/2061186/187231.01e-053.23e-0441
GO:01200327LungIACregulation of plasma membrane bounded cell projection assembly39/2061186/187235.41e-051.21e-0339
GO:00604916LungIACregulation of cell projection assembly39/2061188/187236.92e-051.47e-0339
GO:00313466LungIACpositive regulation of cell projection organization63/2061353/187237.37e-051.55e-0363
GO:00109774LungIACnegative regulation of neuron projection development27/2061137/187231.88e-031.92e-0227
GO:2000146LungIACnegative regulation of cell motility56/2061359/187234.58e-033.62e-0256
Page: 1 2 3 4 5 6 

check button Enriched KEGG pathways.
Pathway IDTissueDisease StageDescriptionGene RatioBg Ratiopvaluep.adjustqvalueCount
Page: 1 

Top

Cell-cell communication analysis

check buttonIdentification of potential cell-cell interactions between two cell types and their ligand-receptor pairs for different disease states
LigandReceptorLRpairPathwayTissueDisease Stage
Page: 1 

Top

Single-cell gene regulatory network inference analysis

check buttonFind out the significant the regulons (TFs) and the target genes of each regulon across cell types for different disease states
TFCell TypeTissueDisease StageTarget GeneRSSRegulon Activity
∗The dot plots of a searched regulon are shown for all cell subpopulations in each disease state of each tissue based on the regulon specific score inferred using pySCENIC and by calculating the average expression.
Page: 1 

Top

Somatic mutation of malignant transformation related genes

check buttonAnnotation of somatic variants for genes involved in malignant transformation
Hugo SymbolVariant ClassVariant ClassificationdbSNP RSHGVScHGVSpHGVSp ShortSWISSPROTBIOTYPESIFTPolyPhenTumor Sample BarcodeTissueHistologySexAgeStageTherapy TypesDrugsOutcome
DPYSL3SNVMissense_Mutationc.1470N>Ap.Asp490Glup.D490EQ14195protein_codingdeleterious(0)possibly_damaging(0.815)TCGA-A8-A076-01Breastbreast invasive carcinomaFemale>=65I/IIHormone TherapyanastrozoleSD
DPYSL3SNVMissense_Mutationrs750296589c.545N>Ap.Gly182Glup.G182EQ14195protein_codingdeleterious(0)probably_damaging(1)TCGA-AC-A23H-01Breastbreast invasive carcinomaFemale>=65I/IIUnknownUnknownPD
DPYSL3SNVMissense_Mutationc.760N>Cp.Asp254Hisp.D254HQ14195protein_codingdeleterious(0.01)probably_damaging(1)TCGA-BH-A0B7-01Breastbreast invasive carcinomaFemale<65I/IIChemotherapyadriamycinCR
DPYSL3SNVMissense_Mutationrs754356799c.1471N>Ap.Glu491Lysp.E491KQ14195protein_codingdeleterious(0.01)probably_damaging(0.977)TCGA-BH-A5J0-01Breastbreast invasive carcinomaFemale<65I/IIUnknownUnknownSD
DPYSL3SNVMissense_Mutationc.1423N>Tp.Arg475Trpp.R475WQ14195protein_codingdeleterious(0)probably_damaging(1)TCGA-D8-A1XQ-01Breastbreast invasive carcinomaFemale>=65I/IIUnknownUnknownSD
DPYSL3SNVMissense_Mutationc.1036N>Ap.Glu346Lysp.E346KQ14195protein_codingdeleterious(0)probably_damaging(0.966)TCGA-E9-A1NA-01Breastbreast invasive carcinomaFemale<65I/IIChemotherapycyclophosphamideSD
DPYSL3SNVMissense_Mutationc.424N>Ap.Asp142Asnp.D142NQ14195protein_codingdeleterious(0)probably_damaging(0.998)TCGA-GM-A2DI-01Breastbreast invasive carcinomaFemale<65I/IIChemotherapytaxotereCR
DPYSL3SNVMissense_Mutationrs757343684c.1570G>Ap.Val524Ilep.V524IQ14195protein_codingdeleterious(0.04)benign(0.212)TCGA-2W-A8YY-01Cervixcervical & endocervical cancerFemale<65I/IIChemotherapycisplatinCR
DPYSL3SNVMissense_Mutationc.732G>Cp.Lys244Asnp.K244NQ14195protein_codingdeleterious(0.01)probably_damaging(0.934)TCGA-DG-A2KM-01Cervixcervical & endocervical cancerFemale<65I/IIChemotherapycisplatinSD
DPYSL3SNVMissense_Mutationrs751361322c.1900C>Tp.Arg634Trpp.R634WQ14195protein_codingdeleterious(0)possibly_damaging(0.821)TCGA-EK-A2PG-01Cervixcervical & endocervical cancerFemale>=65I/IIUnknownUnknownSD
Page: 1 2 3 4 5 6 7 8 

Top

Related drugs of malignant transformation related genes

check buttonIdentification of chemicals and drugs interact with genes involved in malignant transfromation
(DGIdb 4.0)
Entrez IDSymbolCategoryInteraction TypesDrug Claim NameDrug NamePMIDs
1809DPYSL3NAMETHIMAZOLEMETHIMAZOLE11694350
Page: 1