
|
|||||
|
 | |
| |
| |
| |
| |
| |
|
Gene: DPYSL2 |
Gene summary for DPYSL2 |
| Gene information | Species | Human | Gene symbol | DPYSL2 | Gene ID | 1808 |
| Gene name | dihydropyrimidinase like 2 | |
| Gene Alias | CRMP-2 | |
| Cytomap | 8p21.2 | |
| Gene Type | protein-coding | GO ID | GO:0000902 | UniProtAcc | A0A1C7CYX9 |
Top |
Malignant transformation analysis |
| Identification of the aberrant gene expression in precancerous and cancerous lesions by comparing the gene expression of stem-like cells in diseased tissues with normal stem cells |
| Entrez ID | Symbol | Replicates | Species | Organ | Tissue | Adj P-value | Log2FC | Malignancy |
| 1808 | DPYSL2 | P2T-E | Human | Esophagus | ESCC | 1.13e-11 | 2.79e-01 | 0.1177 |
| 1808 | DPYSL2 | P4T-E | Human | Esophagus | ESCC | 2.72e-11 | 2.48e-01 | 0.1323 |
| 1808 | DPYSL2 | P9T-E | Human | Esophagus | ESCC | 1.23e-03 | 2.23e-01 | 0.1131 |
| 1808 | DPYSL2 | P10T-E | Human | Esophagus | ESCC | 3.63e-26 | 4.28e-01 | 0.116 |
| 1808 | DPYSL2 | P11T-E | Human | Esophagus | ESCC | 1.77e-05 | 2.82e-01 | 0.1426 |
| 1808 | DPYSL2 | P12T-E | Human | Esophagus | ESCC | 5.70e-03 | 1.16e-01 | 0.1122 |
| 1808 | DPYSL2 | P15T-E | Human | Esophagus | ESCC | 1.28e-02 | 3.16e-02 | 0.1149 |
| 1808 | DPYSL2 | P16T-E | Human | Esophagus | ESCC | 1.87e-26 | 4.05e-01 | 0.1153 |
| 1808 | DPYSL2 | P19T-E | Human | Esophagus | ESCC | 1.27e-02 | 5.30e-01 | 0.1662 |
| 1808 | DPYSL2 | P20T-E | Human | Esophagus | ESCC | 4.10e-09 | 1.83e-01 | 0.1124 |
| 1808 | DPYSL2 | P21T-E | Human | Esophagus | ESCC | 7.31e-15 | 3.18e-01 | 0.1617 |
| 1808 | DPYSL2 | P22T-E | Human | Esophagus | ESCC | 4.63e-08 | 1.42e-01 | 0.1236 |
| 1808 | DPYSL2 | P24T-E | Human | Esophagus | ESCC | 2.28e-04 | 8.52e-02 | 0.1287 |
| 1808 | DPYSL2 | P26T-E | Human | Esophagus | ESCC | 3.98e-04 | 1.14e-01 | 0.1276 |
| 1808 | DPYSL2 | P27T-E | Human | Esophagus | ESCC | 2.83e-04 | 6.61e-02 | 0.1055 |
| 1808 | DPYSL2 | P30T-E | Human | Esophagus | ESCC | 3.14e-07 | 4.38e-01 | 0.137 |
| 1808 | DPYSL2 | P31T-E | Human | Esophagus | ESCC | 3.96e-04 | 8.71e-02 | 0.1251 |
| 1808 | DPYSL2 | P32T-E | Human | Esophagus | ESCC | 4.06e-10 | 1.54e-01 | 0.1666 |
| 1808 | DPYSL2 | P37T-E | Human | Esophagus | ESCC | 7.47e-08 | 1.02e-01 | 0.1371 |
| 1808 | DPYSL2 | P42T-E | Human | Esophagus | ESCC | 5.12e-08 | 2.45e-01 | 0.1175 |
| Page: 1 2 3 |
| Tissue | Expression Dynamics | Abbreviation |
| Esophagus | 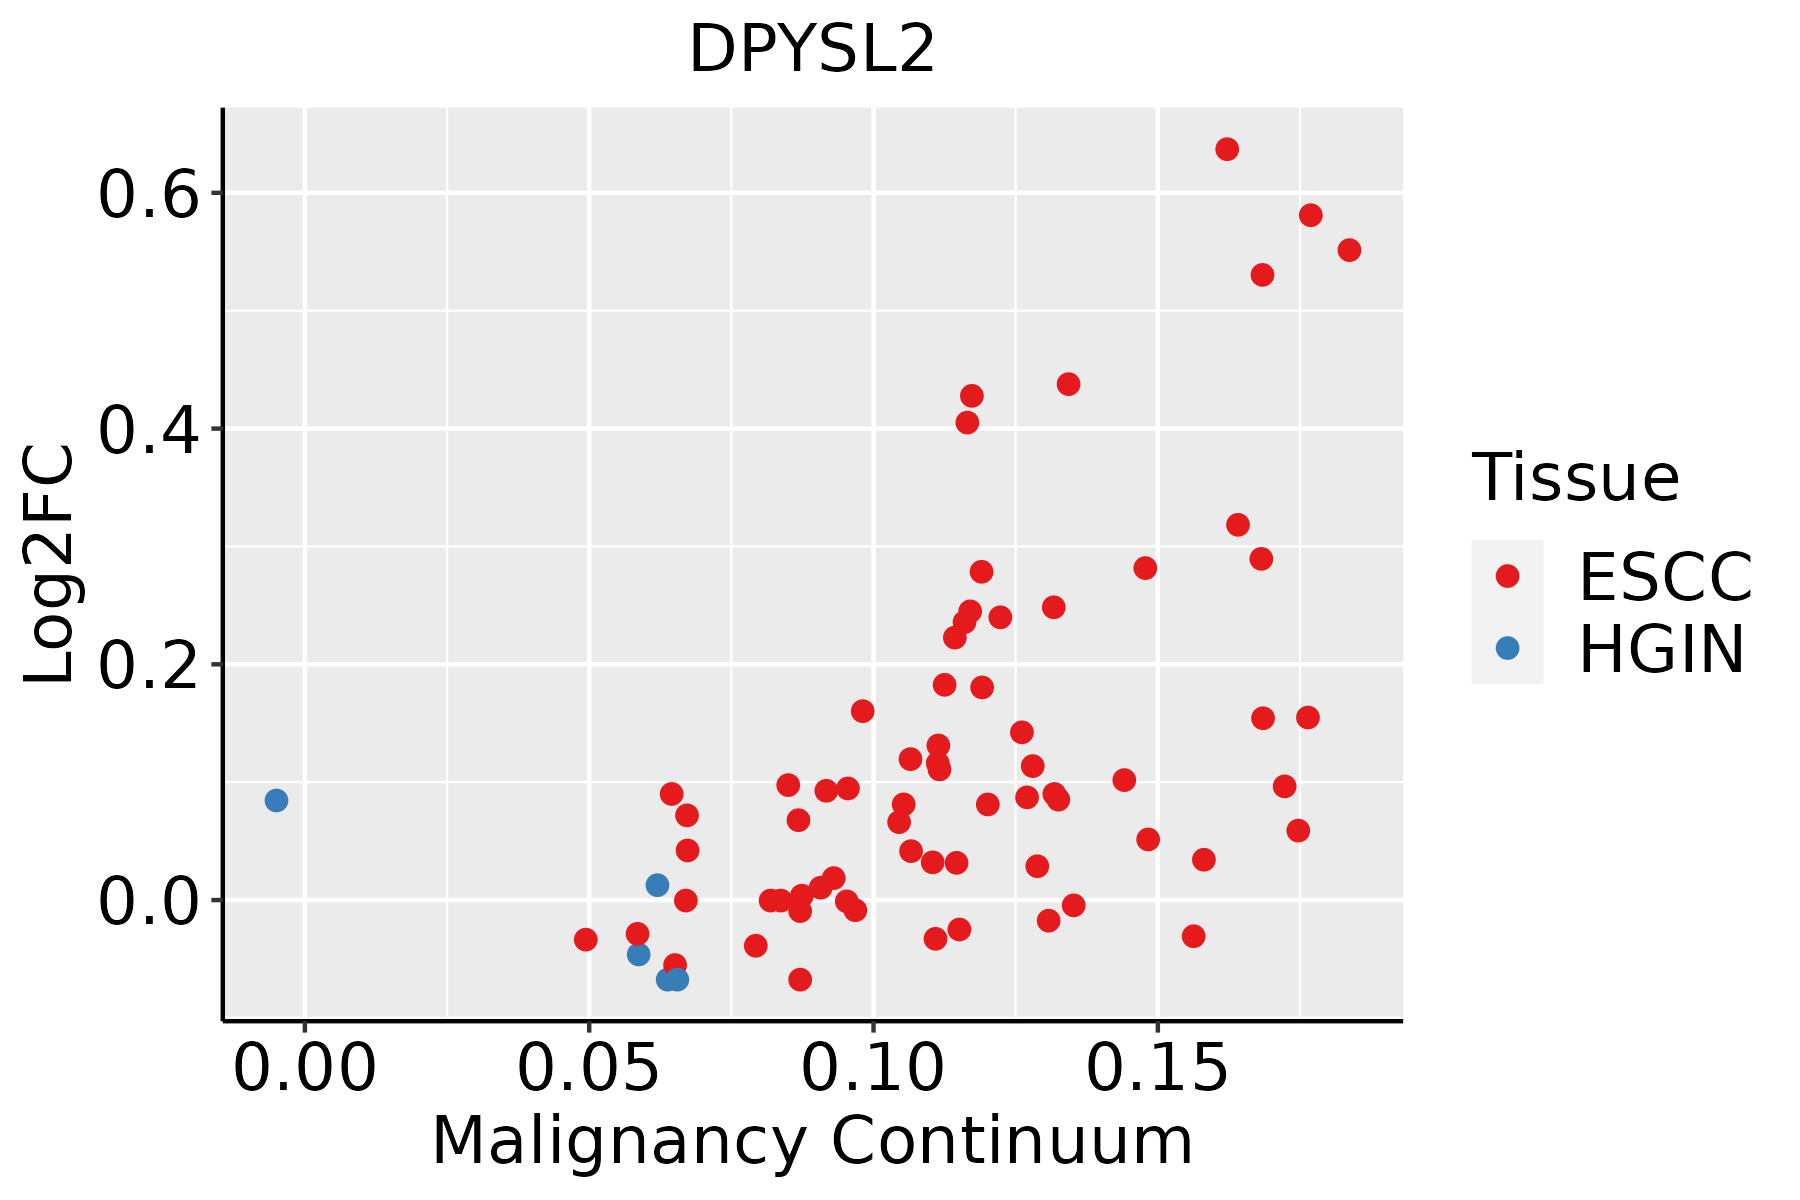 | ESCC: Esophageal squamous cell carcinoma |
| HGIN: High-grade intraepithelial neoplasias | ||
| LGIN: Low-grade intraepithelial neoplasias | ||
| Thyroid | 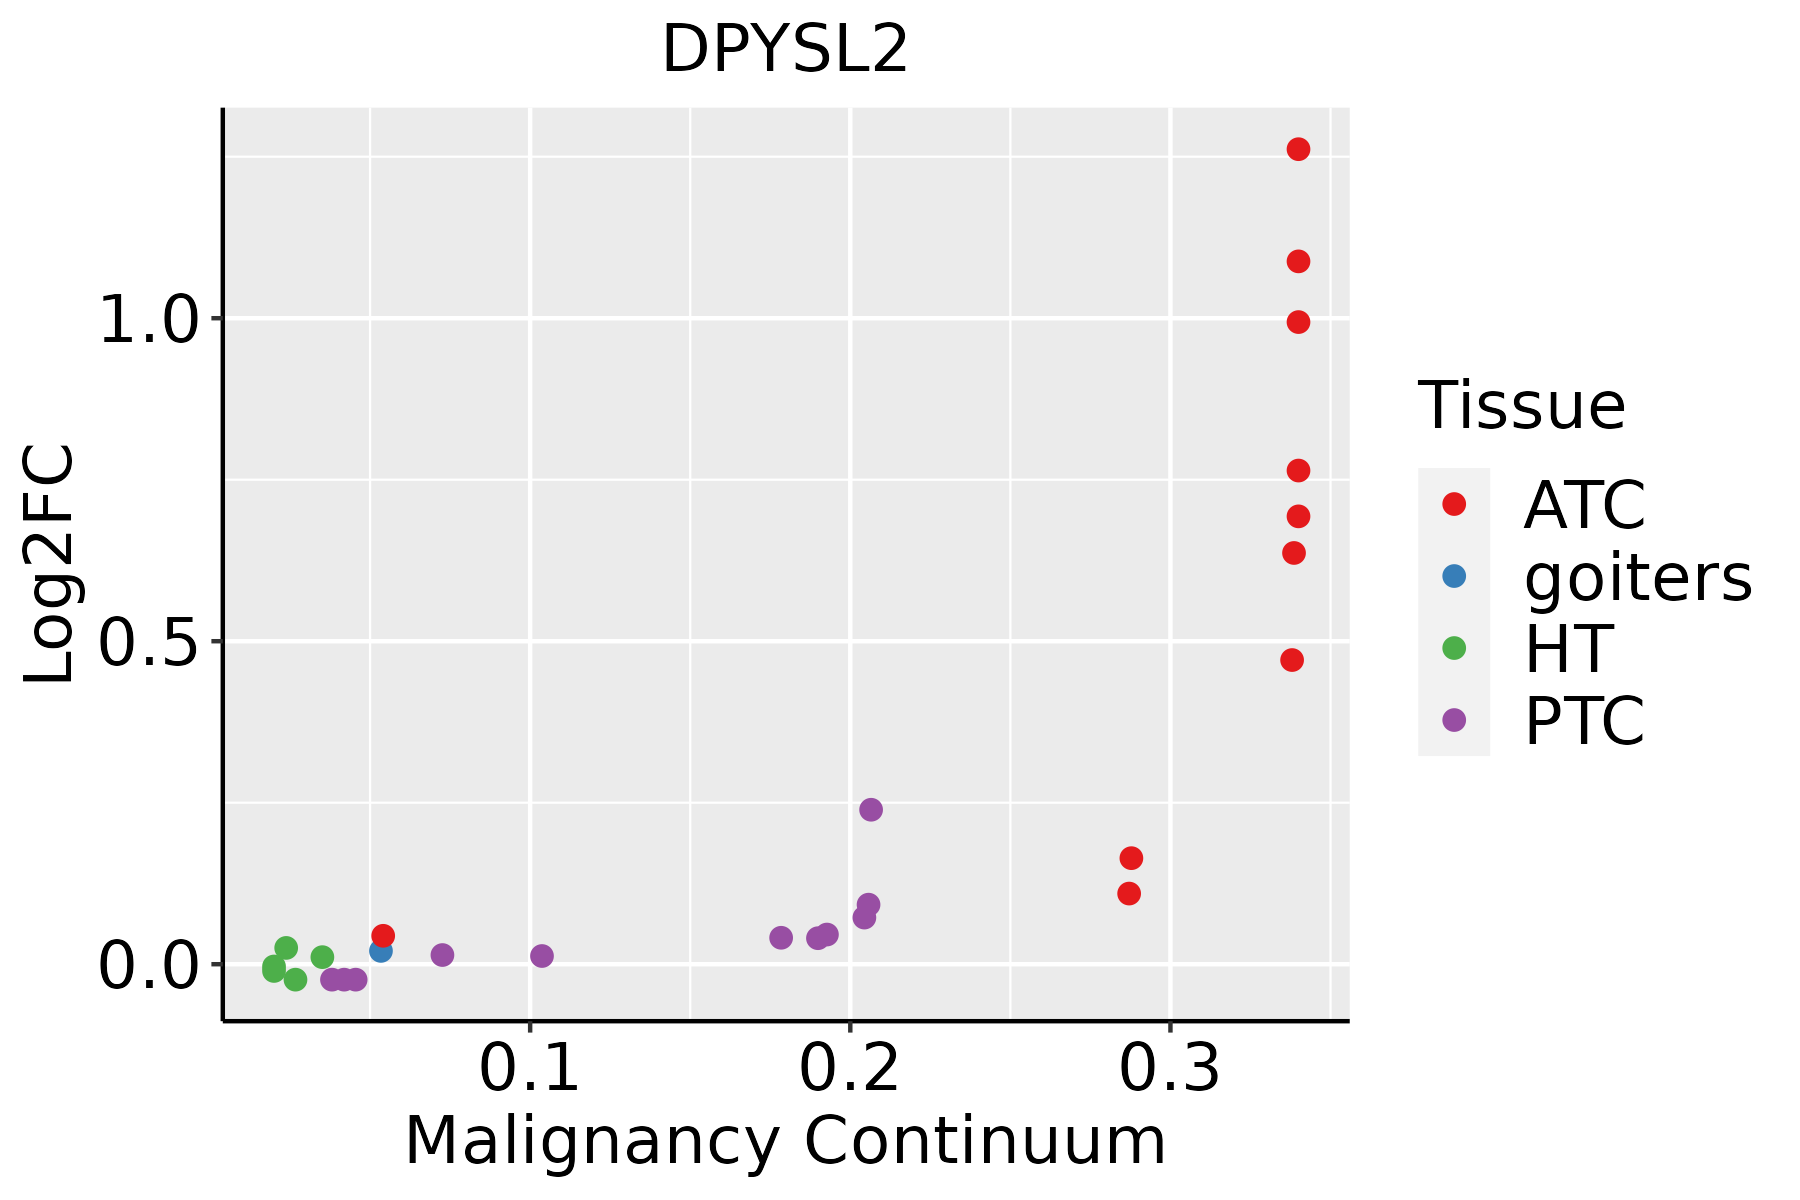 | ATC: Anaplastic thyroid cancer |
| HT: Hashimoto's thyroiditis | ||
| PTC: Papillary thyroid cancer |
| ∗log2FC in expression of this searched gene in stem-like cells from each diseased tissue sample relative to stem-like cells in normal samples in each tissue plotted against the malignancy continuum. Samples are colored based on if they are from different disease stage. |
Top |
Malignant transformation related pathway analysis |
| Find out the enriched GO biological processes and KEGG pathways involved in transition from healthy to precancer to cancer |
| Tissue | Disease Stage | Enriched GO biological Processes |
| Colorectum | AD |  |
| Colorectum | SER |  |
| Colorectum | MSS |  |
| Colorectum | MSI-H |  |
| Colorectum | FAP |  |
| ∗Top 15 enriched GO BP terms are showed in the bar plot of each disease state in each tissue. Each row represents a significant GO biological process which is colored according to the -log10(p.adjust). |
| Page: 1 2 3 4 5 6 7 8 9 |
| GO ID | Tissue | Disease Stage | Description | Gene Ratio | Bg Ratio | pvalue | p.adjust | Count |
| GO:0016049110 | Esophagus | ESCC | cell growth | 289/8552 | 482/18723 | 1.29e-10 | 3.77e-09 | 289 |
| GO:000155819 | Esophagus | ESCC | regulation of cell growth | 248/8552 | 414/18723 | 2.97e-09 | 6.45e-08 | 248 |
| GO:003253520 | Esophagus | ESCC | regulation of cellular component size | 227/8552 | 383/18723 | 4.77e-08 | 8.60e-07 | 227 |
| GO:00083619 | Esophagus | ESCC | regulation of cell size | 107/8552 | 181/18723 | 1.81e-04 | 1.16e-03 | 107 |
| GO:006156415 | Esophagus | ESCC | axon development | 251/8552 | 467/18723 | 2.41e-04 | 1.49e-03 | 251 |
| GO:006056010 | Esophagus | ESCC | developmental growth involved in morphogenesis | 131/8552 | 234/18723 | 9.28e-04 | 4.73e-03 | 131 |
| GO:000740915 | Esophagus | ESCC | axonogenesis | 219/8552 | 418/18723 | 3.14e-03 | 1.31e-02 | 219 |
| GO:004858810 | Esophagus | ESCC | developmental cell growth | 125/8552 | 234/18723 | 1.01e-02 | 3.46e-02 | 125 |
| GO:0016049112 | Thyroid | PTC | cell growth | 225/5968 | 482/18723 | 4.75e-12 | 2.07e-10 | 225 |
| GO:0032535112 | Thyroid | PTC | regulation of cellular component size | 181/5968 | 383/18723 | 1.70e-10 | 5.64e-09 | 181 |
| GO:0001558111 | Thyroid | PTC | regulation of cell growth | 188/5968 | 414/18723 | 4.13e-09 | 1.09e-07 | 188 |
| GO:006156419 | Thyroid | PTC | axon development | 199/5968 | 467/18723 | 5.27e-07 | 8.53e-06 | 199 |
| GO:004867517 | Thyroid | PTC | axon extension | 63/5968 | 120/18723 | 2.14e-06 | 2.89e-05 | 63 |
| GO:000740918 | Thyroid | PTC | axonogenesis | 178/5968 | 418/18723 | 2.17e-06 | 2.91e-05 | 178 |
| GO:004858819 | Thyroid | PTC | developmental cell growth | 106/5968 | 234/18723 | 1.07e-05 | 1.19e-04 | 106 |
| GO:006056018 | Thyroid | PTC | developmental growth involved in morphogenesis | 105/5968 | 234/18723 | 1.94e-05 | 1.98e-04 | 105 |
| GO:199013817 | Thyroid | PTC | neuron projection extension | 81/5968 | 172/18723 | 2.07e-05 | 2.08e-04 | 81 |
| GO:000836115 | Thyroid | PTC | regulation of cell size | 83/5968 | 181/18723 | 5.45e-05 | 4.84e-04 | 83 |
| GO:00305167 | Thyroid | PTC | regulation of axon extension | 47/5968 | 95/18723 | 2.60e-04 | 1.86e-03 | 47 |
| GO:00613873 | Thyroid | PTC | regulation of extent of cell growth | 52/5968 | 110/18723 | 5.20e-04 | 3.37e-03 | 52 |
| Page: 1 2 |
| Pathway ID | Tissue | Disease Stage | Description | Gene Ratio | Bg Ratio | pvalue | p.adjust | qvalue | Count |
| hsa0436016 | Esophagus | ESCC | Axon guidance | 108/4205 | 182/8465 | 5.13e-03 | 1.30e-02 | 6.67e-03 | 108 |
| hsa0436017 | Esophagus | ESCC | Axon guidance | 108/4205 | 182/8465 | 5.13e-03 | 1.30e-02 | 6.67e-03 | 108 |
| Page: 1 |
Top |
Cell-cell communication analysis |
| Identification of potential cell-cell interactions between two cell types and their ligand-receptor pairs for different disease states |
| Ligand | Receptor | LRpair | Pathway | Tissue | Disease Stage |
| Page: 1 |
Top |
Single-cell gene regulatory network inference analysis |
| Find out the significant the regulons (TFs) and the target genes of each regulon across cell types for different disease states |
| TF | Cell Type | Tissue | Disease Stage | Target Gene | RSS | Regulon Activity |
| ∗The dot plots of a searched regulon are shown for all cell subpopulations in each disease state of each tissue based on the regulon specific score inferred using pySCENIC and by calculating the average expression. |
| Page: 1 |
Top |
Somatic mutation of malignant transformation related genes |
| Annotation of somatic variants for genes involved in malignant transformation |
| Hugo Symbol | Variant Class | Variant Classification | dbSNP RS | HGVSc | HGVSp | HGVSp Short | SWISSPROT | BIOTYPE | SIFT | PolyPhen | Tumor Sample Barcode | Tissue | Histology | Sex | Age | Stage | Therapy Types | Drugs | Outcome |
| DPYSL2 | SNV | Missense_Mutation | rs143980725 | c.892G>A | p.Ala298Thr | p.A298T | protein_coding | deleterious(0) | probably_damaging(0.986) | TCGA-AR-A0TW-01 | Breast | breast invasive carcinoma | Female | <65 | III/IV | Chemotherapy | doxorubicin | PD | |
| DPYSL2 | SNV | Missense_Mutation | c.851G>A | p.Cys284Tyr | p.C284Y | protein_coding | deleterious(0.03) | benign(0) | TCGA-BH-A0BC-01 | Breast | breast invasive carcinoma | Female | <65 | III/IV | Chemotherapy | doxorubicin | SD | ||
| DPYSL2 | SNV | Missense_Mutation | c.513N>G | p.Ile171Met | p.I171M | protein_coding | tolerated(0.39) | possibly_damaging(0.541) | TCGA-C8-A26Y-01 | Breast | breast invasive carcinoma | Female | >=65 | I/II | Unknown | Unknown | SD | ||
| DPYSL2 | SNV | Missense_Mutation | novel | c.1622N>A | p.Gly541Asp | p.G541D | protein_coding | deleterious(0.01) | probably_damaging(0.997) | TCGA-2W-A8YY-01 | Cervix | cervical & endocervical cancer | Female | <65 | I/II | Chemotherapy | cisplatin | CR | |
| DPYSL2 | SNV | Missense_Mutation | rs779134278 | c.1633C>T | p.Arg545Cys | p.R545C | protein_coding | deleterious(0) | probably_damaging(0.994) | TCGA-4J-AA1J-01 | Cervix | cervical & endocervical cancer | Female | <65 | I/II | Unknown | Unknown | SD | |
| DPYSL2 | SNV | Missense_Mutation | rs774132967 | c.538N>T | p.Arg180Cys | p.R180C | protein_coding | tolerated(0.15) | benign(0.009) | TCGA-JW-A852-01 | Cervix | cervical & endocervical cancer | Female | <65 | I/II | Unknown | Unknown | PD | |
| DPYSL2 | SNV | Missense_Mutation | novel | c.1546A>C | p.Ile516Leu | p.I516L | protein_coding | tolerated(0.16) | possibly_damaging(0.87) | TCGA-VS-A8EK-01 | Cervix | cervical & endocervical cancer | Female | >=65 | I/II | Chemotherapy | cisplatin | PD | |
| DPYSL2 | SNV | Missense_Mutation | c.517N>A | p.Gly173Arg | p.G173R | protein_coding | deleterious(0) | probably_damaging(1) | TCGA-AA-3715-01 | Colorectum | colon adenocarcinoma | Male | >=65 | I/II | Unknown | Unknown | PD | ||
| DPYSL2 | SNV | Missense_Mutation | novel | c.1117C>T | p.Arg373Trp | p.R373W | protein_coding | deleterious(0) | possibly_damaging(0.791) | TCGA-AA-3877-01 | Colorectum | colon adenocarcinoma | Female | >=65 | I/II | Unknown | Unknown | SD | |
| DPYSL2 | SNV | Missense_Mutation | c.730G>A | p.Val244Met | p.V244M | protein_coding | tolerated(0.08) | benign(0.017) | TCGA-AD-6895-01 | Colorectum | colon adenocarcinoma | Male | >=65 | III/IV | Unknown | Unknown | SD |
| Page: 1 2 3 4 5 6 7 8 |
Top |
Related drugs of malignant transformation related genes |
| Identification of chemicals and drugs interact with genes involved in malignant transfromation |
| (DGIdb 4.0) |
| Entrez ID | Symbol | Category | Interaction Types | Drug Claim Name | Drug Name | PMIDs |
| 1808 | DPYSL2 | NA | LACOSAMIDE | ERLOSAMIDE | ||
| 1808 | DPYSL2 | NA | Lacosamide | ERLOSAMIDE |
| Page: 1 |

Copyright 2023-Present -The University of Texas Health Science Center at Houston |