
|
|||||
|
 | |
| |
| |
| |
| |
| |
|
Gene: DPY30 |
Gene summary for DPY30 |
| Gene information | Species | Human | Gene symbol | DPY30 | Gene ID | 84661 |
| Gene name | dpy-30 histone methyltransferase complex regulatory subunit | |
| Gene Alias | Cps25 | |
| Cytomap | 2p22.3 | |
| Gene Type | protein-coding | GO ID | GO:0006464 | UniProtAcc | Q9C005 |
Top |
Malignant transformation analysis |
| Identification of the aberrant gene expression in precancerous and cancerous lesions by comparing the gene expression of stem-like cells in diseased tissues with normal stem cells |
| Entrez ID | Symbol | Replicates | Species | Organ | Tissue | Adj P-value | Log2FC | Malignancy |
| 84661 | DPY30 | LZE4T | Human | Esophagus | ESCC | 5.43e-15 | 5.69e-01 | 0.0811 |
| 84661 | DPY30 | LZE7T | Human | Esophagus | ESCC | 1.72e-12 | 1.08e+00 | 0.0667 |
| 84661 | DPY30 | LZE8T | Human | Esophagus | ESCC | 7.66e-09 | 3.17e-01 | 0.067 |
| 84661 | DPY30 | LZE20T | Human | Esophagus | ESCC | 4.06e-05 | 3.24e-01 | 0.0662 |
| 84661 | DPY30 | LZE22D1 | Human | Esophagus | HGIN | 3.19e-05 | 5.13e-02 | 0.0595 |
| 84661 | DPY30 | LZE24T | Human | Esophagus | ESCC | 4.81e-18 | 8.29e-01 | 0.0596 |
| 84661 | DPY30 | LZE21T | Human | Esophagus | ESCC | 1.96e-04 | 5.87e-01 | 0.0655 |
| 84661 | DPY30 | LZE6T | Human | Esophagus | ESCC | 1.50e-14 | 1.02e+00 | 0.0845 |
| 84661 | DPY30 | P1T-E | Human | Esophagus | ESCC | 3.03e-06 | 6.90e-01 | 0.0875 |
| 84661 | DPY30 | P2T-E | Human | Esophagus | ESCC | 3.66e-62 | 1.21e+00 | 0.1177 |
| 84661 | DPY30 | P4T-E | Human | Esophagus | ESCC | 3.76e-42 | 1.25e+00 | 0.1323 |
| 84661 | DPY30 | P5T-E | Human | Esophagus | ESCC | 4.78e-46 | 9.07e-01 | 0.1327 |
| 84661 | DPY30 | P8T-E | Human | Esophagus | ESCC | 7.77e-36 | 8.15e-01 | 0.0889 |
| 84661 | DPY30 | P9T-E | Human | Esophagus | ESCC | 2.03e-22 | 5.93e-01 | 0.1131 |
| 84661 | DPY30 | P10T-E | Human | Esophagus | ESCC | 3.24e-46 | 9.47e-01 | 0.116 |
| 84661 | DPY30 | P11T-E | Human | Esophagus | ESCC | 2.02e-18 | 1.09e+00 | 0.1426 |
| 84661 | DPY30 | P12T-E | Human | Esophagus | ESCC | 1.48e-38 | 9.05e-01 | 0.1122 |
| 84661 | DPY30 | P15T-E | Human | Esophagus | ESCC | 8.35e-42 | 1.14e+00 | 0.1149 |
| 84661 | DPY30 | P16T-E | Human | Esophagus | ESCC | 2.98e-60 | 1.21e+00 | 0.1153 |
| 84661 | DPY30 | P17T-E | Human | Esophagus | ESCC | 9.89e-09 | 6.39e-01 | 0.1278 |
| Page: 1 2 3 4 5 6 7 |
| Tissue | Expression Dynamics | Abbreviation |
| Esophagus |  | ESCC: Esophageal squamous cell carcinoma |
| HGIN: High-grade intraepithelial neoplasias | ||
| LGIN: Low-grade intraepithelial neoplasias | ||
| Liver | 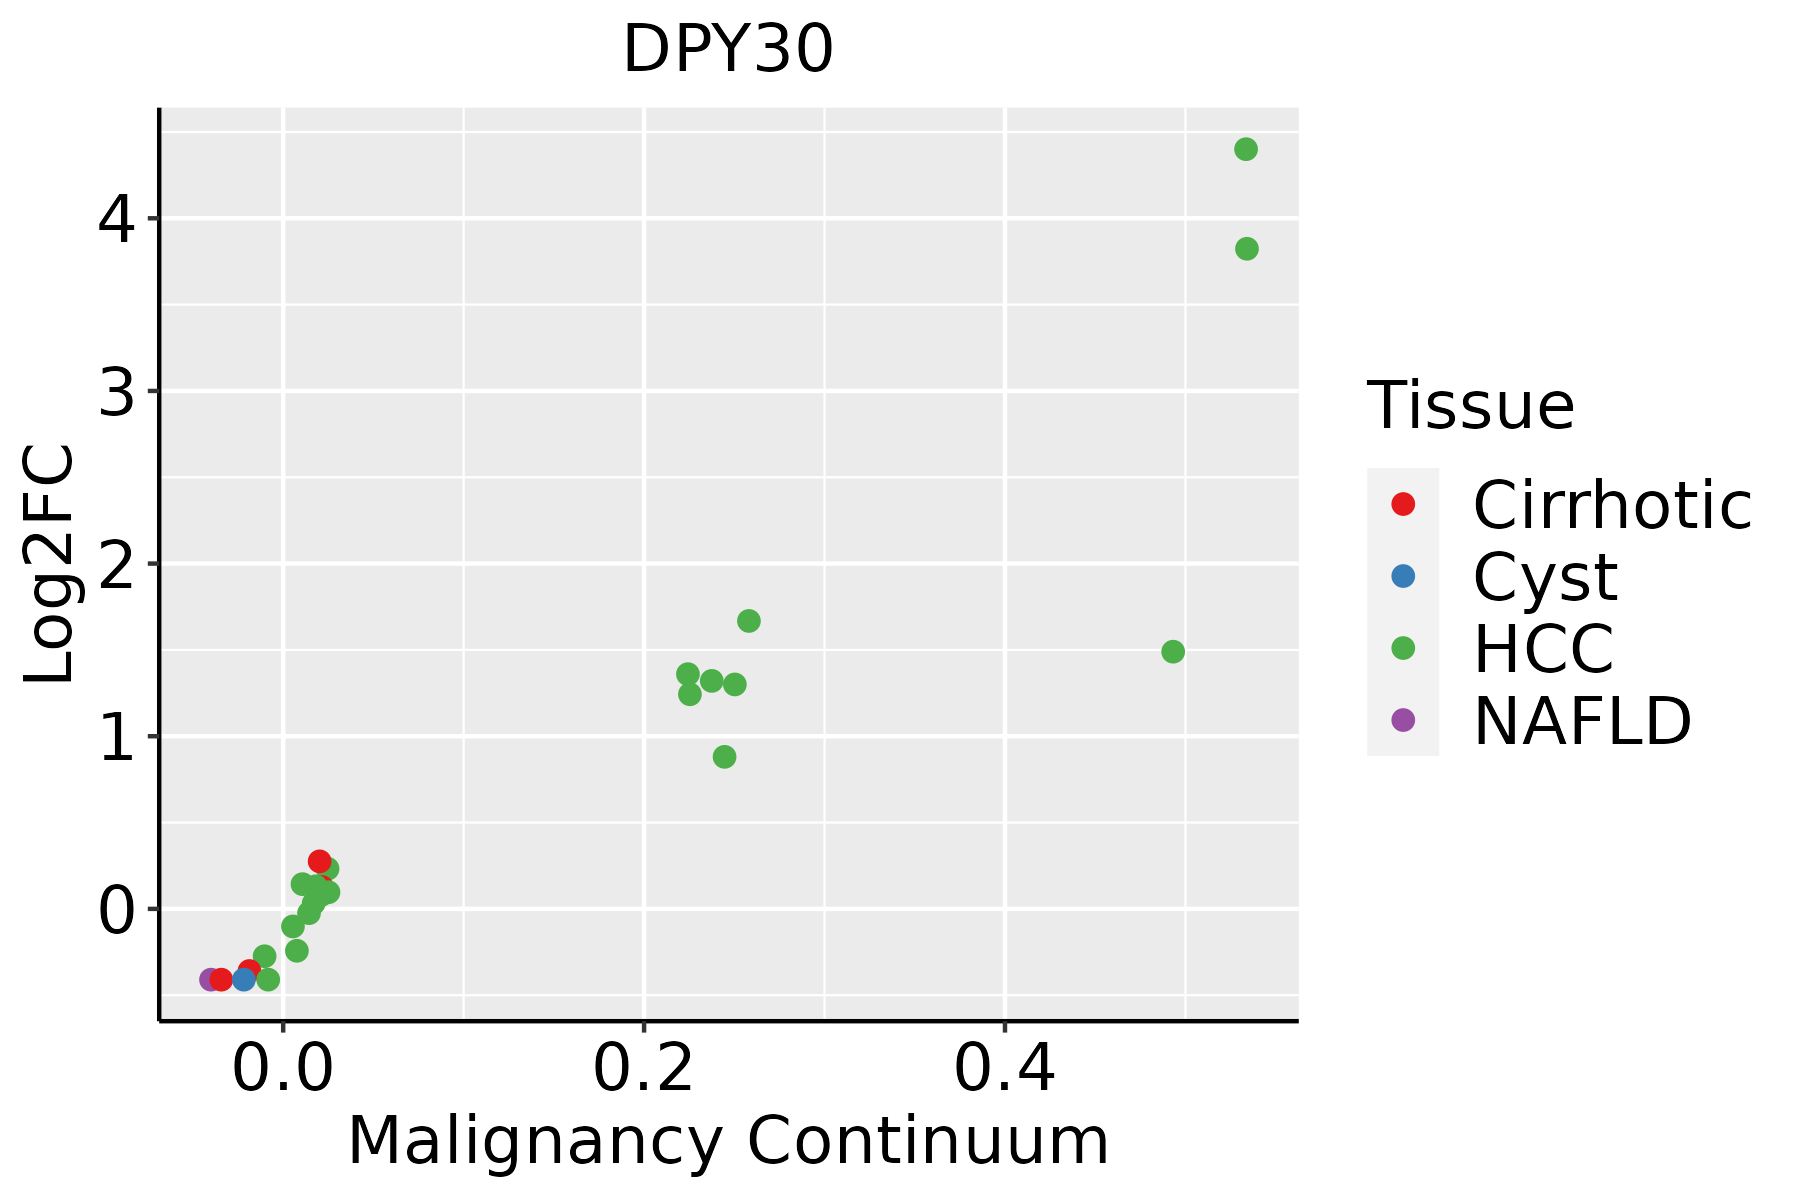 | HCC: Hepatocellular carcinoma |
| NAFLD: Non-alcoholic fatty liver disease | ||
| Oral Cavity | 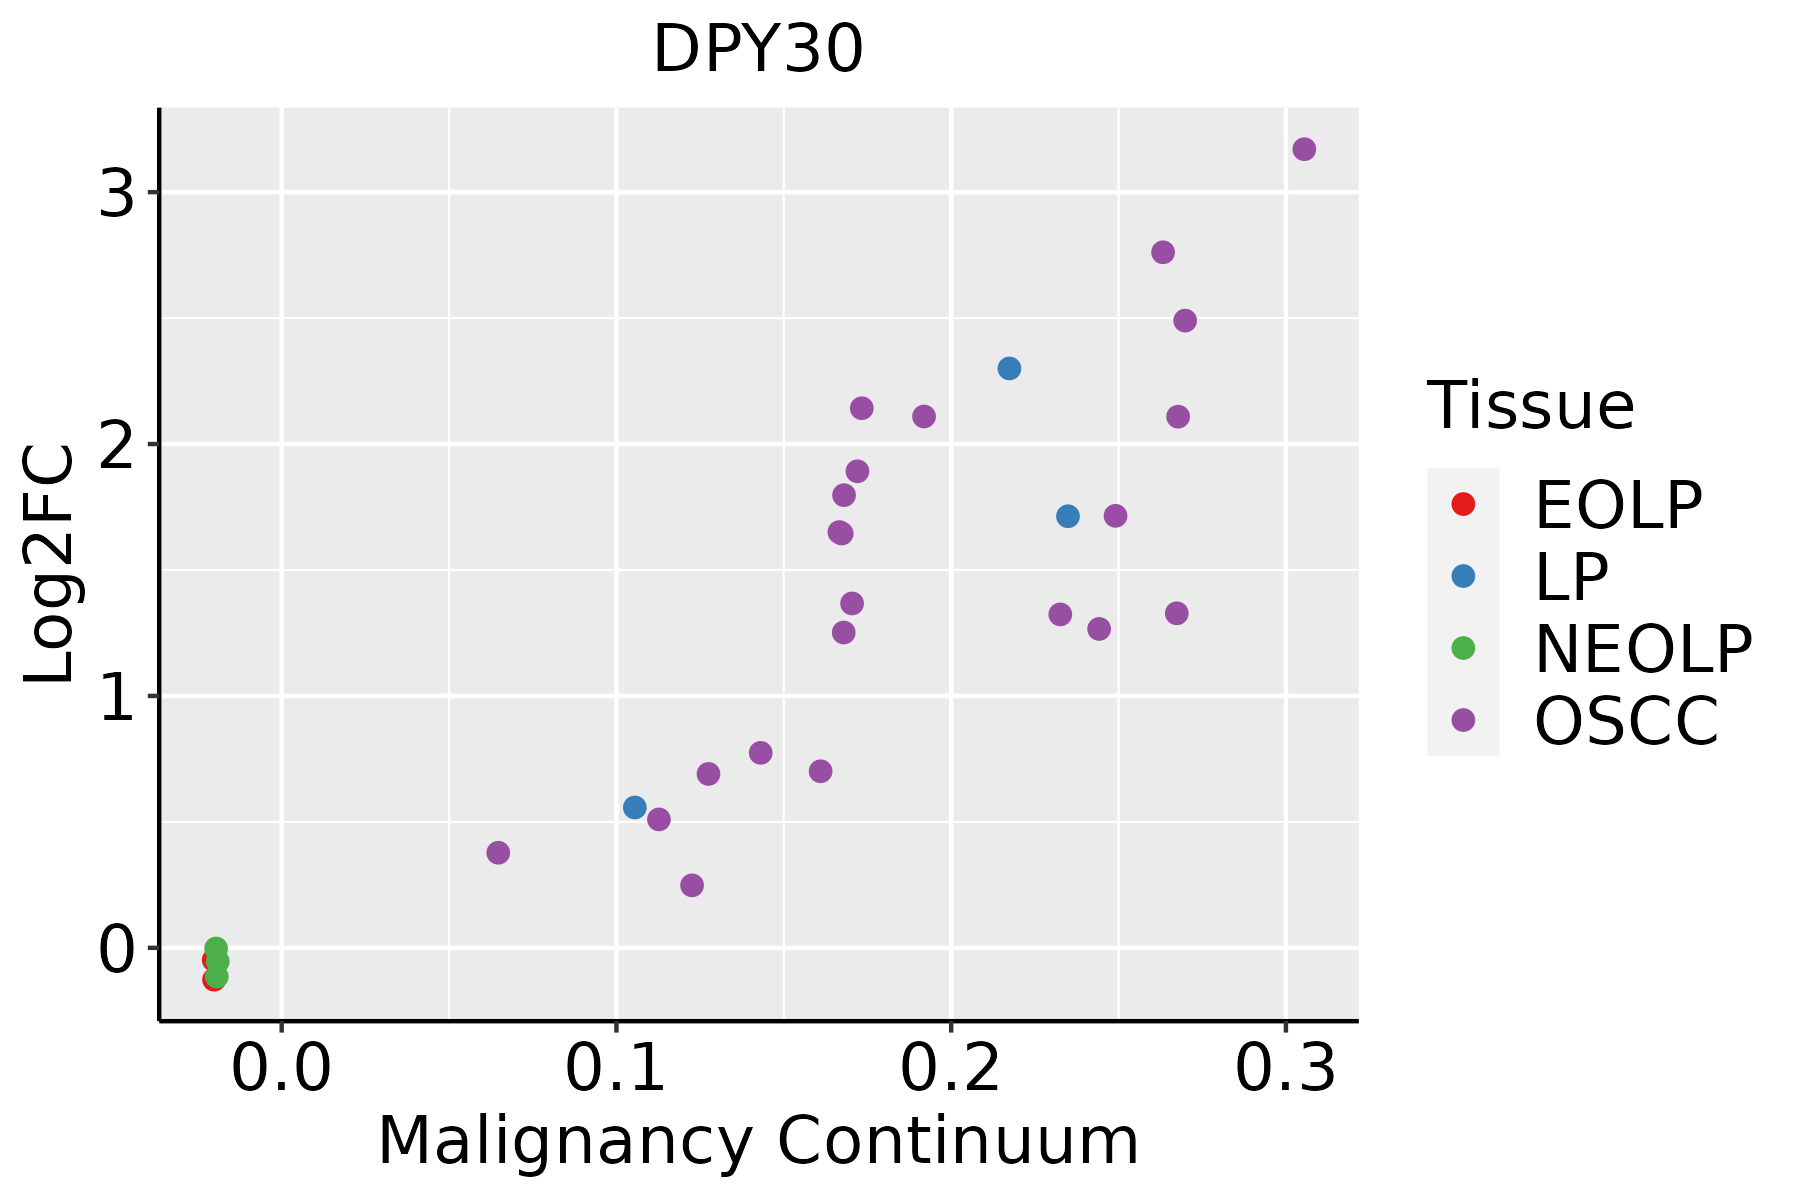 | EOLP: Erosive Oral lichen planus |
| LP: leukoplakia | ||
| NEOLP: Non-erosive oral lichen planus | ||
| OSCC: Oral squamous cell carcinoma | ||
| Prostate |  | BPH: Benign Prostatic Hyperplasia |
| Skin | 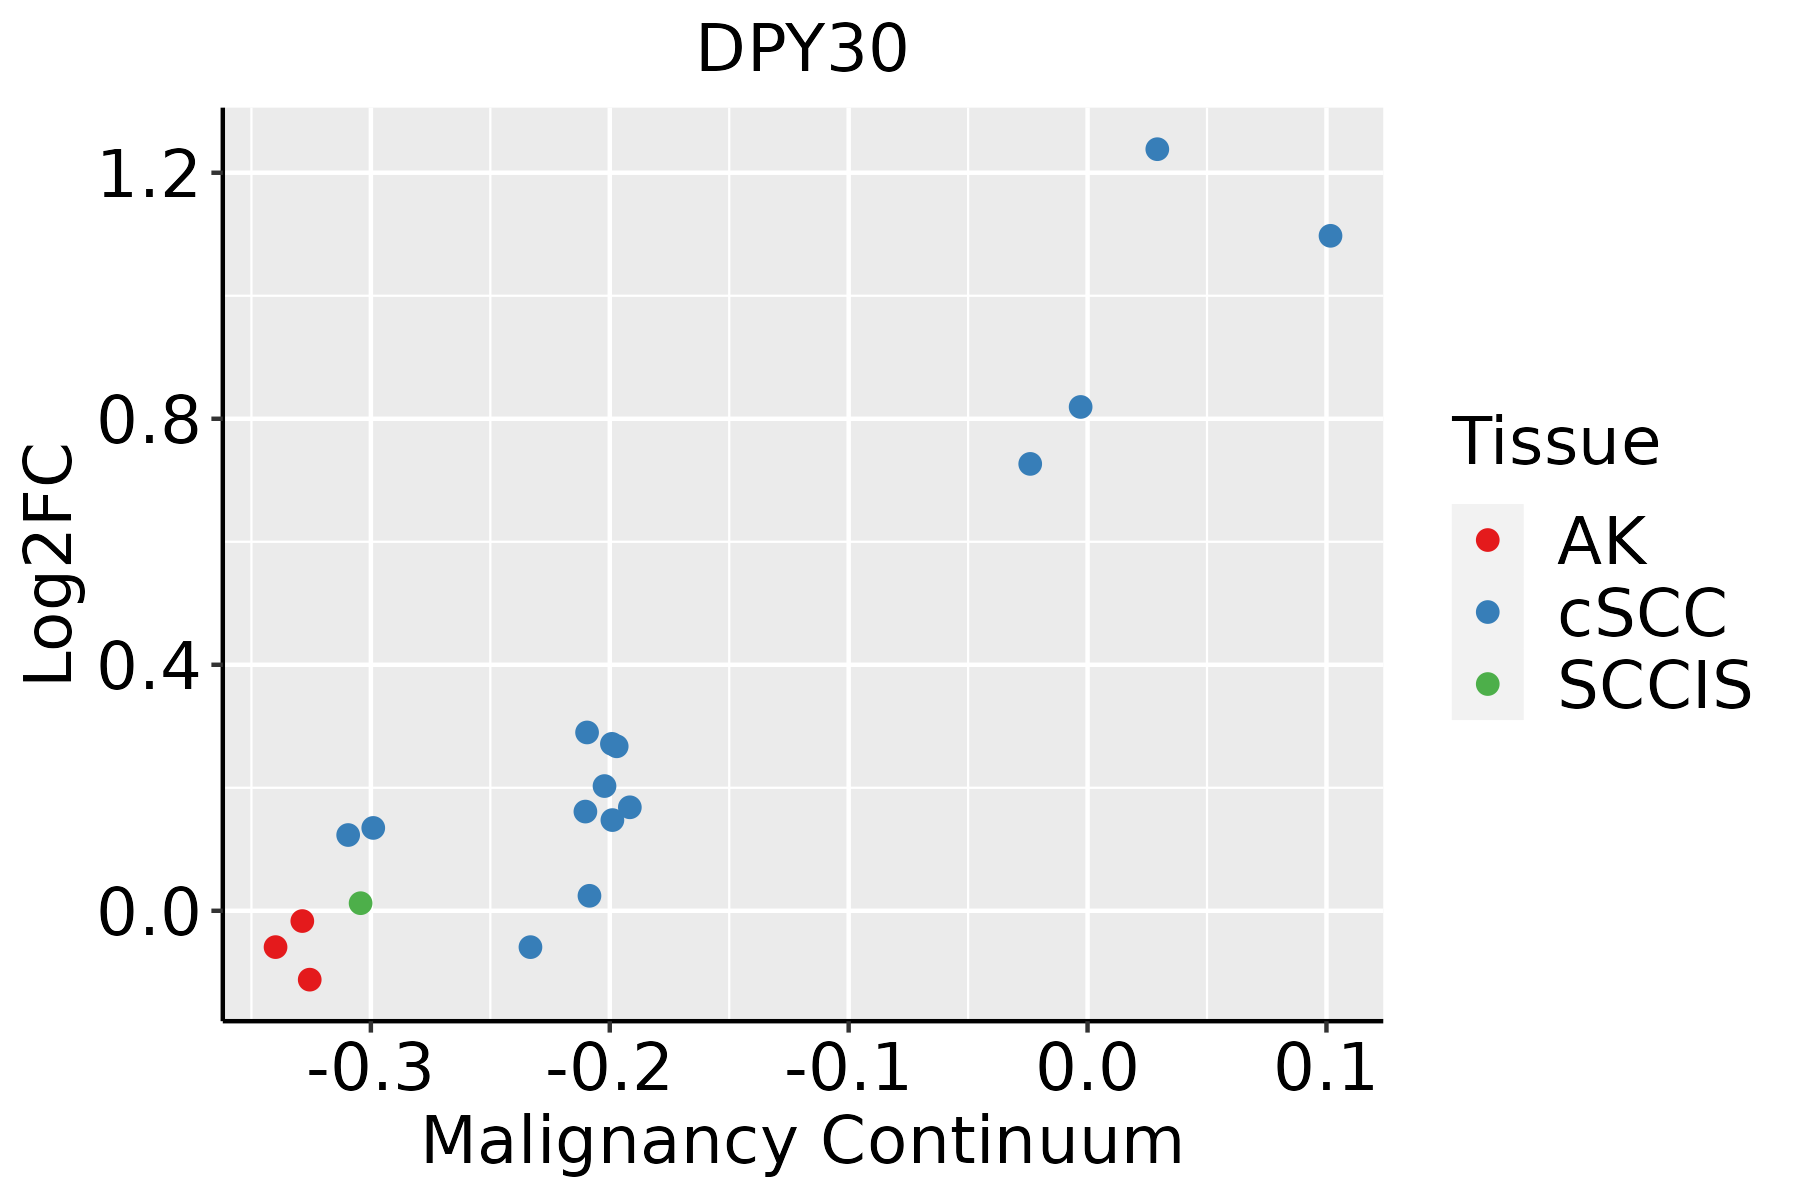 | AK: Actinic keratosis |
| cSCC: Cutaneous squamous cell carcinoma | ||
| SCCIS:squamous cell carcinoma in situ | ||
| Thyroid | 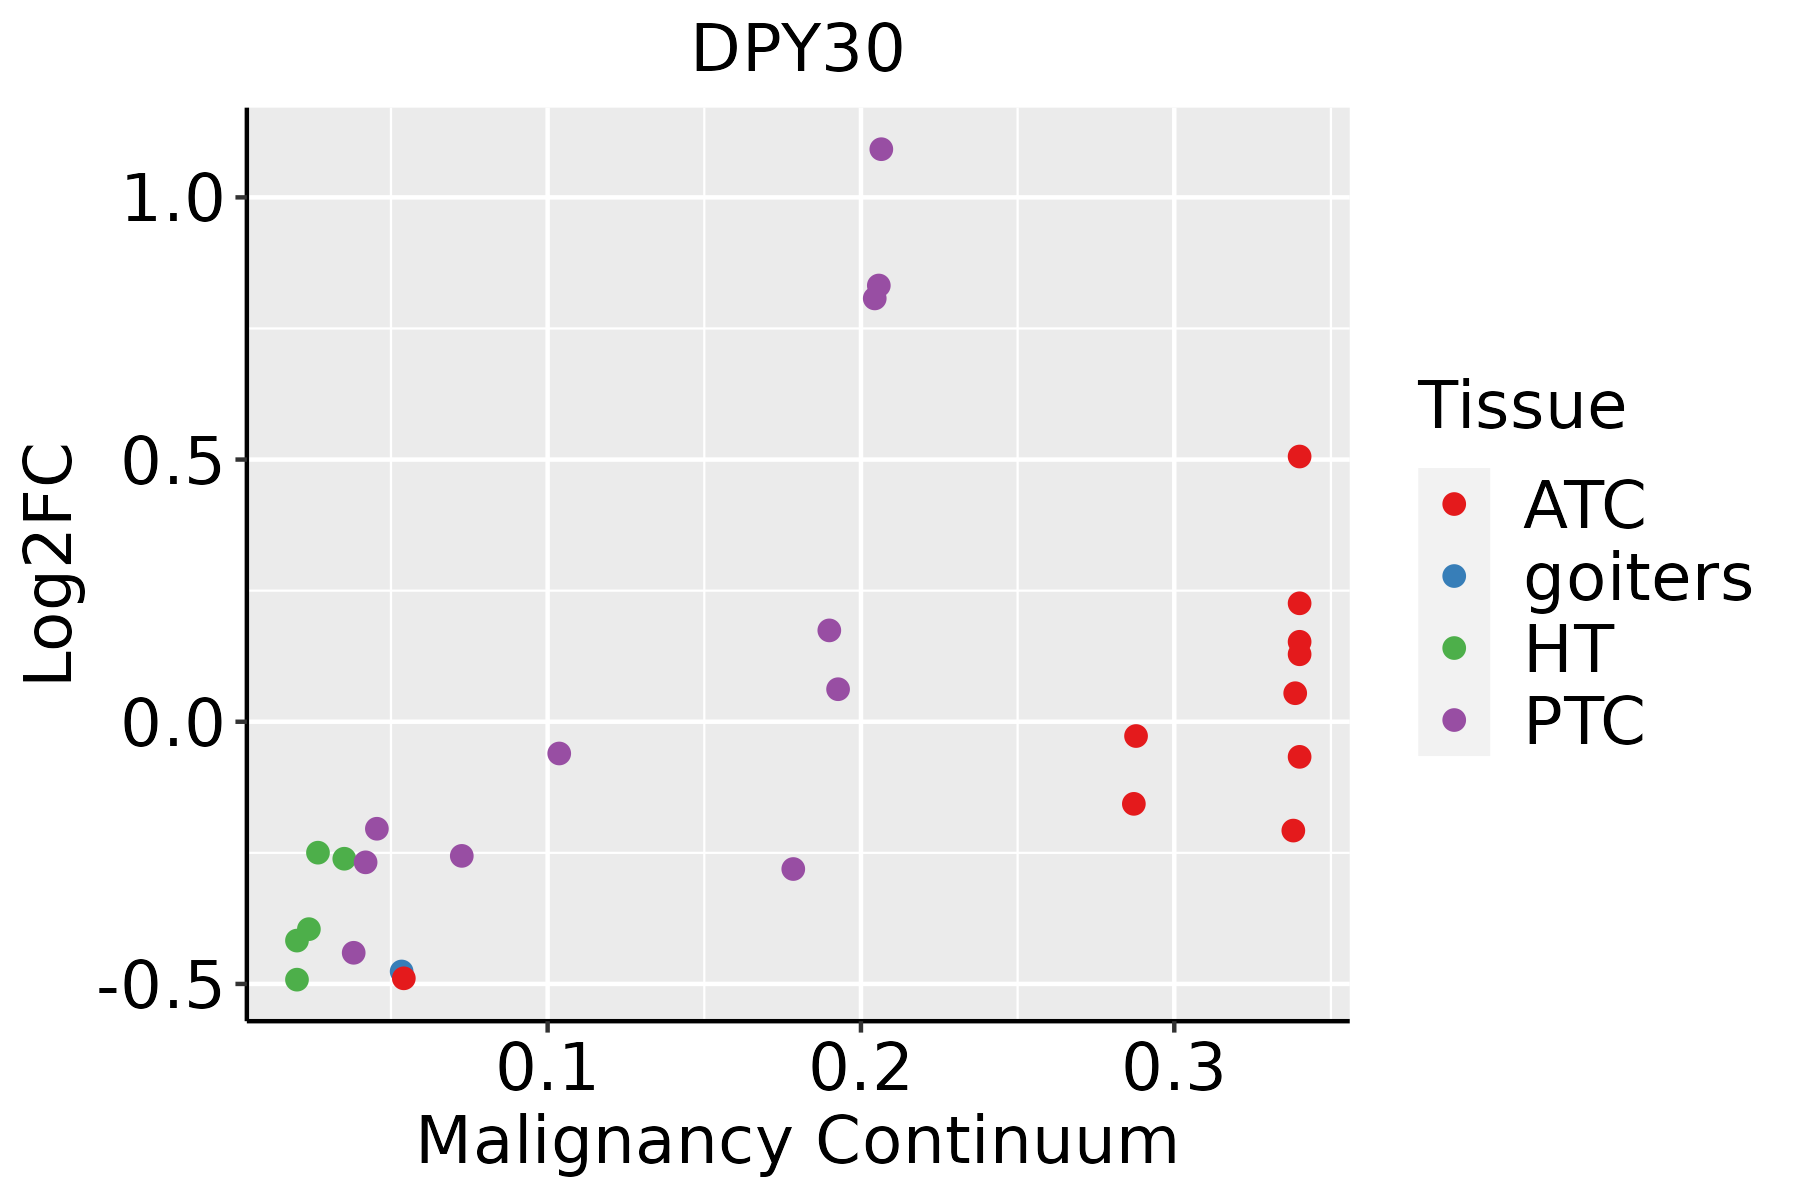 | ATC: Anaplastic thyroid cancer |
| HT: Hashimoto's thyroiditis | ||
| PTC: Papillary thyroid cancer |
| ∗log2FC in expression of this searched gene in stem-like cells from each diseased tissue sample relative to stem-like cells in normal samples in each tissue plotted against the malignancy continuum. Samples are colored based on if they are from different disease stage. |
Top |
Malignant transformation related pathway analysis |
| Find out the enriched GO biological processes and KEGG pathways involved in transition from healthy to precancer to cancer |
| Tissue | Disease Stage | Enriched GO biological Processes |
| Colorectum | AD |  |
| Colorectum | SER |  |
| Colorectum | MSS |  |
| Colorectum | MSI-H |  |
| Colorectum | FAP |  |
| ∗Top 15 enriched GO BP terms are showed in the bar plot of each disease state in each tissue. Each row represents a significant GO biological process which is colored according to the -log10(p.adjust). |
| Page: 1 2 3 4 5 6 7 8 9 |
| GO ID | Tissue | Disease Stage | Description | Gene Ratio | Bg Ratio | pvalue | p.adjust | Count |
| GO:00182057 | Esophagus | HGIN | peptidyl-lysine modification | 88/2587 | 376/18723 | 2.99e-07 | 1.39e-05 | 88 |
| GO:001619710 | Esophagus | HGIN | endosomal transport | 57/2587 | 230/18723 | 5.74e-06 | 1.81e-04 | 57 |
| GO:00165708 | Esophagus | HGIN | histone modification | 92/2587 | 463/18723 | 1.70e-04 | 3.30e-03 | 92 |
| GO:00349688 | Esophagus | HGIN | histone lysine methylation | 27/2587 | 115/18723 | 3.51e-03 | 3.24e-02 | 27 |
| GO:00064798 | Esophagus | HGIN | protein methylation | 38/2587 | 181/18723 | 5.05e-03 | 4.22e-02 | 38 |
| GO:00082138 | Esophagus | HGIN | protein alkylation | 38/2587 | 181/18723 | 5.05e-03 | 4.22e-02 | 38 |
| GO:00180227 | Esophagus | HGIN | peptidyl-lysine methylation | 29/2587 | 131/18723 | 6.22e-03 | 4.95e-02 | 29 |
| GO:001657015 | Esophagus | ESCC | histone modification | 323/8552 | 463/18723 | 2.61e-26 | 7.88e-24 | 323 |
| GO:001820514 | Esophagus | ESCC | peptidyl-lysine modification | 259/8552 | 376/18723 | 3.90e-20 | 5.26e-18 | 259 |
| GO:001619715 | Esophagus | ESCC | endosomal transport | 168/8552 | 230/18723 | 2.28e-17 | 1.93e-15 | 168 |
| GO:00434143 | Esophagus | ESCC | macromolecule methylation | 199/8552 | 316/18723 | 3.44e-10 | 9.57e-09 | 199 |
| GO:00322592 | Esophagus | ESCC | methylation | 222/8552 | 364/18723 | 2.26e-09 | 5.09e-08 | 222 |
| GO:000647914 | Esophagus | ESCC | protein methylation | 115/8552 | 181/18723 | 9.07e-07 | 1.16e-05 | 115 |
| GO:000821314 | Esophagus | ESCC | protein alkylation | 115/8552 | 181/18723 | 9.07e-07 | 1.16e-05 | 115 |
| GO:00165718 | Esophagus | ESCC | histone methylation | 89/8552 | 141/18723 | 2.17e-05 | 1.87e-04 | 89 |
| GO:003496814 | Esophagus | ESCC | histone lysine methylation | 72/8552 | 115/18723 | 1.85e-04 | 1.18e-03 | 72 |
| GO:001802214 | Esophagus | ESCC | peptidyl-lysine methylation | 79/8552 | 131/18723 | 5.17e-04 | 2.86e-03 | 79 |
| GO:001619711 | Liver | Cirrhotic | endosomal transport | 93/4634 | 230/18723 | 1.01e-07 | 2.93e-06 | 93 |
| GO:00182051 | Liver | Cirrhotic | peptidyl-lysine modification | 134/4634 | 376/18723 | 1.29e-06 | 2.59e-05 | 134 |
| GO:001657011 | Liver | Cirrhotic | histone modification | 154/4634 | 463/18723 | 1.92e-05 | 2.57e-04 | 154 |
| Page: 1 2 3 4 5 |
| Pathway ID | Tissue | Disease Stage | Description | Gene Ratio | Bg Ratio | pvalue | p.adjust | qvalue | Count |
| Page: 1 |
Top |
Cell-cell communication analysis |
| Identification of potential cell-cell interactions between two cell types and their ligand-receptor pairs for different disease states |
| Ligand | Receptor | LRpair | Pathway | Tissue | Disease Stage |
| Page: 1 |
Top |
Single-cell gene regulatory network inference analysis |
| Find out the significant the regulons (TFs) and the target genes of each regulon across cell types for different disease states |
| TF | Cell Type | Tissue | Disease Stage | Target Gene | RSS | Regulon Activity |
| ∗The dot plots of a searched regulon are shown for all cell subpopulations in each disease state of each tissue based on the regulon specific score inferred using pySCENIC and by calculating the average expression. |
| Page: 1 |
Top |
Somatic mutation of malignant transformation related genes |
| Annotation of somatic variants for genes involved in malignant transformation |
| Hugo Symbol | Variant Class | Variant Classification | dbSNP RS | HGVSc | HGVSp | HGVSp Short | SWISSPROT | BIOTYPE | SIFT | PolyPhen | Tumor Sample Barcode | Tissue | Histology | Sex | Age | Stage | Therapy Types | Drugs | Outcome |
| DPY30 | SNV | Missense_Mutation | c.192N>G | p.Ile64Met | p.I64M | Q9C005 | protein_coding | deleterious(0) | possibly_damaging(0.714) | TCGA-IR-A3LK-01 | Cervix | cervical & endocervical cancer | Female | >=65 | I/II | Chemotherapy | cisplatin | PD | |
| DPY30 | SNV | Missense_Mutation | c.86G>A | p.Arg29Lys | p.R29K | Q9C005 | protein_coding | tolerated(0.88) | benign(0.015) | TCGA-AA-3510-01 | Colorectum | colon adenocarcinoma | Male | >=65 | I/II | Unknown | Unknown | SD | |
| DPY30 | SNV | Missense_Mutation | c.61N>C | p.Tyr21His | p.Y21H | Q9C005 | protein_coding | tolerated(0.3) | benign(0.421) | TCGA-AA-3672-01 | Colorectum | colon adenocarcinoma | Female | >=65 | III/IV | Unknown | Unknown | SD | |
| DPY30 | SNV | Missense_Mutation | c.86G>A | p.Arg29Lys | p.R29K | Q9C005 | protein_coding | tolerated(0.88) | benign(0.015) | TCGA-AA-A00N-01 | Colorectum | colon adenocarcinoma | Male | >=65 | I/II | Unknown | Unknown | PD | |
| DPY30 | SNV | Missense_Mutation | c.235N>C | p.Asn79His | p.N79H | Q9C005 | protein_coding | deleterious(0) | possibly_damaging(0.701) | TCGA-AA-A010-01 | Colorectum | colon adenocarcinoma | Female | <65 | I/II | Chemotherapy | folinic | CR | |
| DPY30 | SNV | Missense_Mutation | c.86N>T | p.Arg29Ile | p.R29I | Q9C005 | protein_coding | deleterious(0.01) | possibly_damaging(0.809) | TCGA-A5-A0G2-01 | Endometrium | uterine corpus endometrioid carcinoma | Female | <65 | III/IV | Unknown | Unknown | SD | |
| DPY30 | SNV | Missense_Mutation | c.46N>C | p.Asn16His | p.N16H | Q9C005 | protein_coding | deleterious(0) | possibly_damaging(0.69) | TCGA-AP-A056-01 | Endometrium | uterine corpus endometrioid carcinoma | Female | <65 | I/II | Unknown | Unknown | SD | |
| DPY30 | SNV | Missense_Mutation | novel | c.175C>G | p.Gln59Glu | p.Q59E | Q9C005 | protein_coding | deleterious(0.03) | benign(0.033) | TCGA-98-8021-01 | Lung | lung squamous cell carcinoma | Female | >=65 | I/II | Unknown | Unknown | PD |
| Page: 1 |
Top |
Related drugs of malignant transformation related genes |
| Identification of chemicals and drugs interact with genes involved in malignant transfromation |
| (DGIdb 4.0) |
| Entrez ID | Symbol | Category | Interaction Types | Drug Claim Name | Drug Name | PMIDs |
| Page: 1 |

Copyright 2023-Present -The University of Texas Health Science Center at Houston |