
|
|||||
|
 | |
| |
| |
| |
| |
| |
|
Gene: DPT |
Gene summary for DPT |
| Gene information | Species | Human | Gene symbol | DPT | Gene ID | 1805 |
| Gene name | dermatopontin | |
| Gene Alias | TRAMP | |
| Cytomap | 1q24.2 | |
| Gene Type | protein-coding | GO ID | GO:0007155 | UniProtAcc | Q07507 |
Top |
Malignant transformation analysis |
| Identification of the aberrant gene expression in precancerous and cancerous lesions by comparing the gene expression of stem-like cells in diseased tissues with normal stem cells |
| Entrez ID | Symbol | Replicates | Species | Organ | Tissue | Adj P-value | Log2FC | Malignancy |
| 1805 | DPT | P1_S1_AK | Human | Skin | AK | 2.83e-26 | -6.96e-01 | -0.3399 |
| 1805 | DPT | P2_S3_AK | Human | Skin | AK | 1.64e-25 | -6.99e-01 | -0.3287 |
| 1805 | DPT | P2_S4_SCCIS | Human | Skin | SCCIS | 9.14e-22 | -6.92e-01 | -0.3043 |
| 1805 | DPT | P3_S6_AK | Human | Skin | AK | 1.97e-27 | -7.01e-01 | -0.3256 |
| 1805 | DPT | P4_S8_cSCC | Human | Skin | cSCC | 1.60e-17 | -7.01e-01 | -0.3095 |
| 1805 | DPT | P5_S10_cSCC | Human | Skin | cSCC | 4.80e-27 | -7.01e-01 | -0.299 |
| 1805 | DPT | P1_cSCC | Human | Skin | cSCC | 3.84e-15 | -6.92e-01 | 0.0292 |
| 1805 | DPT | P2_cSCC | Human | Skin | cSCC | 1.01e-30 | -7.01e-01 | -0.024 |
| 1805 | DPT | P4_cSCC | Human | Skin | cSCC | 1.28e-23 | -7.01e-01 | -0.00290000000000005 |
| 1805 | DPT | P10_cSCC | Human | Skin | cSCC | 5.71e-23 | -6.95e-01 | 0.1017 |
| 1805 | DPT | cSCC_p1 | Human | Skin | cSCC | 1.64e-25 | -7.01e-01 | -0.1916 |
| 1805 | DPT | cSCC_p10 | Human | Skin | cSCC | 4.80e-27 | -7.01e-01 | -0.2095 |
| 1805 | DPT | cSCC_p11 | Human | Skin | cSCC | 1.17e-26 | -7.01e-01 | -0.2102 |
| 1805 | DPT | cSCC_p3 | Human | Skin | cSCC | 1.93e-21 | -6.68e-01 | -0.2085 |
| 1805 | DPT | cSCC_p4 | Human | Skin | cSCC | 1.97e-27 | -6.99e-01 | -0.2022 |
| 1805 | DPT | cSCC_p6 | Human | Skin | cSCC | 1.17e-26 | -7.01e-01 | -0.1989 |
| 1805 | DPT | cSCC_p7 | Human | Skin | cSCC | 1.97e-27 | -7.01e-01 | -0.2332 |
| 1805 | DPT | cSCC_p8 | Human | Skin | cSCC | 3.93e-24 | -6.99e-01 | -0.1971 |
| 1805 | DPT | cSCC_p9 | Human | Skin | cSCC | 4.80e-27 | -7.01e-01 | -0.1991 |
| 1805 | DPT | ATC12 | Human | Thyroid | ATC | 2.74e-24 | 6.19e-01 | 0.34 |
| Page: 1 2 |
| Tissue | Expression Dynamics | Abbreviation |
| Skin | 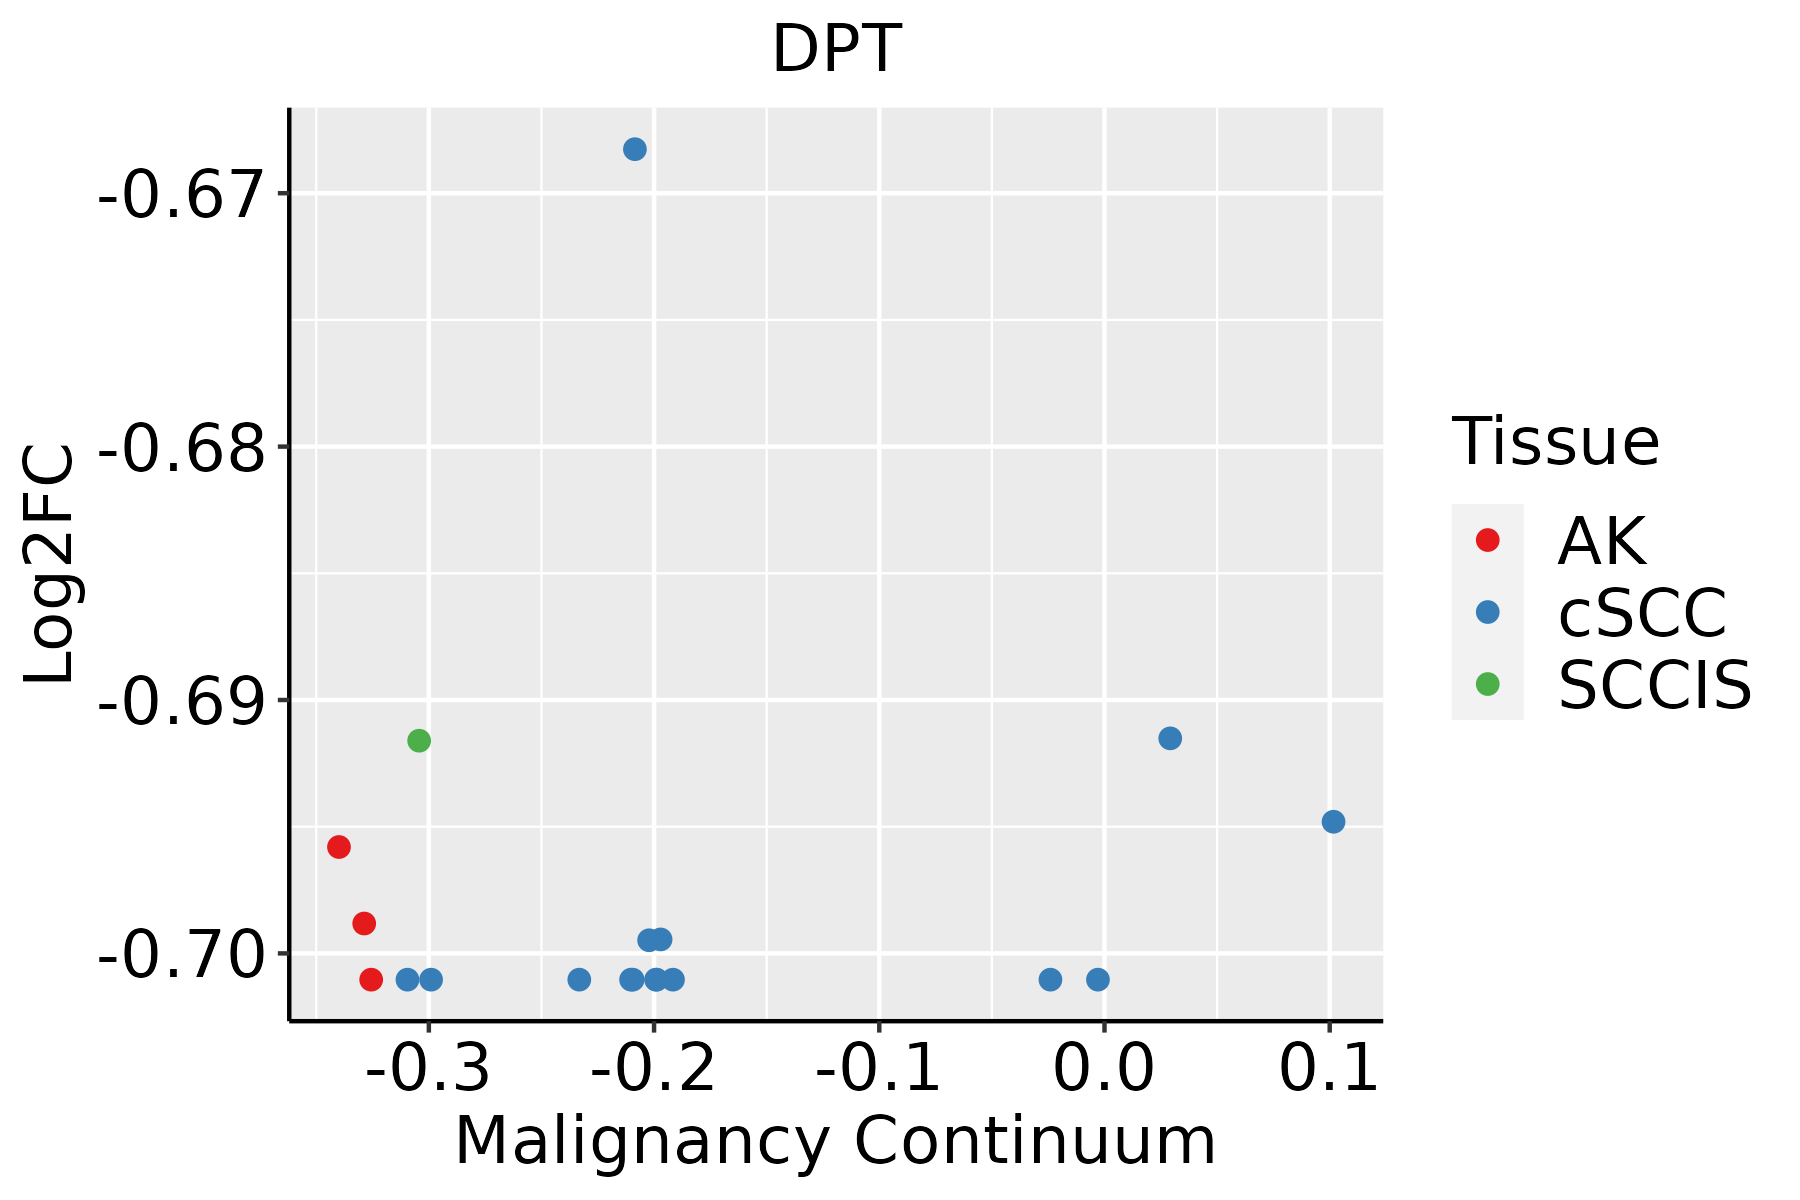 | AK: Actinic keratosis |
| cSCC: Cutaneous squamous cell carcinoma | ||
| SCCIS:squamous cell carcinoma in situ | ||
| Thyroid | 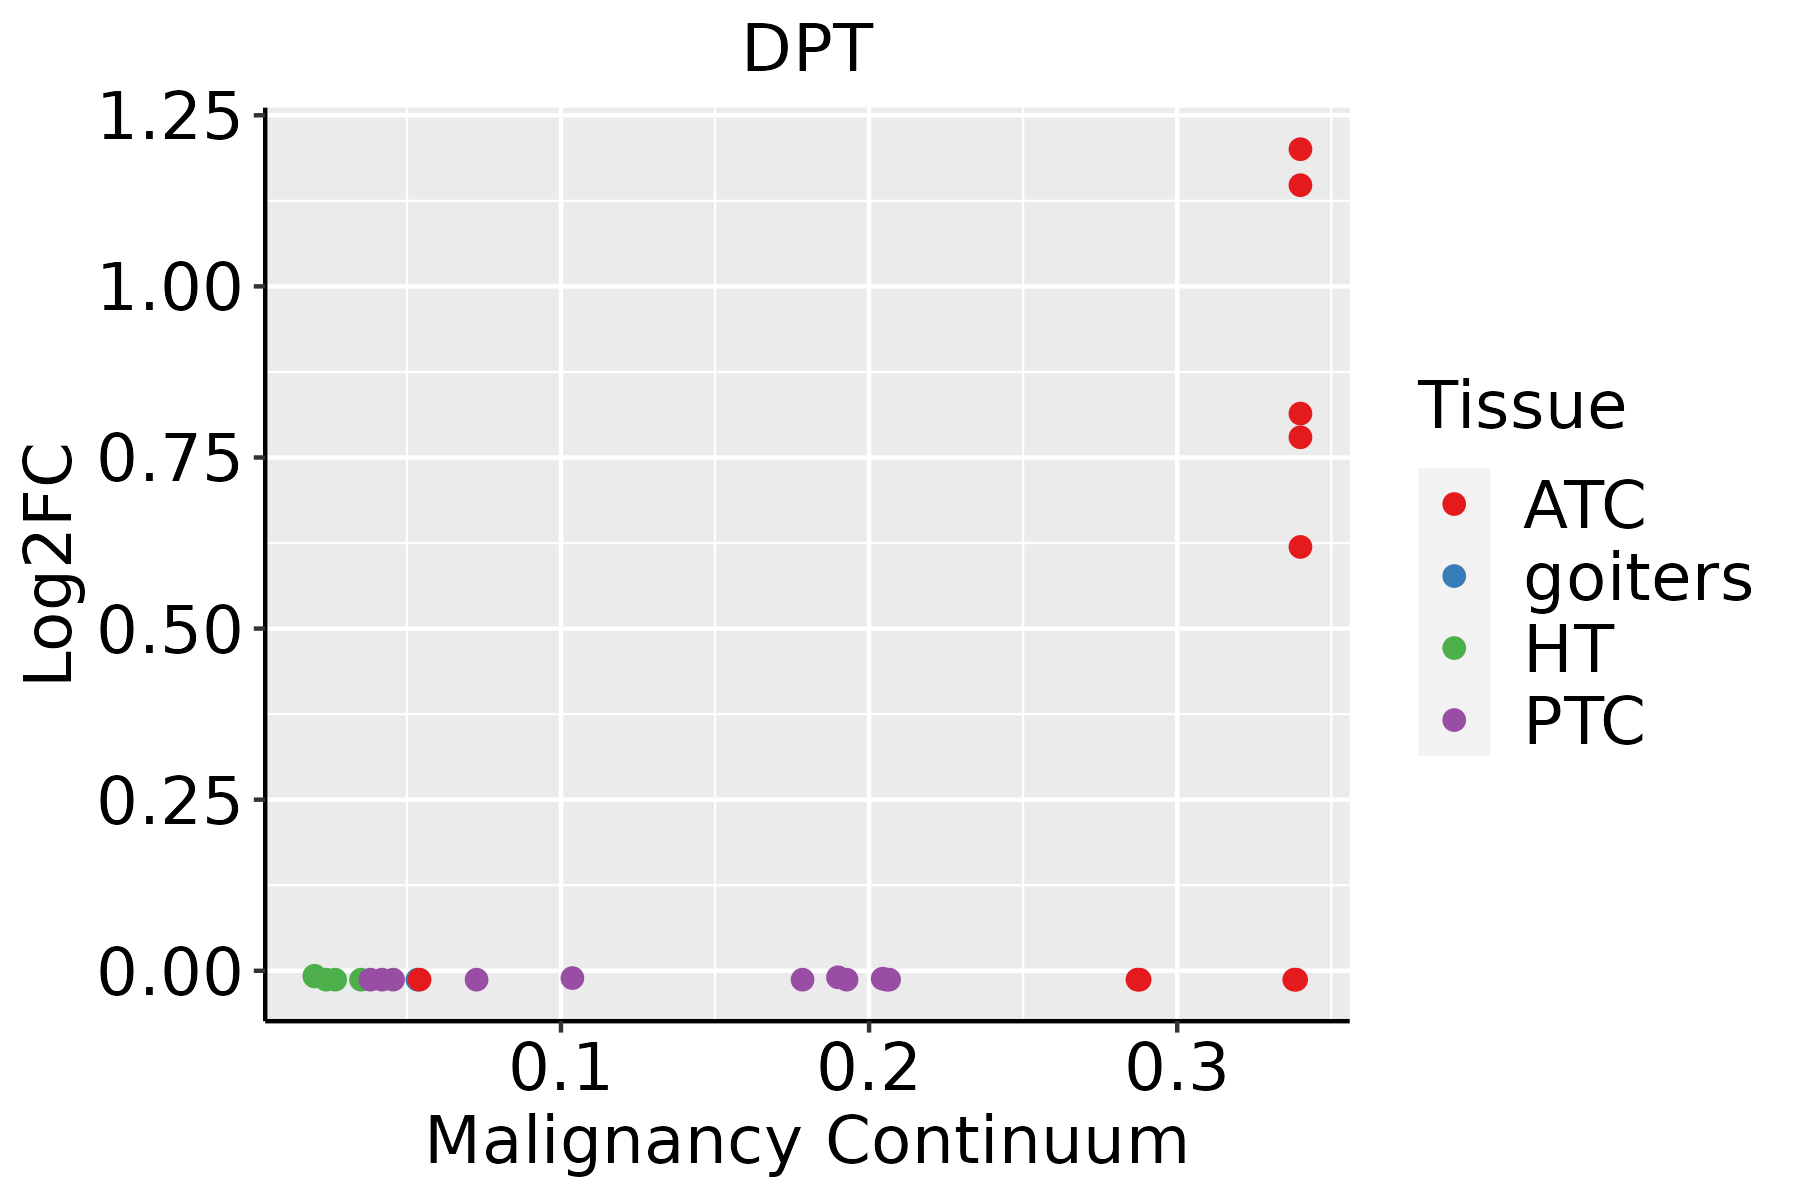 | ATC: Anaplastic thyroid cancer |
| HT: Hashimoto's thyroiditis | ||
| PTC: Papillary thyroid cancer |
| ∗log2FC in expression of this searched gene in stem-like cells from each diseased tissue sample relative to stem-like cells in normal samples in each tissue plotted against the malignancy continuum. Samples are colored based on if they are from different disease stage. |
Top |
Malignant transformation related pathway analysis |
| Find out the enriched GO biological processes and KEGG pathways involved in transition from healthy to precancer to cancer |
| Tissue | Disease Stage | Enriched GO biological Processes |
| Colorectum | AD |  |
| Colorectum | SER |  |
| Colorectum | MSS |  |
| Colorectum | MSI-H |  |
| Colorectum | FAP |  |
| ∗Top 15 enriched GO BP terms are showed in the bar plot of each disease state in each tissue. Each row represents a significant GO biological process which is colored according to the -log10(p.adjust). |
| Page: 1 2 3 4 5 6 7 8 9 |
| GO ID | Tissue | Disease Stage | Description | Gene Ratio | Bg Ratio | pvalue | p.adjust | Count |
| GO:00301985 | Skin | SCCIS | extracellular matrix organization | 32/919 | 301/18723 | 3.46e-05 | 9.17e-04 | 32 |
| GO:00430625 | Skin | SCCIS | extracellular structure organization | 32/919 | 302/18723 | 3.69e-05 | 9.65e-04 | 32 |
| GO:00452295 | Skin | SCCIS | external encapsulating structure organization | 32/919 | 304/18723 | 4.20e-05 | 1.06e-03 | 32 |
| GO:00301994 | Skin | SCCIS | collagen fibril organization | 11/919 | 61/18723 | 1.65e-04 | 3.30e-03 | 11 |
| GO:003019812 | Thyroid | ATC | extracellular matrix organization | 152/6293 | 301/18723 | 8.63e-10 | 2.24e-08 | 152 |
| GO:004306212 | Thyroid | ATC | extracellular structure organization | 152/6293 | 302/18723 | 1.17e-09 | 2.94e-08 | 152 |
| GO:004522912 | Thyroid | ATC | external encapsulating structure organization | 152/6293 | 304/18723 | 2.11e-09 | 5.08e-08 | 152 |
| GO:003019911 | Thyroid | ATC | collagen fibril organization | 43/6293 | 61/18723 | 4.24e-09 | 9.57e-08 | 43 |
| Page: 1 |
| Pathway ID | Tissue | Disease Stage | Description | Gene Ratio | Bg Ratio | pvalue | p.adjust | qvalue | Count |
| Page: 1 |
Top |
Cell-cell communication analysis |
| Identification of potential cell-cell interactions between two cell types and their ligand-receptor pairs for different disease states |
| Ligand | Receptor | LRpair | Pathway | Tissue | Disease Stage |
| Page: 1 |
Top |
Single-cell gene regulatory network inference analysis |
| Find out the significant the regulons (TFs) and the target genes of each regulon across cell types for different disease states |
| TF | Cell Type | Tissue | Disease Stage | Target Gene | RSS | Regulon Activity |
| ∗The dot plots of a searched regulon are shown for all cell subpopulations in each disease state of each tissue based on the regulon specific score inferred using pySCENIC and by calculating the average expression. |
| Page: 1 |
Top |
Somatic mutation of malignant transformation related genes |
| Annotation of somatic variants for genes involved in malignant transformation |
| Hugo Symbol | Variant Class | Variant Classification | dbSNP RS | HGVSc | HGVSp | HGVSp Short | SWISSPROT | BIOTYPE | SIFT | PolyPhen | Tumor Sample Barcode | Tissue | Histology | Sex | Age | Stage | Therapy Types | Drugs | Outcome |
| DPT | SNV | Missense_Mutation | rs753775270 | c.388T>G | p.Phe130Val | p.F130V | Q07507 | protein_coding | deleterious(0) | probably_damaging(0.979) | TCGA-AC-A23H-01 | Breast | breast invasive carcinoma | Female | >=65 | I/II | Unknown | Unknown | PD |
| DPT | SNV | Missense_Mutation | novel | c.594T>G | p.Phe198Leu | p.F198L | Q07507 | protein_coding | deleterious_low_confidence(0.01) | probably_damaging(0.953) | TCGA-AN-A046-01 | Breast | breast invasive carcinoma | Female | >=65 | I/II | Unknown | Unknown | SD |
| DPT | SNV | Missense_Mutation | c.368N>A | p.Val123Glu | p.V123E | Q07507 | protein_coding | tolerated(0.78) | probably_damaging(0.994) | TCGA-EW-A1J1-01 | Breast | breast invasive carcinoma | Female | <65 | I/II | Chemotherapy | taxotere | SD | |
| DPT | SNV | Missense_Mutation | rs199993492 | c.382T>C | p.Trp128Arg | p.W128R | Q07507 | protein_coding | deleterious(0) | probably_damaging(0.997) | TCGA-A6-5665-01 | Colorectum | colon adenocarcinoma | Female | >=65 | I/II | Unknown | Unknown | PD |
| DPT | SNV | Missense_Mutation | c.157G>T | p.Gly53Trp | p.G53W | Q07507 | protein_coding | deleterious(0) | probably_damaging(1) | TCGA-AA-3710-01 | Colorectum | colon adenocarcinoma | Female | >=65 | I/II | Unknown | Unknown | SD | |
| DPT | SNV | Missense_Mutation | novel | c.593N>C | p.Phe198Ser | p.F198S | Q07507 | protein_coding | deleterious_low_confidence(0) | probably_damaging(0.986) | TCGA-AJ-A3EL-01 | Endometrium | uterine corpus endometrioid carcinoma | Female | <65 | I/II | Unknown | Unknown | SD |
| DPT | SNV | Missense_Mutation | novel | c.201N>C | p.Glu67Asp | p.E67D | Q07507 | protein_coding | tolerated(0.25) | benign(0.086) | TCGA-AJ-A3EL-01 | Endometrium | uterine corpus endometrioid carcinoma | Female | <65 | I/II | Unknown | Unknown | SD |
| DPT | SNV | Missense_Mutation | novel | c.302A>G | p.Glu101Gly | p.E101G | Q07507 | protein_coding | deleterious(0.04) | possibly_damaging(0.726) | TCGA-AP-A051-01 | Endometrium | uterine corpus endometrioid carcinoma | Female | >=65 | I/II | Unknown | Unknown | SD |
| DPT | SNV | Missense_Mutation | novel | c.26N>G | p.Leu9Arg | p.L9R | Q07507 | protein_coding | deleterious_low_confidence(0.01) | possibly_damaging(0.7) | TCGA-BK-A6W3-01 | Endometrium | uterine corpus endometrioid carcinoma | Female | <65 | I/II | Unknown | Unknown | SD |
| DPT | SNV | Missense_Mutation | novel | c.88N>C | p.Tyr30His | p.Y30H | Q07507 | protein_coding | tolerated(0.1) | benign(0.001) | TCGA-D1-A103-01 | Endometrium | uterine corpus endometrioid carcinoma | Female | >=65 | I/II | Unknown | Unknown | SD |
| Page: 1 2 3 |
Top |
Related drugs of malignant transformation related genes |
| Identification of chemicals and drugs interact with genes involved in malignant transfromation |
| (DGIdb 4.0) |
| Entrez ID | Symbol | Category | Interaction Types | Drug Claim Name | Drug Name | PMIDs |
| Page: 1 |

Copyright 2023-Present -The University of Texas Health Science Center at Houston |