
|
|||||
|
 | |
| |
| |
| |
| |
| |
|
Gene: DPP9 |
Gene summary for DPP9 |
| Gene information | Species | Human | Gene symbol | DPP9 | Gene ID | 91039 |
| Gene name | dipeptidyl peptidase 9 | |
| Gene Alias | DP9 | |
| Cytomap | 19p13.3 | |
| Gene Type | protein-coding | GO ID | GO:0006508 | UniProtAcc | Q86TI2 |
Top |
Malignant transformation analysis |
| Identification of the aberrant gene expression in precancerous and cancerous lesions by comparing the gene expression of stem-like cells in diseased tissues with normal stem cells |
| Entrez ID | Symbol | Replicates | Species | Organ | Tissue | Adj P-value | Log2FC | Malignancy |
| 91039 | DPP9 | HTA11_3410_2000001011 | Human | Colorectum | AD | 2.15e-02 | 6.63e-02 | 0.0155 |
| 91039 | DPP9 | HTA11_2487_2000001011 | Human | Colorectum | SER | 1.77e-02 | 4.19e-01 | -0.1808 |
| 91039 | DPP9 | HTA11_347_2000001011 | Human | Colorectum | AD | 7.60e-12 | 4.30e-01 | -0.1954 |
| 91039 | DPP9 | HTA11_83_2000001011 | Human | Colorectum | SER | 8.97e-04 | 5.01e-01 | -0.1526 |
| 91039 | DPP9 | HTA11_696_2000001011 | Human | Colorectum | AD | 3.20e-06 | 3.99e-01 | -0.1464 |
| 91039 | DPP9 | HTA11_1391_2000001011 | Human | Colorectum | AD | 3.63e-07 | 5.03e-01 | -0.059 |
| 91039 | DPP9 | A015-C-203 | Human | Colorectum | FAP | 2.18e-04 | -7.91e-02 | -0.1294 |
| 91039 | DPP9 | A002-C-205 | Human | Colorectum | FAP | 5.47e-04 | -1.47e-01 | -0.1236 |
| 91039 | DPP9 | A015-C-104 | Human | Colorectum | FAP | 1.75e-06 | -3.11e-02 | -0.1899 |
| 91039 | DPP9 | A002-C-016 | Human | Colorectum | FAP | 1.97e-03 | -1.77e-01 | 0.0521 |
| 91039 | DPP9 | A002-C-116 | Human | Colorectum | FAP | 8.97e-07 | -1.20e-01 | -0.0452 |
| 91039 | DPP9 | A018-E-020 | Human | Colorectum | FAP | 4.44e-03 | -1.77e-01 | -0.2034 |
| 91039 | DPP9 | F034 | Human | Colorectum | FAP | 1.55e-03 | -1.34e-01 | -0.0665 |
| 91039 | DPP9 | LZE4T | Human | Esophagus | ESCC | 3.28e-06 | 2.31e-01 | 0.0811 |
| 91039 | DPP9 | LZE7T | Human | Esophagus | ESCC | 8.40e-08 | 3.91e-01 | 0.0667 |
| 91039 | DPP9 | LZE24T | Human | Esophagus | ESCC | 2.35e-07 | 1.93e-01 | 0.0596 |
| 91039 | DPP9 | P1T-E | Human | Esophagus | ESCC | 7.82e-17 | 5.88e-01 | 0.0875 |
| 91039 | DPP9 | P2T-E | Human | Esophagus | ESCC | 1.61e-09 | 7.69e-02 | 0.1177 |
| 91039 | DPP9 | P4T-E | Human | Esophagus | ESCC | 2.64e-05 | 2.08e-01 | 0.1323 |
| 91039 | DPP9 | P5T-E | Human | Esophagus | ESCC | 2.99e-12 | 1.16e-01 | 0.1327 |
| Page: 1 2 3 4 5 6 |
| Tissue | Expression Dynamics | Abbreviation |
| Colorectum (GSE201348) |  | FAP: Familial adenomatous polyposis |
| CRC: Colorectal cancer | ||
| Colorectum (HTA11) |  | AD: Adenomas |
| SER: Sessile serrated lesions | ||
| MSI-H: Microsatellite-high colorectal cancer | ||
| MSS: Microsatellite stable colorectal cancer | ||
| Esophagus | 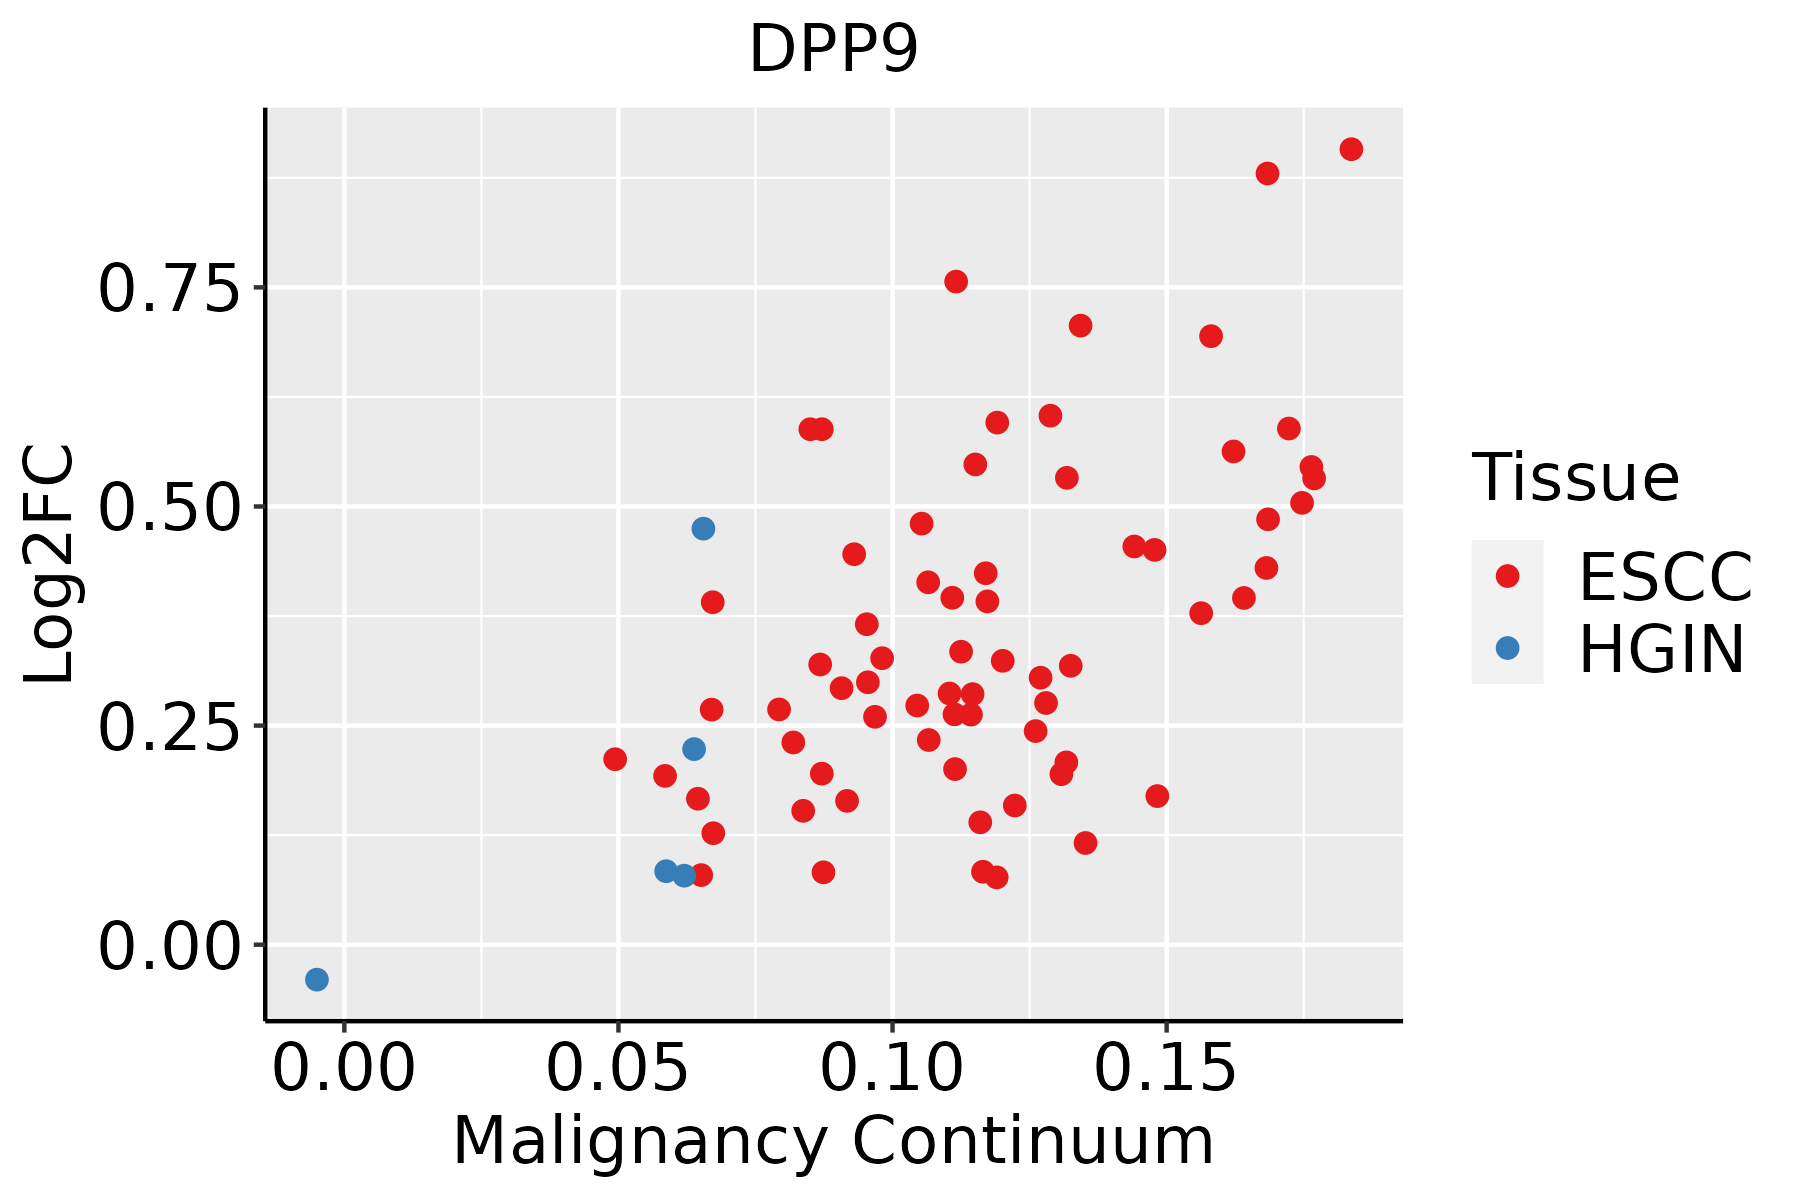 | ESCC: Esophageal squamous cell carcinoma |
| HGIN: High-grade intraepithelial neoplasias | ||
| LGIN: Low-grade intraepithelial neoplasias | ||
| Liver | 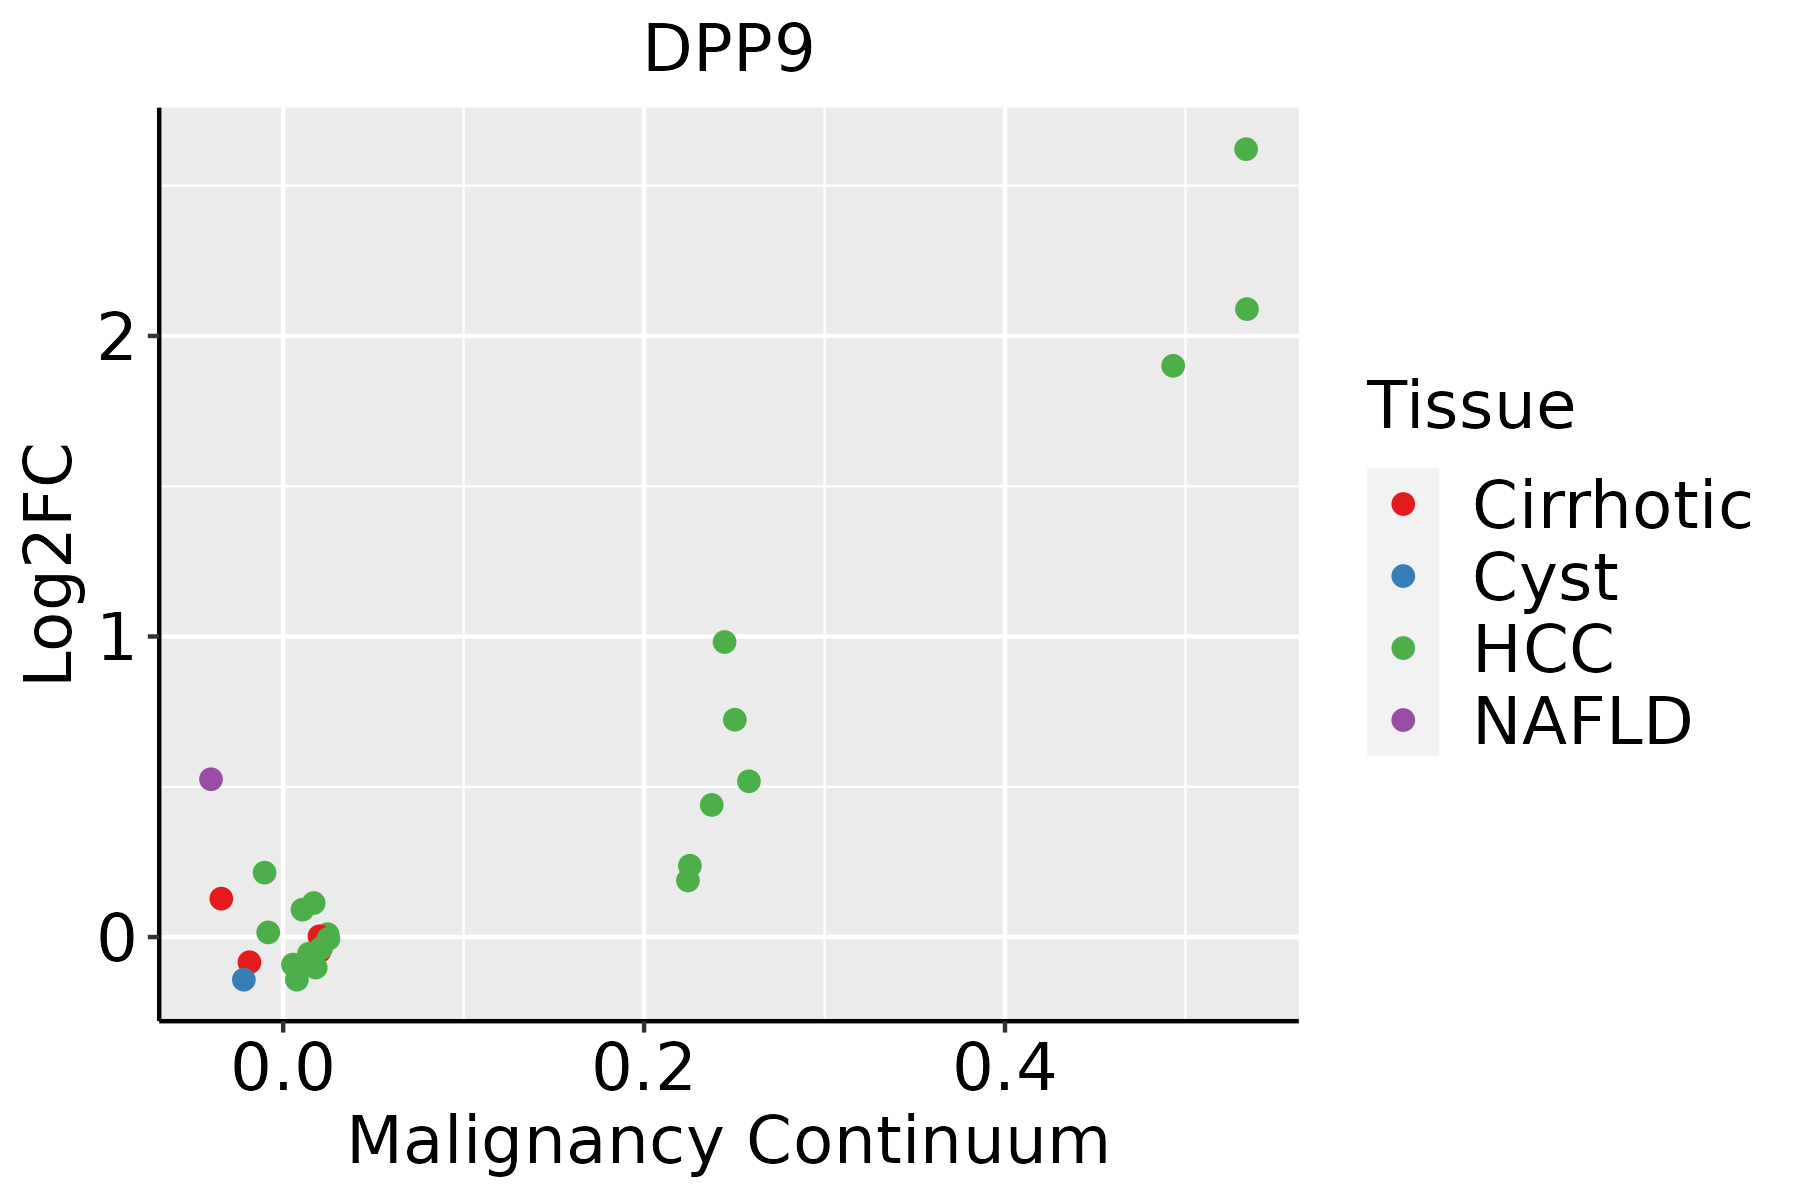 | HCC: Hepatocellular carcinoma |
| NAFLD: Non-alcoholic fatty liver disease | ||
| Oral Cavity | 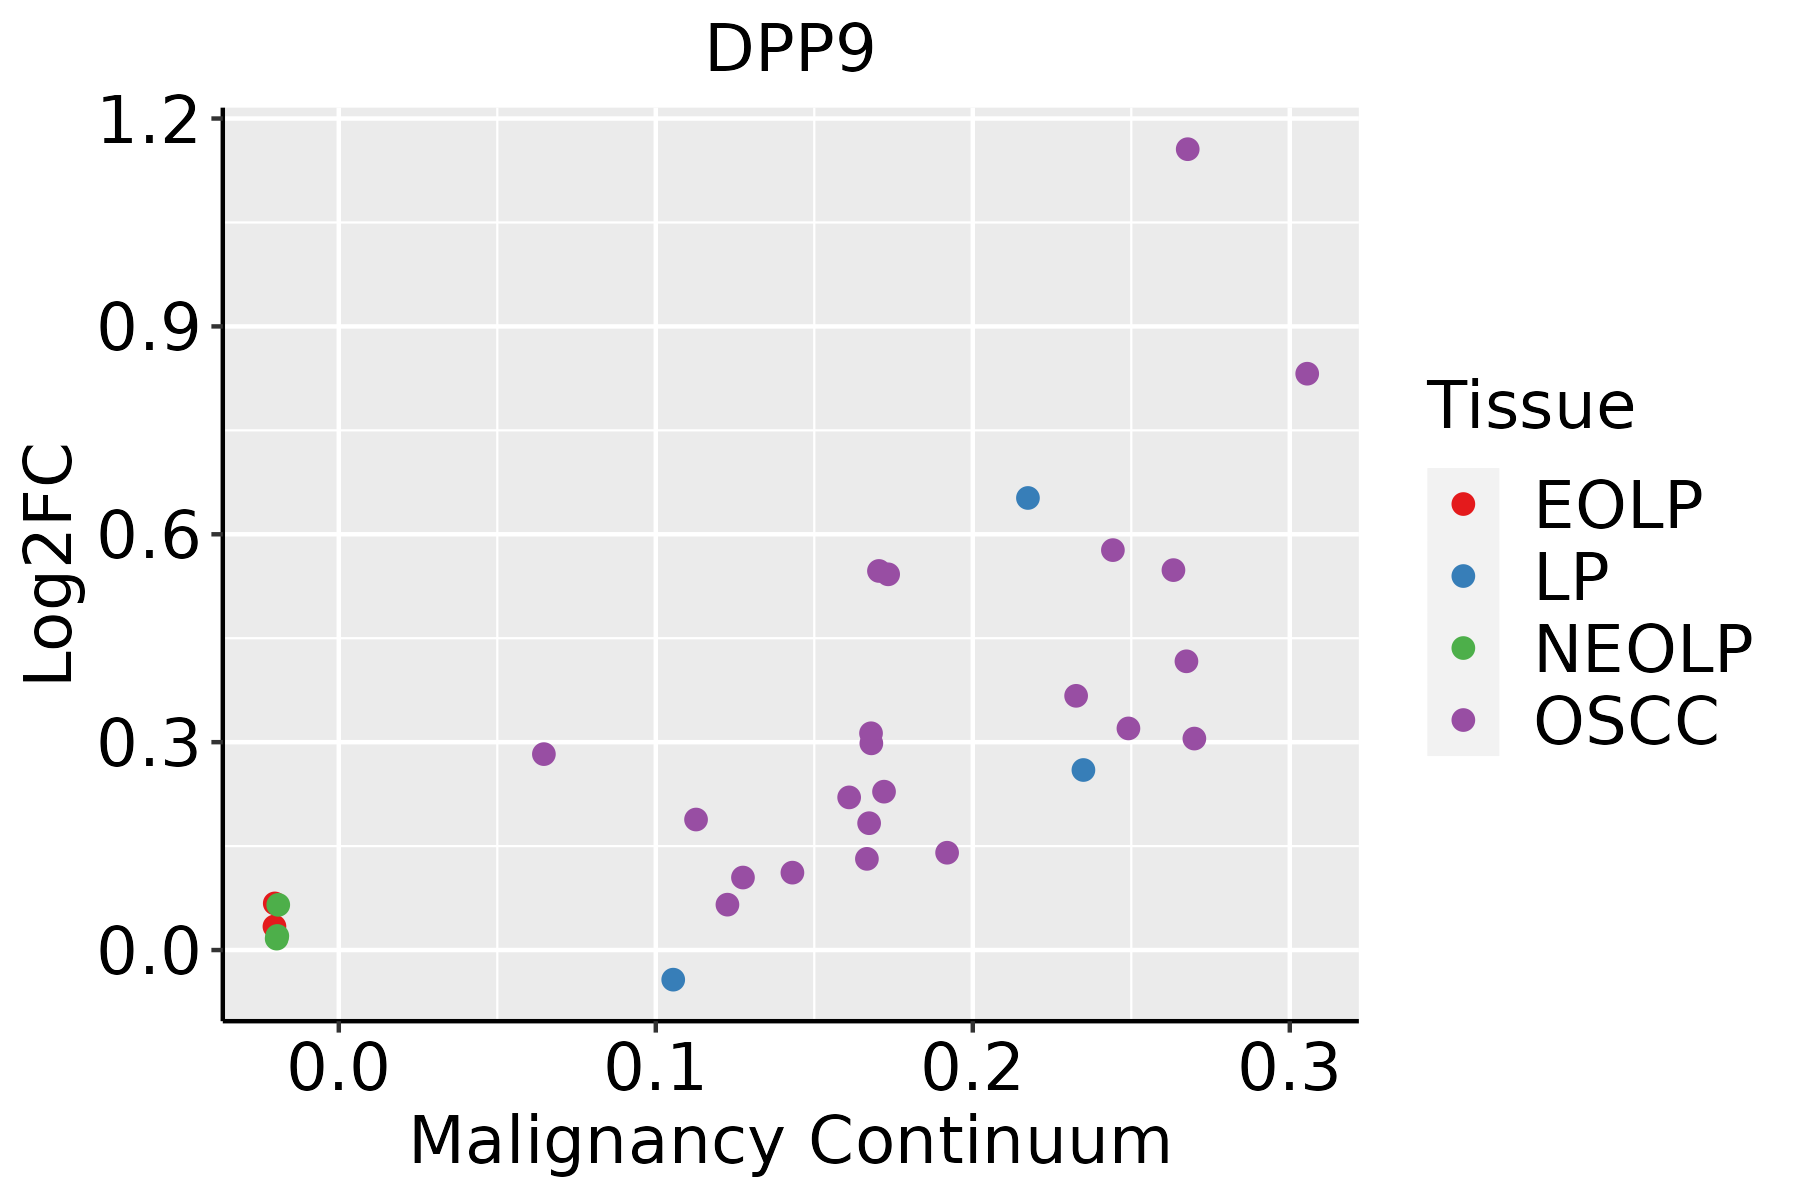 | EOLP: Erosive Oral lichen planus |
| LP: leukoplakia | ||
| NEOLP: Non-erosive oral lichen planus | ||
| OSCC: Oral squamous cell carcinoma | ||
| Skin |  | AK: Actinic keratosis |
| cSCC: Cutaneous squamous cell carcinoma | ||
| SCCIS:squamous cell carcinoma in situ | ||
| Thyroid |  | ATC: Anaplastic thyroid cancer |
| HT: Hashimoto's thyroiditis | ||
| PTC: Papillary thyroid cancer |
| ∗log2FC in expression of this searched gene in stem-like cells from each diseased tissue sample relative to stem-like cells in normal samples in each tissue plotted against the malignancy continuum. Samples are colored based on if they are from different disease stage. |
Top |
Malignant transformation related pathway analysis |
| Find out the enriched GO biological processes and KEGG pathways involved in transition from healthy to precancer to cancer |
| Tissue | Disease Stage | Enriched GO biological Processes |
| Colorectum | AD |  |
| Colorectum | SER |  |
| Colorectum | MSS |  |
| Colorectum | MSI-H |  |
| Colorectum | FAP |  |
| ∗Top 15 enriched GO BP terms are showed in the bar plot of each disease state in each tissue. Each row represents a significant GO biological process which is colored according to the -log10(p.adjust). |
| Page: 1 2 3 4 5 6 7 8 9 |
| GO ID | Tissue | Disease Stage | Description | Gene Ratio | Bg Ratio | pvalue | p.adjust | Count |
| Page: 1 |
| Pathway ID | Tissue | Disease Stage | Description | Gene Ratio | Bg Ratio | pvalue | p.adjust | qvalue | Count |
| Page: 1 |
Top |
Cell-cell communication analysis |
| Identification of potential cell-cell interactions between two cell types and their ligand-receptor pairs for different disease states |
| Ligand | Receptor | LRpair | Pathway | Tissue | Disease Stage |
| Page: 1 |
Top |
Single-cell gene regulatory network inference analysis |
| Find out the significant the regulons (TFs) and the target genes of each regulon across cell types for different disease states |
| TF | Cell Type | Tissue | Disease Stage | Target Gene | RSS | Regulon Activity |
| ∗The dot plots of a searched regulon are shown for all cell subpopulations in each disease state of each tissue based on the regulon specific score inferred using pySCENIC and by calculating the average expression. |
| Page: 1 |
Top |
Somatic mutation of malignant transformation related genes |
| Annotation of somatic variants for genes involved in malignant transformation |
| Hugo Symbol | Variant Class | Variant Classification | dbSNP RS | HGVSc | HGVSp | HGVSp Short | SWISSPROT | BIOTYPE | SIFT | PolyPhen | Tumor Sample Barcode | Tissue | Histology | Sex | Age | Stage | Therapy Types | Drugs | Outcome |
| DPP9 | SNV | Missense_Mutation | c.119N>A | p.Arg40Gln | p.R40Q | Q86TI2 | protein_coding | tolerated(0.57) | benign(0) | TCGA-AC-A23H-01 | Breast | breast invasive carcinoma | Female | >=65 | I/II | Unknown | Unknown | PD | |
| DPP9 | SNV | Missense_Mutation | c.1008G>C | p.Arg336Ser | p.R336S | Q86TI2 | protein_coding | deleterious(0.03) | benign(0.021) | TCGA-AC-A2B8-01 | Breast | breast invasive carcinoma | Female | >=65 | I/II | Chemotherapy | chemo | PD | |
| DPP9 | SNV | Missense_Mutation | c.22C>A | p.Arg8Ser | p.R8S | Q86TI2 | protein_coding | deleterious_low_confidence(0.01) | benign(0.071) | TCGA-C8-A12U-01 | Breast | breast invasive carcinoma | Female | <65 | I/II | Unknown | Unknown | SD | |
| DPP9 | SNV | Missense_Mutation | novel | c.1347N>C | p.Trp449Cys | p.W449C | Q86TI2 | protein_coding | deleterious(0) | probably_damaging(1) | TCGA-LD-A74U-01 | Breast | breast invasive carcinoma | Female | >=65 | III/IV | Chemotherapy | taxotere | SD |
| DPP9 | deletion | Frame_Shift_Del | novel | c.8_9delAG | p.Lys3SerfsTer2 | p.K3Sfs*2 | Q86TI2 | protein_coding | TCGA-AO-A0J9-01 | Breast | breast invasive carcinoma | Female | <65 | III/IV | Chemotherapy | cyclophosphamide | PD | ||
| DPP9 | insertion | Frame_Shift_Ins | novel | c.83_84insT | p.Glu28AspfsTer21 | p.E28Dfs*21 | Q86TI2 | protein_coding | TCGA-B6-A0IM-01 | Breast | breast invasive carcinoma | Female | >=65 | I/II | Unknown | Unknown | SD | ||
| DPP9 | insertion | In_Frame_Ins | novel | c.82_83insCTTCCTTTTACAAAATAG | p.Ala27_Glu28insAlaSerPheTyrLysIle | p.A27_E28insASFYKI | Q86TI2 | protein_coding | TCGA-B6-A0IM-01 | Breast | breast invasive carcinoma | Female | >=65 | I/II | Unknown | Unknown | SD | ||
| DPP9 | deletion | Frame_Shift_Del | novel | c.2613delN | p.Arg872AlafsTer47 | p.R872Afs*47 | Q86TI2 | protein_coding | TCGA-D8-A27V-01 | Breast | breast invasive carcinoma | Female | <65 | I/II | Hormone Therapy | tamoxiphen | SD | ||
| DPP9 | SNV | Missense_Mutation | c.896N>A | p.Leu299His | p.L299H | Q86TI2 | protein_coding | tolerated(0.54) | benign(0.005) | TCGA-FU-A23K-01 | Cervix | cervical & endocervical cancer | Female | <65 | III/IV | Unknown | Unknown | SD | |
| DPP9 | SNV | Missense_Mutation | rs762557101 | c.1019A>G | p.Lys340Arg | p.K340R | Q86TI2 | protein_coding | tolerated(0.35) | possibly_damaging(0.828) | TCGA-UC-A7PI-01 | Cervix | cervical & endocervical cancer | Female | <65 | I/II | Unknown | Unknown | PD |
| Page: 1 2 3 4 5 6 7 8 9 10 |
Top |
Related drugs of malignant transformation related genes |
| Identification of chemicals and drugs interact with genes involved in malignant transfromation |
| (DGIdb 4.0) |
| Entrez ID | Symbol | Category | Interaction Types | Drug Claim Name | Drug Name | PMIDs |
| 91039 | DPP9 | PROTEASE, ENZYME, DRUGGABLE GENOME | Talabostat | TALABOSTAT | ||
| 91039 | DPP9 | PROTEASE, ENZYME, DRUGGABLE GENOME | Thiomorpholine derivative 2 | |||
| 91039 | DPP9 | PROTEASE, ENZYME, DRUGGABLE GENOME | inhibitor | 252166752 | ||
| 91039 | DPP9 | PROTEASE, ENZYME, DRUGGABLE GENOME | inhibitor | 363894186 | TALABOSTAT | |
| 91039 | DPP9 | PROTEASE, ENZYME, DRUGGABLE GENOME | inhibitor | 363894187 | ||
| 91039 | DPP9 | PROTEASE, ENZYME, DRUGGABLE GENOME | inhibitor | 363894200 | TENELIGLIPTIN | |
| 91039 | DPP9 | PROTEASE, ENZYME, DRUGGABLE GENOME | Thiomorpholine derivative 1 | |||
| 91039 | DPP9 | PROTEASE, ENZYME, DRUGGABLE GENOME | inhibitor | 252166751 |
| Page: 1 |

Copyright 2023-Present -The University of Texas Health Science Center at Houston |