
|
|||||
|
 | |
| |
| |
| |
| |
| |
|
Gene: DPP8 |
Gene summary for DPP8 |
| Gene information | Species | Human | Gene symbol | DPP8 | Gene ID | 54878 |
| Gene name | dipeptidyl peptidase 8 | |
| Gene Alias | DP8 | |
| Cytomap | 15q22.31 | |
| Gene Type | protein-coding | GO ID | GO:0002376 | UniProtAcc | A0A024R5Z6 |
Top |
Malignant transformation analysis |
| Identification of the aberrant gene expression in precancerous and cancerous lesions by comparing the gene expression of stem-like cells in diseased tissues with normal stem cells |
| Entrez ID | Symbol | Replicates | Species | Organ | Tissue | Adj P-value | Log2FC | Malignancy |
| 54878 | DPP8 | LZE4T | Human | Esophagus | ESCC | 5.55e-09 | 1.93e-01 | 0.0811 |
| 54878 | DPP8 | LZE7T | Human | Esophagus | ESCC | 6.75e-08 | 4.29e-01 | 0.0667 |
| 54878 | DPP8 | LZE20T | Human | Esophagus | ESCC | 8.07e-06 | 1.63e-01 | 0.0662 |
| 54878 | DPP8 | LZE24T | Human | Esophagus | ESCC | 5.95e-07 | 2.08e-01 | 0.0596 |
| 54878 | DPP8 | P1T-E | Human | Esophagus | ESCC | 4.70e-07 | 3.54e-01 | 0.0875 |
| 54878 | DPP8 | P2T-E | Human | Esophagus | ESCC | 6.65e-14 | 3.17e-01 | 0.1177 |
| 54878 | DPP8 | P4T-E | Human | Esophagus | ESCC | 9.16e-18 | 3.32e-01 | 0.1323 |
| 54878 | DPP8 | P5T-E | Human | Esophagus | ESCC | 2.21e-07 | 1.29e-01 | 0.1327 |
| 54878 | DPP8 | P8T-E | Human | Esophagus | ESCC | 1.56e-22 | 3.18e-01 | 0.0889 |
| 54878 | DPP8 | P9T-E | Human | Esophagus | ESCC | 3.82e-12 | 2.43e-01 | 0.1131 |
| 54878 | DPP8 | P10T-E | Human | Esophagus | ESCC | 3.56e-17 | 3.39e-01 | 0.116 |
| 54878 | DPP8 | P11T-E | Human | Esophagus | ESCC | 2.41e-09 | 2.45e-01 | 0.1426 |
| 54878 | DPP8 | P12T-E | Human | Esophagus | ESCC | 6.88e-13 | 3.62e-01 | 0.1122 |
| 54878 | DPP8 | P15T-E | Human | Esophagus | ESCC | 1.53e-16 | 4.13e-01 | 0.1149 |
| 54878 | DPP8 | P16T-E | Human | Esophagus | ESCC | 4.07e-13 | 3.69e-01 | 0.1153 |
| 54878 | DPP8 | P19T-E | Human | Esophagus | ESCC | 3.36e-04 | 5.71e-01 | 0.1662 |
| 54878 | DPP8 | P20T-E | Human | Esophagus | ESCC | 7.95e-12 | 2.70e-01 | 0.1124 |
| 54878 | DPP8 | P21T-E | Human | Esophagus | ESCC | 1.30e-08 | 1.49e-01 | 0.1617 |
| 54878 | DPP8 | P22T-E | Human | Esophagus | ESCC | 1.72e-17 | 1.45e-01 | 0.1236 |
| 54878 | DPP8 | P23T-E | Human | Esophagus | ESCC | 5.42e-16 | 3.54e-01 | 0.108 |
| Page: 1 2 3 4 5 |
| Tissue | Expression Dynamics | Abbreviation |
| Esophagus | 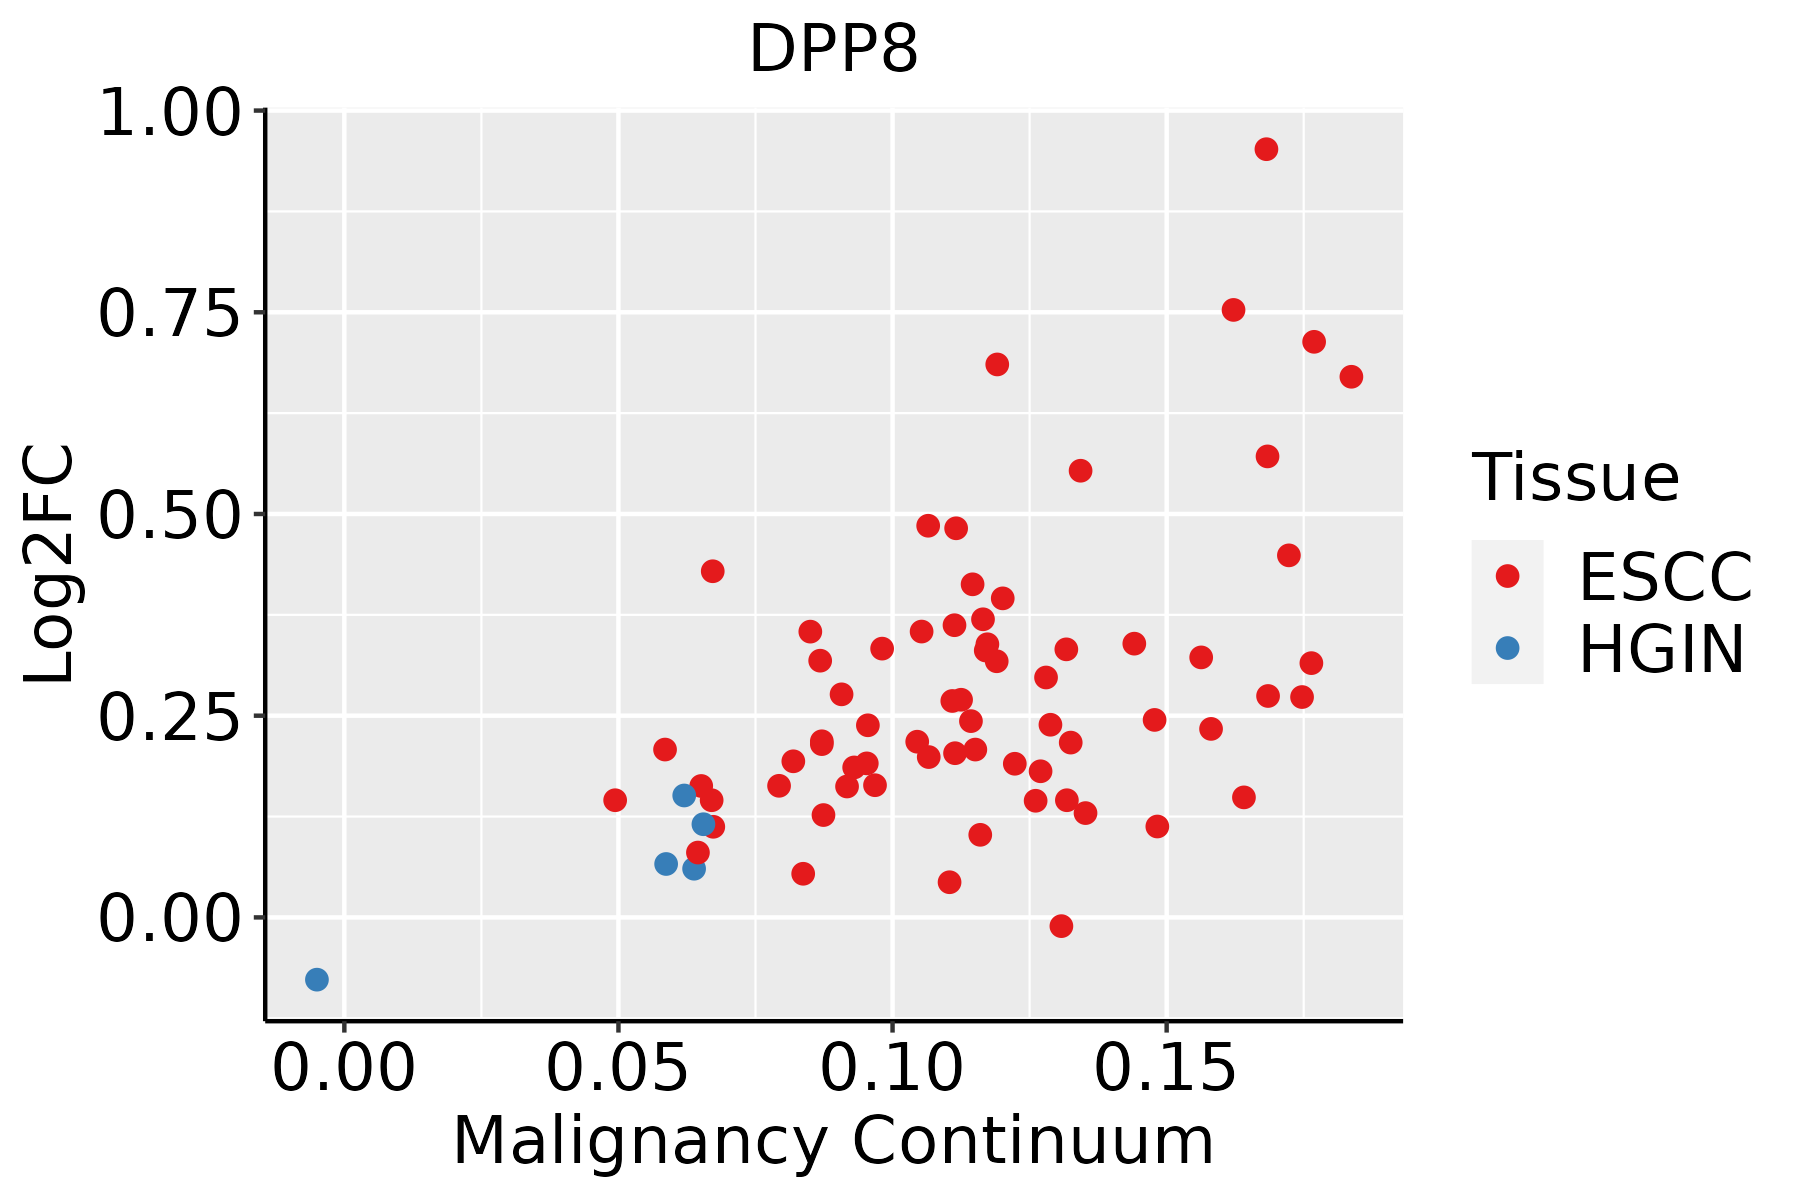 | ESCC: Esophageal squamous cell carcinoma |
| HGIN: High-grade intraepithelial neoplasias | ||
| LGIN: Low-grade intraepithelial neoplasias | ||
| Liver | 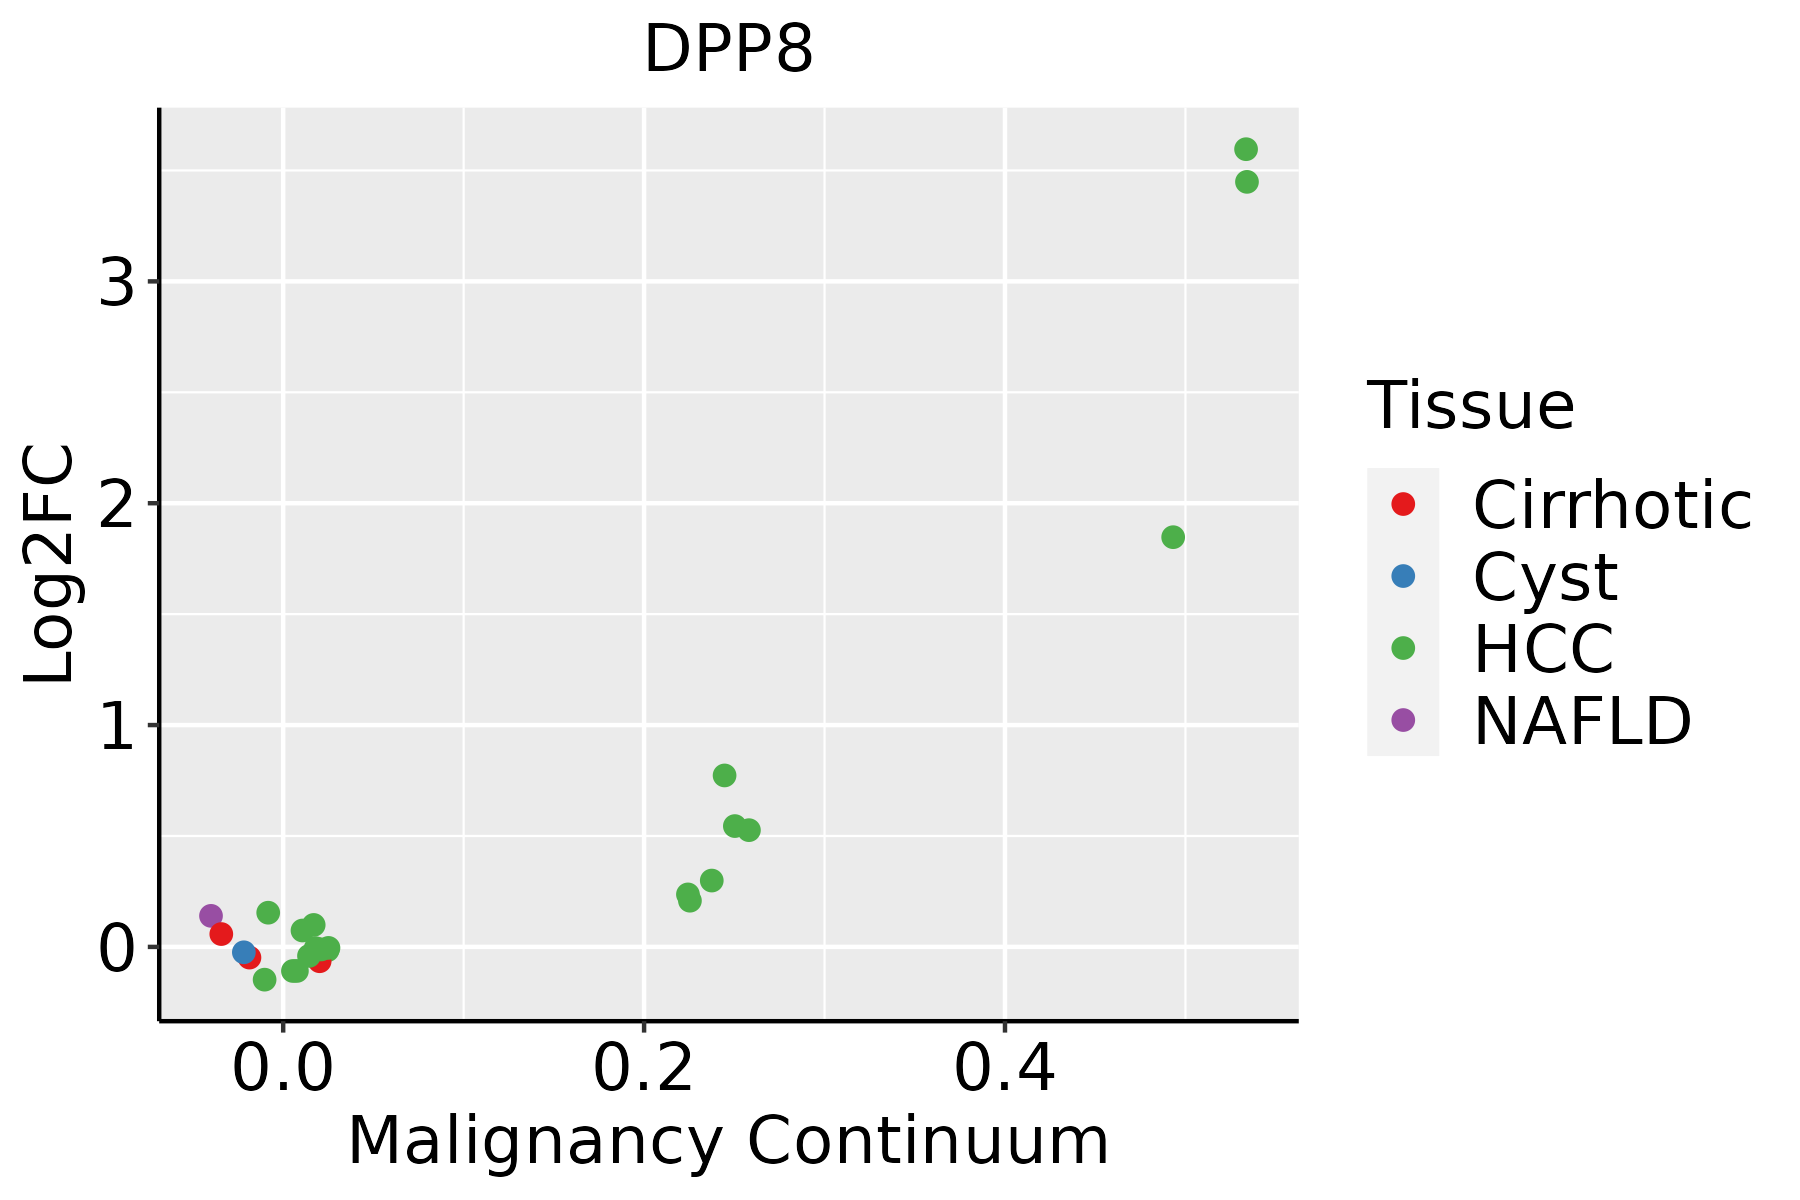 | HCC: Hepatocellular carcinoma |
| NAFLD: Non-alcoholic fatty liver disease | ||
| Oral Cavity | 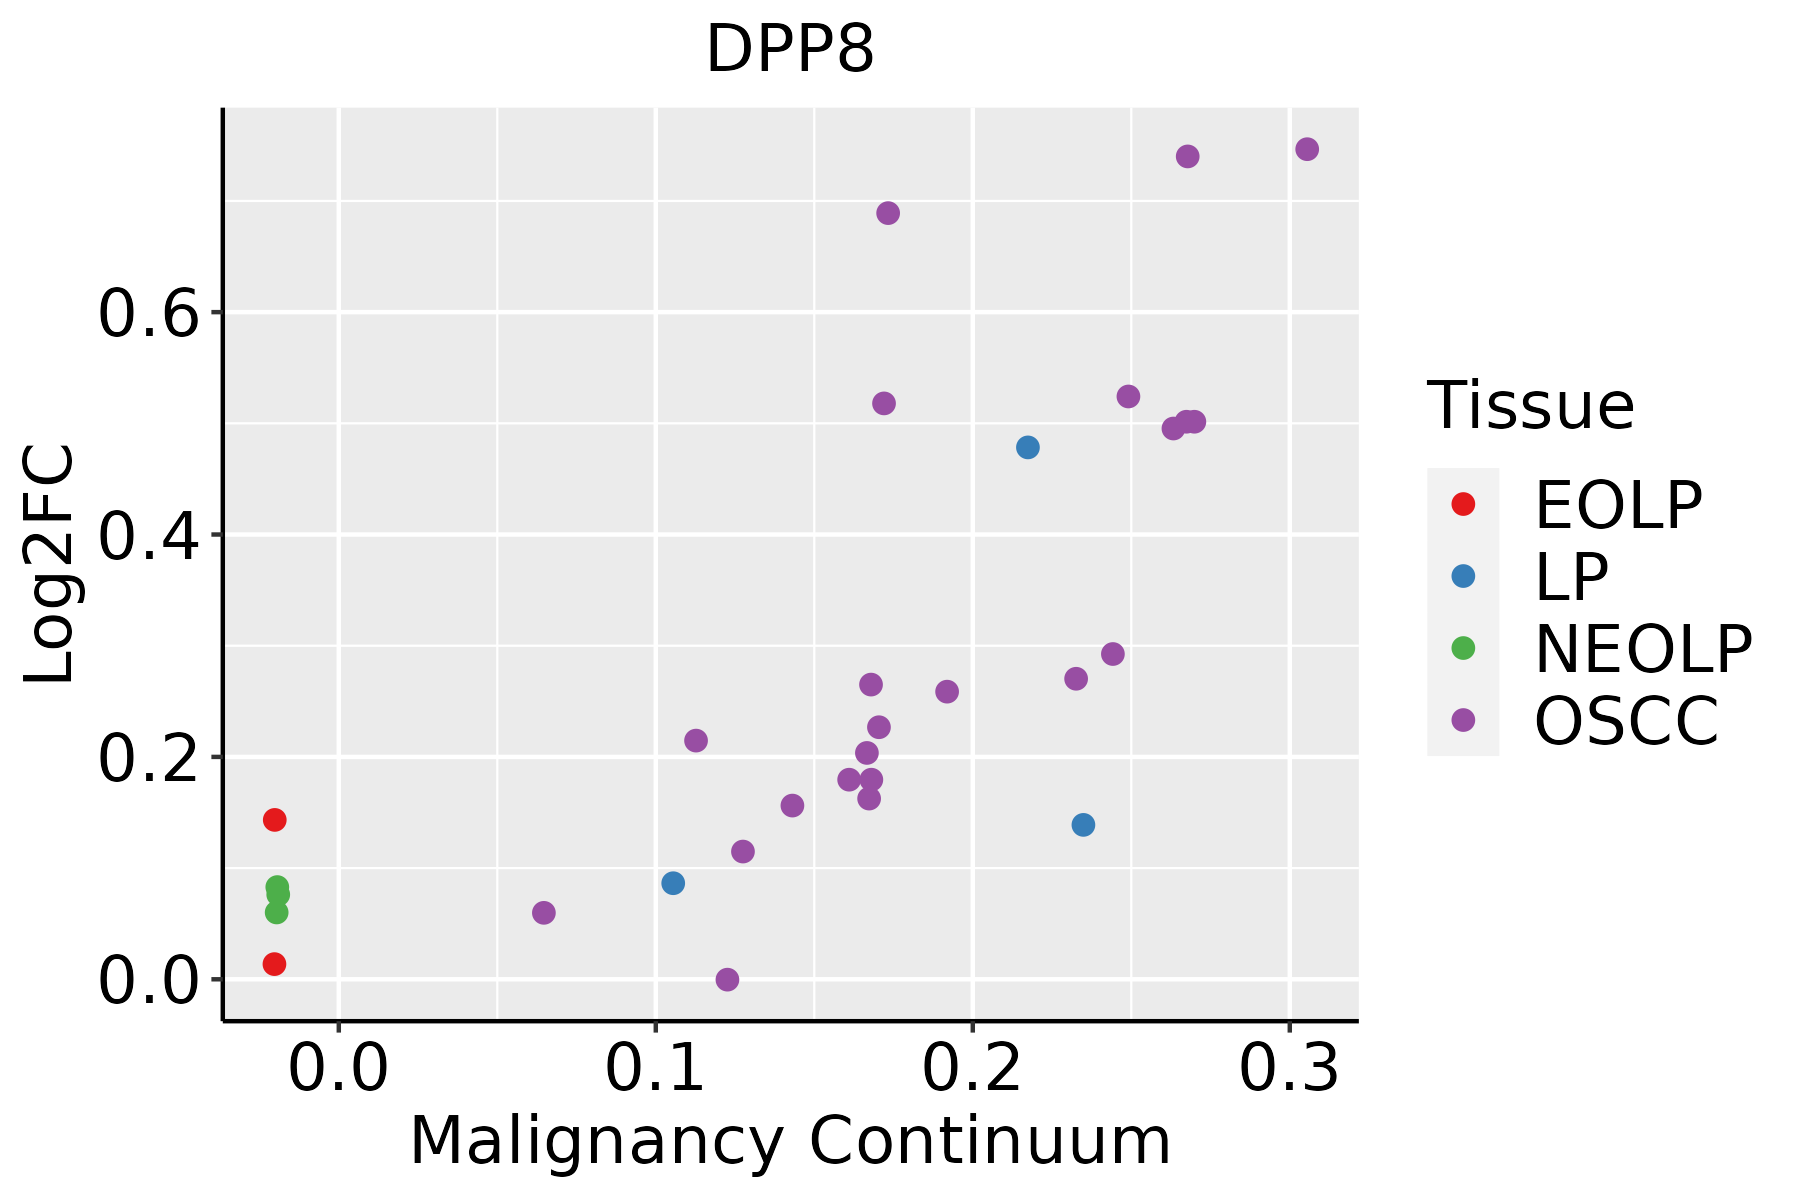 | EOLP: Erosive Oral lichen planus |
| LP: leukoplakia | ||
| NEOLP: Non-erosive oral lichen planus | ||
| OSCC: Oral squamous cell carcinoma | ||
| Thyroid |  | ATC: Anaplastic thyroid cancer |
| HT: Hashimoto's thyroiditis | ||
| PTC: Papillary thyroid cancer |
| ∗log2FC in expression of this searched gene in stem-like cells from each diseased tissue sample relative to stem-like cells in normal samples in each tissue plotted against the malignancy continuum. Samples are colored based on if they are from different disease stage. |
Top |
Malignant transformation related pathway analysis |
| Find out the enriched GO biological processes and KEGG pathways involved in transition from healthy to precancer to cancer |
| Tissue | Disease Stage | Enriched GO biological Processes |
| Colorectum | AD |  |
| Colorectum | SER |  |
| Colorectum | MSS |  |
| Colorectum | MSI-H |  |
| Colorectum | FAP |  |
| ∗Top 15 enriched GO BP terms are showed in the bar plot of each disease state in each tissue. Each row represents a significant GO biological process which is colored according to the -log10(p.adjust). |
| Page: 1 2 3 4 5 6 7 8 9 |
| GO ID | Tissue | Disease Stage | Description | Gene Ratio | Bg Ratio | pvalue | p.adjust | Count |
| Page: 1 |
| Pathway ID | Tissue | Disease Stage | Description | Gene Ratio | Bg Ratio | pvalue | p.adjust | qvalue | Count |
| Page: 1 |
Top |
Cell-cell communication analysis |
| Identification of potential cell-cell interactions between two cell types and their ligand-receptor pairs for different disease states |
| Ligand | Receptor | LRpair | Pathway | Tissue | Disease Stage |
| Page: 1 |
Top |
Single-cell gene regulatory network inference analysis |
| Find out the significant the regulons (TFs) and the target genes of each regulon across cell types for different disease states |
| TF | Cell Type | Tissue | Disease Stage | Target Gene | RSS | Regulon Activity |
| ∗The dot plots of a searched regulon are shown for all cell subpopulations in each disease state of each tissue based on the regulon specific score inferred using pySCENIC and by calculating the average expression. |
| Page: 1 |
Top |
Somatic mutation of malignant transformation related genes |
| Annotation of somatic variants for genes involved in malignant transformation |
| Hugo Symbol | Variant Class | Variant Classification | dbSNP RS | HGVSc | HGVSp | HGVSp Short | SWISSPROT | BIOTYPE | SIFT | PolyPhen | Tumor Sample Barcode | Tissue | Histology | Sex | Age | Stage | Therapy Types | Drugs | Outcome |
| DPP8 | SNV | Missense_Mutation | novel | c.703G>A | p.Asp235Asn | p.D235N | Q6V1X1 | protein_coding | deleterious(0) | probably_damaging(0.949) | TCGA-AN-A046-01 | Breast | breast invasive carcinoma | Female | >=65 | I/II | Unknown | Unknown | SD |
| DPP8 | SNV | Missense_Mutation | c.550N>C | p.Ser184Arg | p.S184R | Q6V1X1 | protein_coding | deleterious(0.01) | benign(0.367) | TCGA-AR-A1AV-01 | Breast | breast invasive carcinoma | Male | >=65 | I/II | Chemotherapy | cytoxan | SD | |
| DPP8 | SNV | Missense_Mutation | novel | c.1524N>G | p.Ile508Met | p.I508M | Q6V1X1 | protein_coding | deleterious(0.03) | benign(0.062) | TCGA-AR-A2LH-01 | Breast | breast invasive carcinoma | Female | <65 | III/IV | Chemotherapy | adriamycin | PD |
| DPP8 | SNV | Missense_Mutation | novel | c.1087G>A | p.Glu363Lys | p.E363K | Q6V1X1 | protein_coding | deleterious(0.05) | benign(0.348) | TCGA-C8-A8HQ-01 | Breast | breast invasive carcinoma | Female | <65 | I/II | Unknown | Unknown | SD |
| DPP8 | SNV | Missense_Mutation | c.736N>A | p.Glu246Lys | p.E246K | Q6V1X1 | protein_coding | deleterious(0) | probably_damaging(0.944) | TCGA-D8-A27G-01 | Breast | breast invasive carcinoma | Female | >=65 | I/II | Unknown | Unknown | SD | |
| DPP8 | insertion | In_Frame_Ins | novel | c.596_597insGGG | p.Gln199_Gln200insGly | p.Q199_Q200insG | Q6V1X1 | protein_coding | TCGA-A8-A08O-01 | Breast | breast invasive carcinoma | Female | <65 | III/IV | Chemotherapy | docetaxel | PD | ||
| DPP8 | insertion | Frame_Shift_Ins | novel | c.595_596insCTGGGCGACAG | p.Gln199ProfsTer8 | p.Q199Pfs*8 | Q6V1X1 | protein_coding | TCGA-A8-A08O-01 | Breast | breast invasive carcinoma | Female | <65 | III/IV | Chemotherapy | docetaxel | PD | ||
| DPP8 | SNV | Missense_Mutation | rs746990491 | c.1312N>G | p.Ile438Val | p.I438V | Q6V1X1 | protein_coding | tolerated(0.36) | benign(0.163) | TCGA-2W-A8YY-01 | Cervix | cervical & endocervical cancer | Female | <65 | I/II | Chemotherapy | cisplatin | CR |
| DPP8 | SNV | Missense_Mutation | novel | c.421N>T | p.Ala141Ser | p.A141S | Q6V1X1 | protein_coding | tolerated(0.34) | benign(0.01) | TCGA-2W-A8YY-01 | Cervix | cervical & endocervical cancer | Female | <65 | I/II | Chemotherapy | cisplatin | CR |
| DPP8 | SNV | Missense_Mutation | c.1879N>T | p.Leu627Phe | p.L627F | Q6V1X1 | protein_coding | tolerated(0.7) | benign(0.157) | TCGA-EK-A2PG-01 | Cervix | cervical & endocervical cancer | Female | >=65 | I/II | Unknown | Unknown | SD |
| Page: 1 2 3 4 5 6 7 8 9 |
Top |
Related drugs of malignant transformation related genes |
| Identification of chemicals and drugs interact with genes involved in malignant transfromation |
| (DGIdb 4.0) |
| Entrez ID | Symbol | Category | Interaction Types | Drug Claim Name | Drug Name | PMIDs |
| 54878 | DPP8 | DRUGGABLE GENOME, PROTEASE, ENZYME | inhibitor | 178103150 | ||
| 54878 | DPP8 | DRUGGABLE GENOME, PROTEASE, ENZYME | inhibitor | 252166751 | ||
| 54878 | DPP8 | DRUGGABLE GENOME, PROTEASE, ENZYME | Thiomorpholine derivative 1 | |||
| 54878 | DPP8 | DRUGGABLE GENOME, PROTEASE, ENZYME | Thiomorpholine derivative 2 | |||
| 54878 | DPP8 | DRUGGABLE GENOME, PROTEASE, ENZYME | inhibitor | 252166752 | ||
| 54878 | DPP8 | DRUGGABLE GENOME, PROTEASE, ENZYME | inhibitor | 363894200 | TENELIGLIPTIN | |
| 54878 | DPP8 | DRUGGABLE GENOME, PROTEASE, ENZYME | Talabostat | TALABOSTAT | ||
| 54878 | DPP8 | DRUGGABLE GENOME, PROTEASE, ENZYME | inhibitor | 363894187 | ||
| 54878 | DPP8 | DRUGGABLE GENOME, PROTEASE, ENZYME | inhibitor | 363894186 | TALABOSTAT |
| Page: 1 |

Copyright 2023-Present -The University of Texas Health Science Center at Houston |