
|
|||||
|
 | |
| |
| |
| |
| |
| |
|
Gene: DPP7 |
Gene summary for DPP7 |
| Gene information | Species | Human | Gene symbol | DPP7 | Gene ID | 29952 |
| Gene name | dipeptidyl peptidase 7 | |
| Gene Alias | DPP2 | |
| Cytomap | 9q34.3 | |
| Gene Type | protein-coding | GO ID | GO:0006508 | UniProtAcc | Q9UHL4 |
Top |
Malignant transformation analysis |
| Identification of the aberrant gene expression in precancerous and cancerous lesions by comparing the gene expression of stem-like cells in diseased tissues with normal stem cells |
| Entrez ID | Symbol | Replicates | Species | Organ | Tissue | Adj P-value | Log2FC | Malignancy |
| 29952 | DPP7 | CA_HPV_1 | Human | Cervix | CC | 7.10e-05 | -2.22e-01 | 0.0264 |
| 29952 | DPP7 | CA_HPV_3 | Human | Cervix | CC | 7.30e-07 | 7.61e-02 | 0.0414 |
| 29952 | DPP7 | CCI_1 | Human | Cervix | CC | 7.01e-07 | -6.08e-01 | 0.528 |
| 29952 | DPP7 | CCI_2 | Human | Cervix | CC | 2.32e-03 | -5.42e-01 | 0.5249 |
| 29952 | DPP7 | CCI_3 | Human | Cervix | CC | 3.43e-06 | -5.51e-01 | 0.516 |
| 29952 | DPP7 | Tumor | Human | Cervix | CC | 1.14e-06 | -2.60e-01 | 0.1241 |
| 29952 | DPP7 | sample3 | Human | Cervix | CC | 1.11e-07 | -2.37e-01 | 0.1387 |
| 29952 | DPP7 | H2 | Human | Cervix | HSIL_HPV | 1.18e-02 | -2.90e-01 | 0.0632 |
| 29952 | DPP7 | L1 | Human | Cervix | CC | 1.21e-07 | -2.99e-01 | 0.0802 |
| 29952 | DPP7 | T3 | Human | Cervix | CC | 9.25e-07 | -2.37e-01 | 0.1389 |
| 29952 | DPP7 | HTA11_347_2000001011 | Human | Colorectum | AD | 1.76e-02 | 4.63e-02 | -0.1954 |
| 29952 | DPP7 | HTA11_696_2000001011 | Human | Colorectum | AD | 3.25e-03 | 6.46e-02 | -0.1464 |
| 29952 | DPP7 | HTA11_866_3004761011 | Human | Colorectum | AD | 8.08e-06 | 1.77e-01 | 0.096 |
| 29952 | DPP7 | HTA11_10711_2000001011 | Human | Colorectum | AD | 1.26e-02 | 1.21e-01 | 0.0338 |
| 29952 | DPP7 | HTA11_7696_3000711011 | Human | Colorectum | AD | 1.86e-03 | 1.33e-01 | 0.0674 |
| 29952 | DPP7 | HTA11_6818_2000001021 | Human | Colorectum | AD | 2.60e-03 | 2.82e-01 | 0.0588 |
| 29952 | DPP7 | HTA11_99999970781_79442 | Human | Colorectum | MSS | 6.89e-04 | 1.48e-01 | 0.294 |
| 29952 | DPP7 | HTA11_99999965104_69814 | Human | Colorectum | MSS | 5.92e-08 | 3.08e-01 | 0.281 |
| 29952 | DPP7 | HTA11_99999971662_82457 | Human | Colorectum | MSS | 2.72e-06 | 2.43e-01 | 0.3859 |
| 29952 | DPP7 | HTA11_99999974143_84620 | Human | Colorectum | MSS | 4.60e-09 | 2.31e-01 | 0.3005 |
| Page: 1 2 3 4 5 6 7 8 |
| Tissue | Expression Dynamics | Abbreviation |
| Cervix | 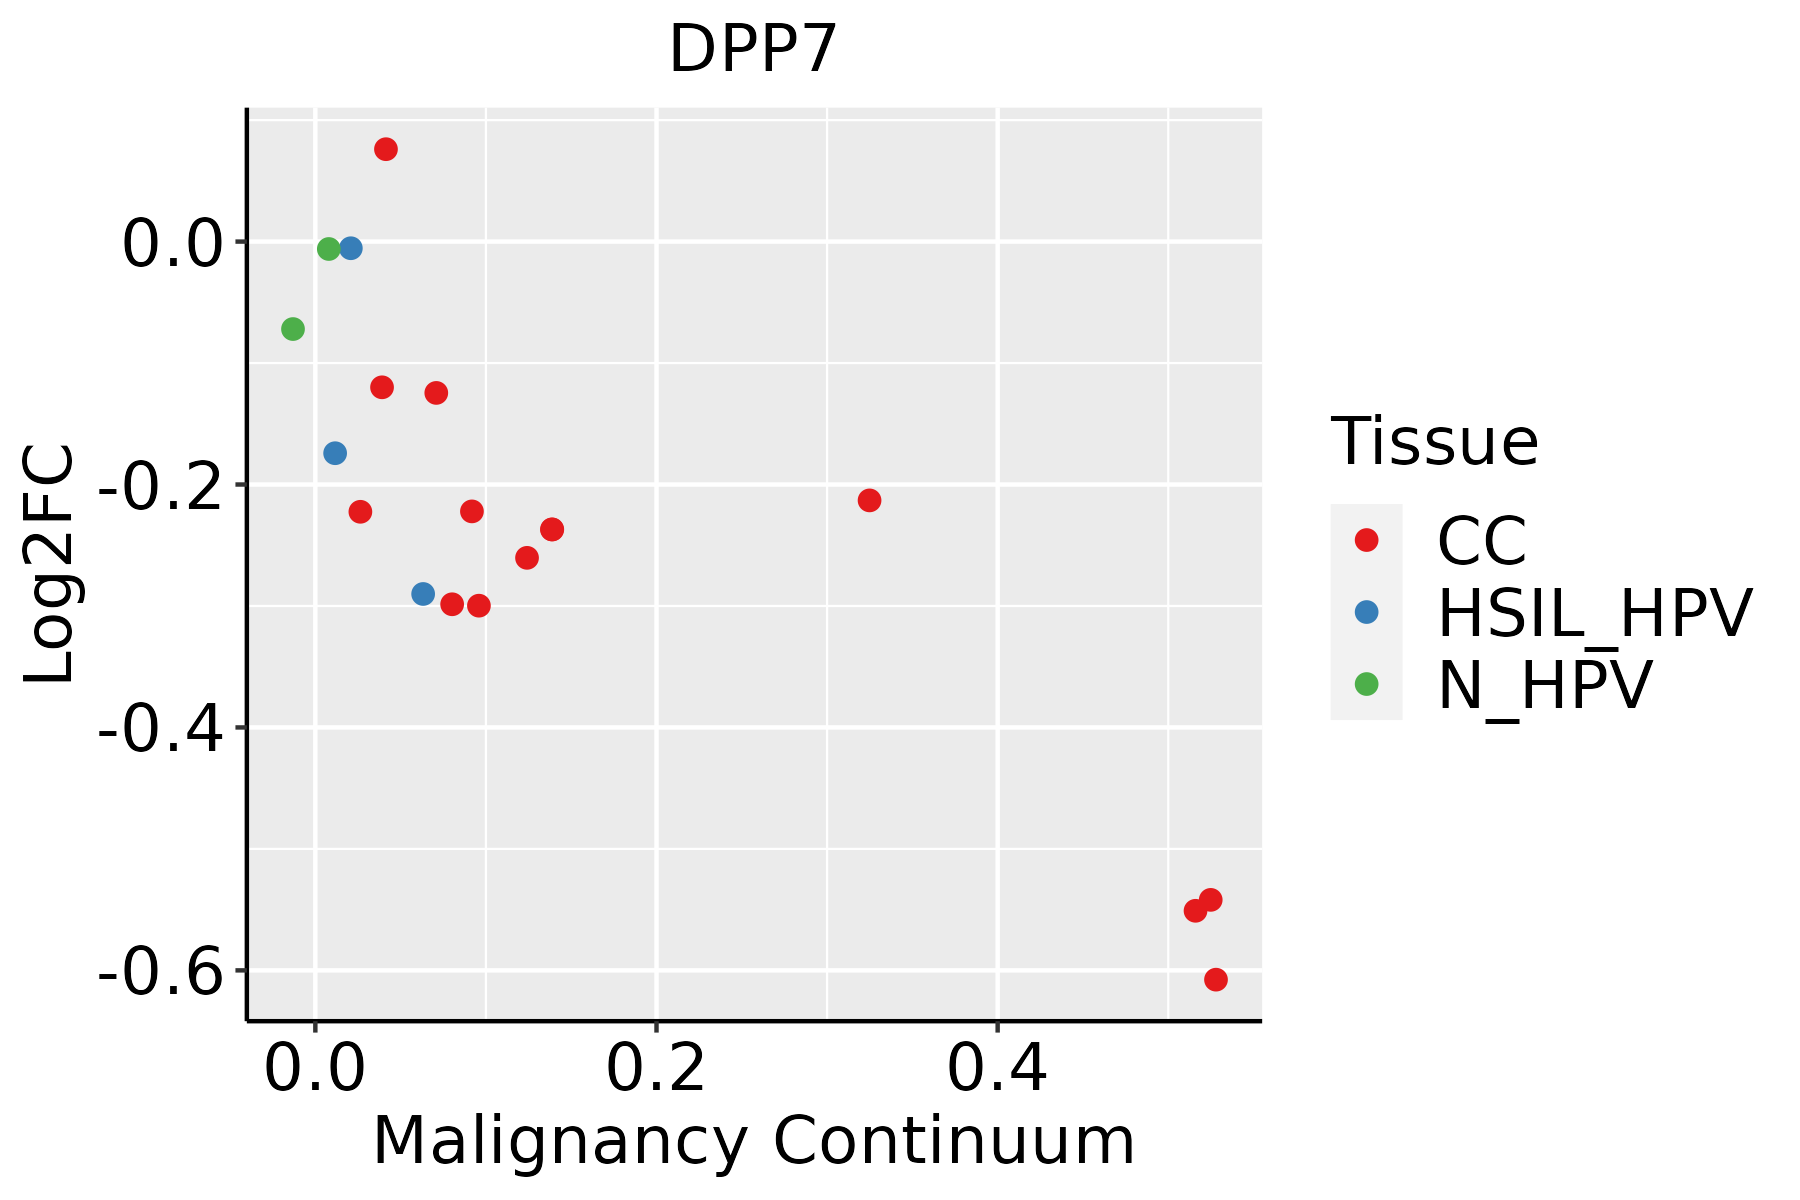 | CC: Cervix cancer |
| HSIL_HPV: HPV-infected high-grade squamous intraepithelial lesions | ||
| N_HPV: HPV-infected normal cervix | ||
| Colorectum (GSE201348) |  | FAP: Familial adenomatous polyposis |
| CRC: Colorectal cancer | ||
| Colorectum (HTA11) |  | AD: Adenomas |
| SER: Sessile serrated lesions | ||
| MSI-H: Microsatellite-high colorectal cancer | ||
| MSS: Microsatellite stable colorectal cancer | ||
| Esophagus | 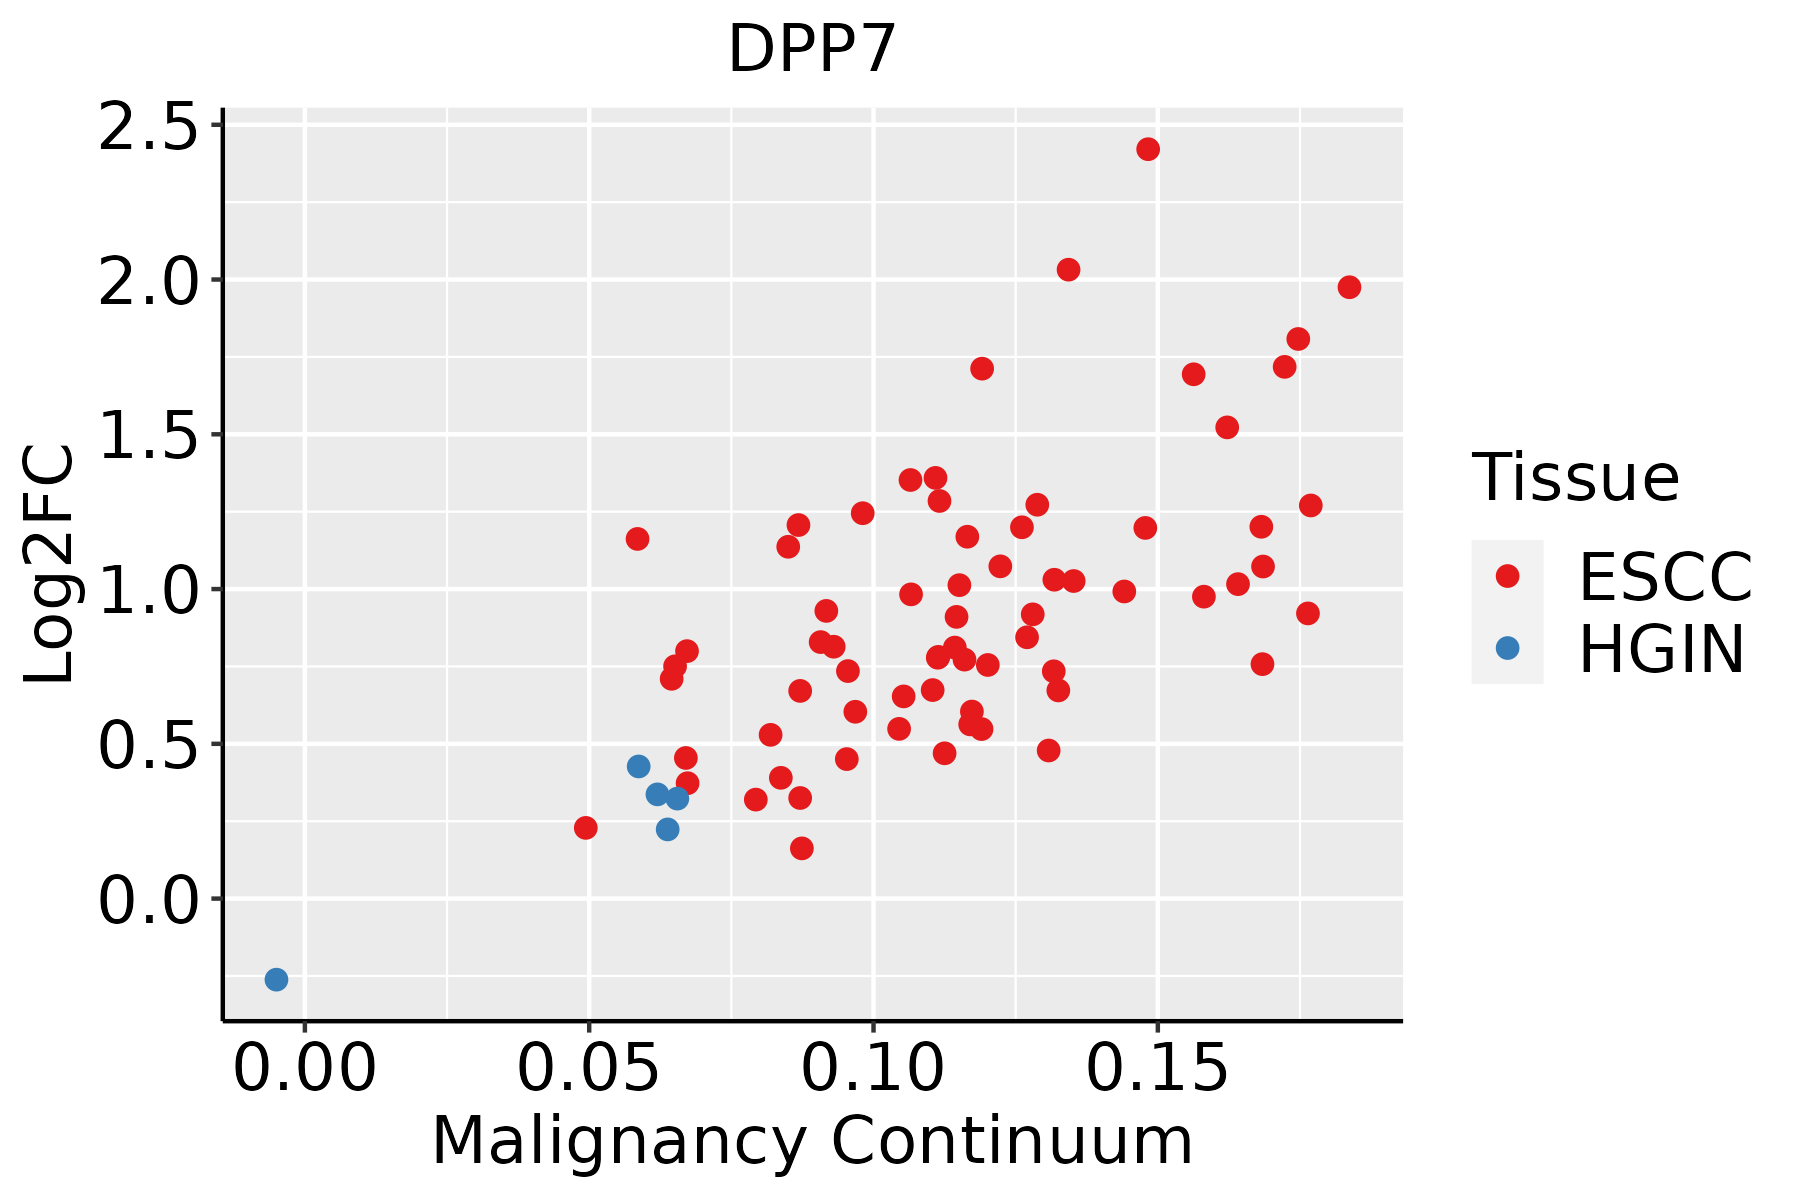 | ESCC: Esophageal squamous cell carcinoma |
| HGIN: High-grade intraepithelial neoplasias | ||
| LGIN: Low-grade intraepithelial neoplasias | ||
| Liver | 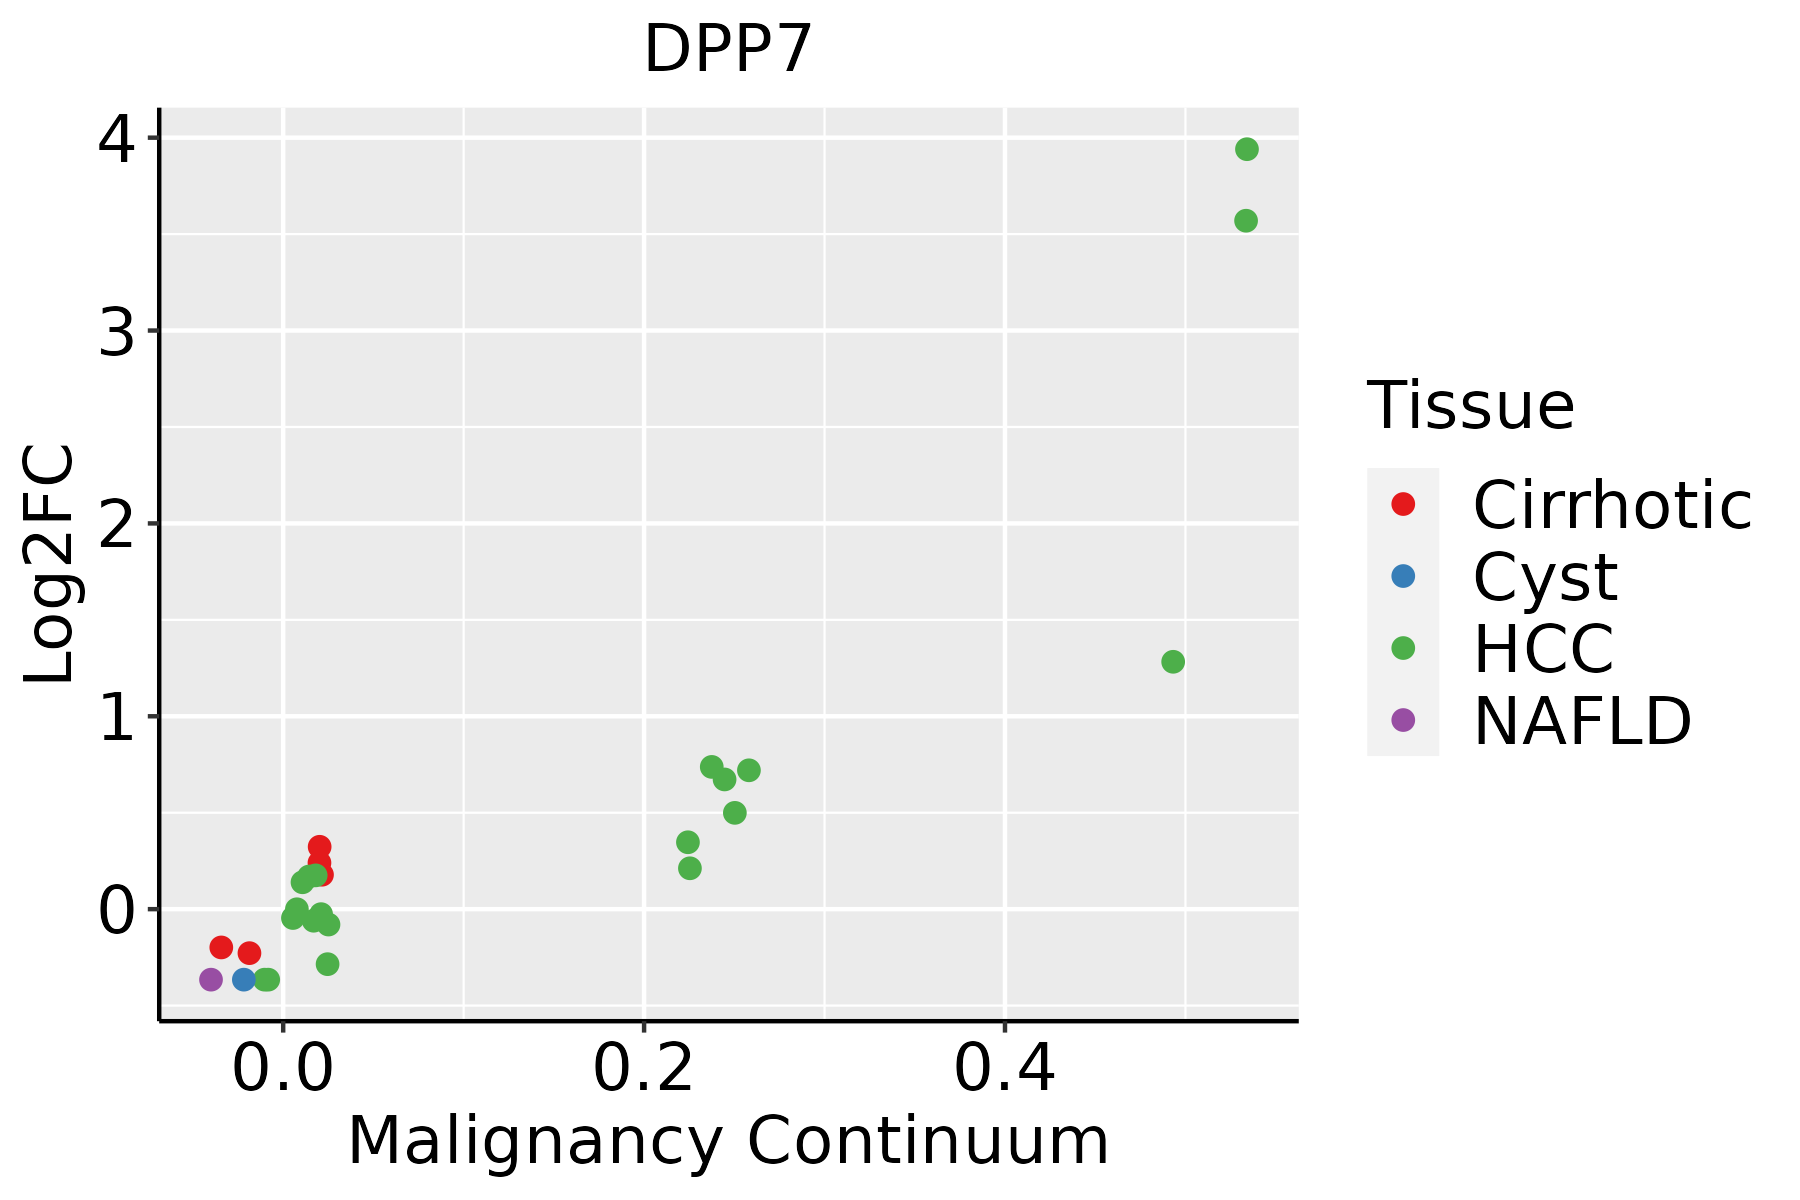 | HCC: Hepatocellular carcinoma |
| NAFLD: Non-alcoholic fatty liver disease | ||
| Oral Cavity |  | EOLP: Erosive Oral lichen planus |
| LP: leukoplakia | ||
| NEOLP: Non-erosive oral lichen planus | ||
| OSCC: Oral squamous cell carcinoma | ||
| Skin | 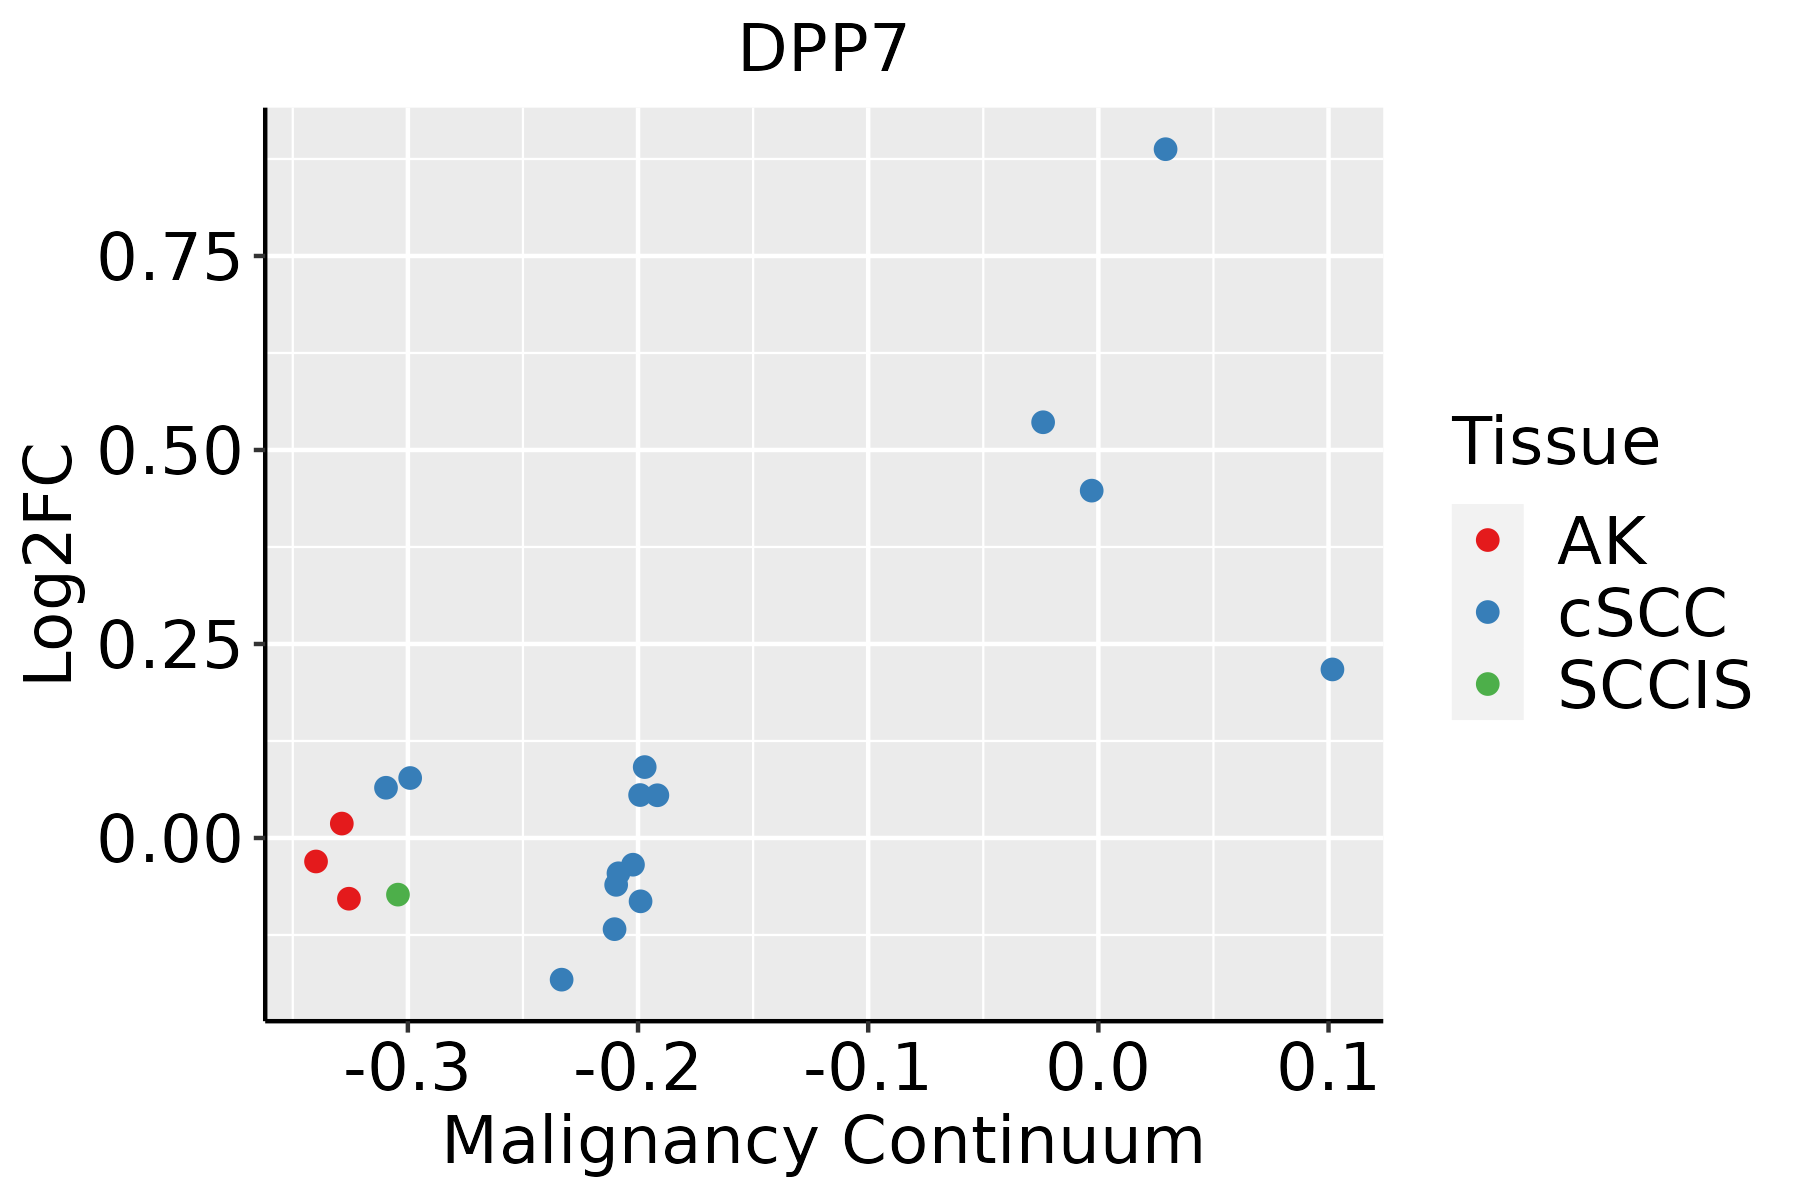 | AK: Actinic keratosis |
| cSCC: Cutaneous squamous cell carcinoma | ||
| SCCIS:squamous cell carcinoma in situ | ||
| Thyroid | 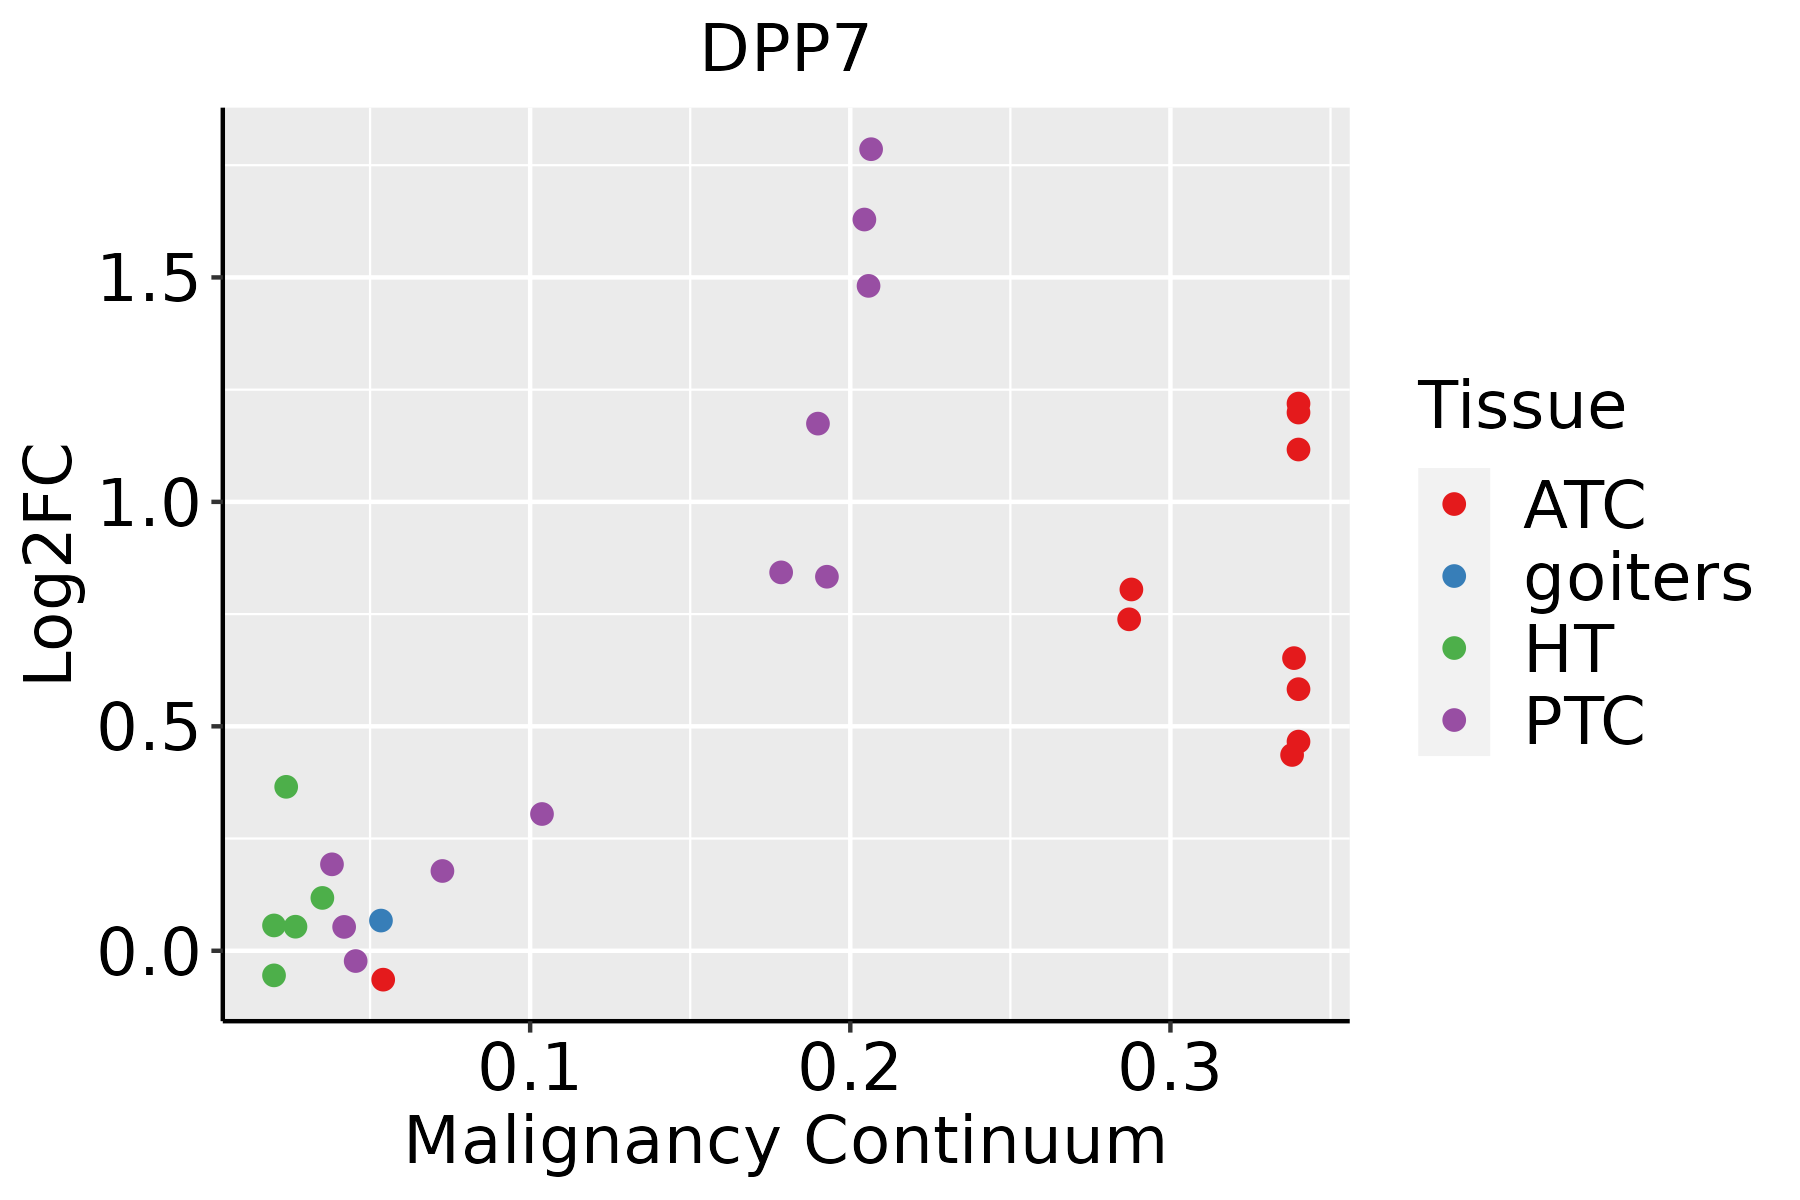 | ATC: Anaplastic thyroid cancer |
| HT: Hashimoto's thyroiditis | ||
| PTC: Papillary thyroid cancer |
| ∗log2FC in expression of this searched gene in stem-like cells from each diseased tissue sample relative to stem-like cells in normal samples in each tissue plotted against the malignancy continuum. Samples are colored based on if they are from different disease stage. |
Top |
Malignant transformation related pathway analysis |
| Find out the enriched GO biological processes and KEGG pathways involved in transition from healthy to precancer to cancer |
| Tissue | Disease Stage | Enriched GO biological Processes |
| Colorectum | AD |  |
| Colorectum | SER |  |
| Colorectum | MSS |  |
| Colorectum | MSI-H |  |
| Colorectum | FAP |  |
| ∗Top 15 enriched GO BP terms are showed in the bar plot of each disease state in each tissue. Each row represents a significant GO biological process which is colored according to the -log10(p.adjust). |
| Page: 1 2 3 4 5 6 7 8 9 |
| GO ID | Tissue | Disease Stage | Description | Gene Ratio | Bg Ratio | pvalue | p.adjust | Count |
| Page: 1 |
| Pathway ID | Tissue | Disease Stage | Description | Gene Ratio | Bg Ratio | pvalue | p.adjust | qvalue | Count |
| Page: 1 |
Top |
Cell-cell communication analysis |
| Identification of potential cell-cell interactions between two cell types and their ligand-receptor pairs for different disease states |
| Ligand | Receptor | LRpair | Pathway | Tissue | Disease Stage |
| Page: 1 |
Top |
Single-cell gene regulatory network inference analysis |
| Find out the significant the regulons (TFs) and the target genes of each regulon across cell types for different disease states |
| TF | Cell Type | Tissue | Disease Stage | Target Gene | RSS | Regulon Activity |
| ∗The dot plots of a searched regulon are shown for all cell subpopulations in each disease state of each tissue based on the regulon specific score inferred using pySCENIC and by calculating the average expression. |
| Page: 1 |
Top |
Somatic mutation of malignant transformation related genes |
| Annotation of somatic variants for genes involved in malignant transformation |
| Hugo Symbol | Variant Class | Variant Classification | dbSNP RS | HGVSc | HGVSp | HGVSp Short | SWISSPROT | BIOTYPE | SIFT | PolyPhen | Tumor Sample Barcode | Tissue | Histology | Sex | Age | Stage | Therapy Types | Drugs | Outcome |
| DPP7 | SNV | Missense_Mutation | c.545N>A | p.Ala182Glu | p.A182E | Q9UHL4 | protein_coding | deleterious(0) | probably_damaging(0.999) | TCGA-A2-A3Y0-01 | Breast | breast invasive carcinoma | Female | <65 | I/II | Chemotherapy | adriamycin | CR | |
| DPP7 | SNV | Missense_Mutation | c.1102N>C | p.Phe368Leu | p.F368L | Q9UHL4 | protein_coding | deleterious(0) | probably_damaging(0.96) | TCGA-BH-A0HA-01 | Breast | breast invasive carcinoma | Female | <65 | I/II | Unknown | Unknown | SD | |
| DPP7 | deletion | Frame_Shift_Del | novel | c.596delN | p.Asn199ThrfsTer57 | p.N199Tfs*57 | Q9UHL4 | protein_coding | TCGA-D8-A27V-01 | Breast | breast invasive carcinoma | Female | <65 | I/II | Hormone Therapy | tamoxiphen | SD | ||
| DPP7 | SNV | Missense_Mutation | rs146742762 | c.1306N>A | p.Val436Ile | p.V436I | Q9UHL4 | protein_coding | tolerated(1) | benign(0.011) | TCGA-2W-A8YY-01 | Cervix | cervical & endocervical cancer | Female | <65 | I/II | Chemotherapy | cisplatin | CR |
| DPP7 | SNV | Missense_Mutation | c.1205G>A | p.Gly402Asp | p.G402D | Q9UHL4 | protein_coding | tolerated(0.88) | benign(0.003) | TCGA-AA-A010-01 | Colorectum | colon adenocarcinoma | Female | <65 | I/II | Chemotherapy | folinic | CR | |
| DPP7 | deletion | Frame_Shift_Del | c.1212_1213delCA | p.Arg405SerfsTer55 | p.R405Sfs*55 | Q9UHL4 | protein_coding | TCGA-CM-4743-01 | Colorectum | colon adenocarcinoma | Male | >=65 | I/II | Chemotherapy | capecitabine | SD | |||
| DPP7 | deletion | Frame_Shift_Del | c.1205delG | p.Gly402ValfsTer28 | p.G402Vfs*28 | Q9UHL4 | protein_coding | TCGA-NH-A5IV-01 | Colorectum | colon adenocarcinoma | Female | >=65 | I/II | Unknown | Unknown | SD | |||
| DPP7 | SNV | Missense_Mutation | rs770245778 | c.1303N>A | p.Ala435Thr | p.A435T | Q9UHL4 | protein_coding | deleterious(0) | possibly_damaging(0.661) | TCGA-A5-A0GG-01 | Endometrium | uterine corpus endometrioid carcinoma | Female | >=65 | I/II | Unknown | Unknown | SD |
| DPP7 | SNV | Missense_Mutation | rs777004339 | c.613N>A | p.Val205Ile | p.V205I | Q9UHL4 | protein_coding | tolerated(0.1) | benign(0.383) | TCGA-AJ-A3BG-01 | Endometrium | uterine corpus endometrioid carcinoma | Female | >=65 | I/II | Chemotherapy | carboplatin | PD |
| DPP7 | SNV | Missense_Mutation | rs756944196 | c.1219N>A | p.Ala407Thr | p.A407T | Q9UHL4 | protein_coding | tolerated(0.2) | possibly_damaging(0.811) | TCGA-AP-A0LM-01 | Endometrium | uterine corpus endometrioid carcinoma | Female | <65 | III/IV | Chemotherapy | cisplatin | SD |
| Page: 1 2 3 4 |
Top |
Related drugs of malignant transformation related genes |
| Identification of chemicals and drugs interact with genes involved in malignant transfromation |
| (DGIdb 4.0) |
| Entrez ID | Symbol | Category | Interaction Types | Drug Claim Name | Drug Name | PMIDs |
| 29952 | DPP7 | PROTEASE, ENZYME, DRUGGABLE GENOME | CRWCYVOHVXAEMF-LBPRGKRZSA-N | |||
| 29952 | DPP7 | PROTEASE, ENZYME, DRUGGABLE GENOME | BDBM50382283 | |||
| 29952 | DPP7 | PROTEASE, ENZYME, DRUGGABLE GENOME | US8470836, 8 | |||
| 29952 | DPP7 | PROTEASE, ENZYME, DRUGGABLE GENOME | US8470836, 2 | |||
| 29952 | DPP7 | PROTEASE, ENZYME, DRUGGABLE GENOME | inhibitor | 178103152 | ||
| 29952 | DPP7 | PROTEASE, ENZYME, DRUGGABLE GENOME | US8470836, 5 | |||
| 29952 | DPP7 | PROTEASE, ENZYME, DRUGGABLE GENOME | BDBM50434165 | |||
| 29952 | DPP7 | PROTEASE, ENZYME, DRUGGABLE GENOME | BDBM50434164 | |||
| 29952 | DPP7 | PROTEASE, ENZYME, DRUGGABLE GENOME | US8470836, 6 |
| Page: 1 |

Copyright 2023-Present -The University of Texas Health Science Center at Houston |