
|
|||||
|
 | |
| |
| |
| |
| |
| |
|
Gene: DPP6 |
Gene summary for DPP6 |
| Gene information | Species | Human | Gene symbol | DPP6 | Gene ID | 1804 |
| Gene name | dipeptidyl peptidase like 6 | |
| Gene Alias | DPL1 | |
| Cytomap | 7q36.2 | |
| Gene Type | protein-coding | GO ID | GO:0006508 | UniProtAcc | A7E2E4 |
Top |
Malignant transformation analysis |
| Identification of the aberrant gene expression in precancerous and cancerous lesions by comparing the gene expression of stem-like cells in diseased tissues with normal stem cells |
| Entrez ID | Symbol | Replicates | Species | Organ | Tissue | Adj P-value | Log2FC | Malignancy |
| 1804 | DPP6 | HTA11_3410_2000001011 | Human | Colorectum | AD | 1.19e-20 | -6.52e-01 | 0.0155 |
| 1804 | DPP6 | HTA11_2487_2000001011 | Human | Colorectum | SER | 5.24e-06 | -5.30e-01 | -0.1808 |
| 1804 | DPP6 | HTA11_1938_2000001011 | Human | Colorectum | AD | 1.61e-05 | -5.62e-01 | -0.0811 |
| 1804 | DPP6 | HTA11_78_2000001011 | Human | Colorectum | AD | 9.75e-06 | -4.81e-01 | -0.1088 |
| 1804 | DPP6 | HTA11_347_2000001011 | Human | Colorectum | AD | 4.08e-03 | -3.01e-01 | -0.1954 |
| 1804 | DPP6 | HTA11_3361_2000001011 | Human | Colorectum | AD | 6.37e-06 | -5.67e-01 | -0.1207 |
| 1804 | DPP6 | HTA11_83_2000001011 | Human | Colorectum | SER | 2.43e-04 | -5.66e-01 | -0.1526 |
| 1804 | DPP6 | HTA11_696_2000001011 | Human | Colorectum | AD | 2.26e-15 | -4.81e-01 | -0.1464 |
| 1804 | DPP6 | HTA11_866_2000001011 | Human | Colorectum | AD | 8.53e-13 | -5.08e-01 | -0.1001 |
| 1804 | DPP6 | HTA11_1391_2000001011 | Human | Colorectum | AD | 5.41e-08 | -4.88e-01 | -0.059 |
| 1804 | DPP6 | HTA11_866_3004761011 | Human | Colorectum | AD | 4.74e-14 | -6.01e-01 | 0.096 |
| 1804 | DPP6 | HTA11_8622_2000001021 | Human | Colorectum | SER | 5.71e-03 | -6.30e-01 | 0.0528 |
| 1804 | DPP6 | HTA11_10711_2000001011 | Human | Colorectum | AD | 3.04e-10 | -6.37e-01 | 0.0338 |
| 1804 | DPP6 | HTA11_7696_3000711011 | Human | Colorectum | AD | 5.47e-17 | -5.68e-01 | 0.0674 |
| 1804 | DPP6 | HTA11_99999970781_79442 | Human | Colorectum | MSS | 5.15e-20 | -5.99e-01 | 0.294 |
| 1804 | DPP6 | HTA11_99999971662_82457 | Human | Colorectum | MSS | 2.81e-14 | -5.32e-01 | 0.3859 |
| 1804 | DPP6 | HTA11_99999974143_84620 | Human | Colorectum | MSS | 2.84e-21 | -5.97e-01 | 0.3005 |
| 1804 | DPP6 | A015-C-203 | Human | Colorectum | FAP | 1.93e-18 | -3.97e-01 | -0.1294 |
| 1804 | DPP6 | A015-C-204 | Human | Colorectum | FAP | 3.47e-02 | -2.25e-01 | -0.0228 |
| 1804 | DPP6 | A014-C-040 | Human | Colorectum | FAP | 1.32e-03 | -3.03e-01 | -0.1184 |
| Page: 1 2 3 4 |
| Tissue | Expression Dynamics | Abbreviation |
| Colorectum (GSE201348) |  | FAP: Familial adenomatous polyposis |
| CRC: Colorectal cancer | ||
| Colorectum (HTA11) |  | AD: Adenomas |
| SER: Sessile serrated lesions | ||
| MSI-H: Microsatellite-high colorectal cancer | ||
| MSS: Microsatellite stable colorectal cancer | ||
| Endometrium | 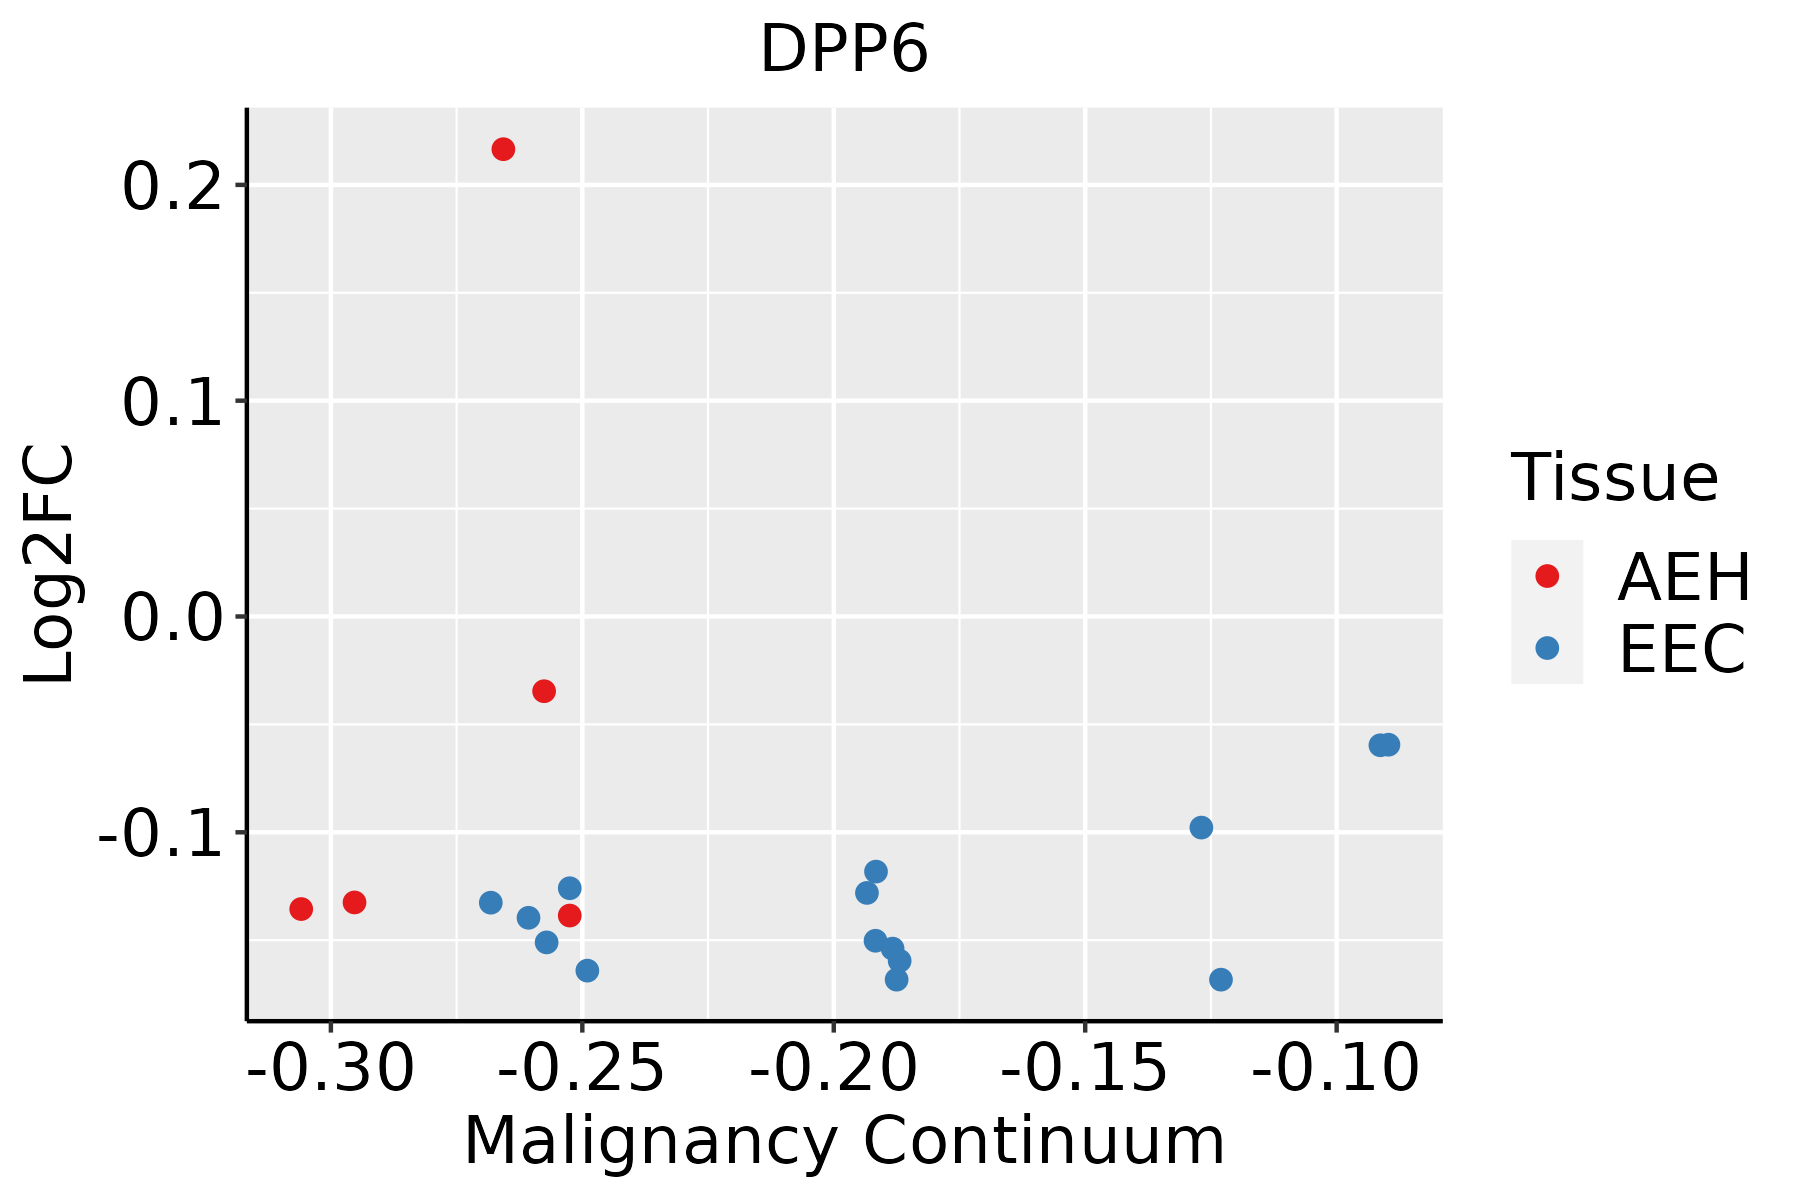 | AEH: Atypical endometrial hyperplasia |
| EEC: Endometrioid Cancer |
| ∗log2FC in expression of this searched gene in stem-like cells from each diseased tissue sample relative to stem-like cells in normal samples in each tissue plotted against the malignancy continuum. Samples are colored based on if they are from different disease stage. |
Top |
Malignant transformation related pathway analysis |
| Find out the enriched GO biological processes and KEGG pathways involved in transition from healthy to precancer to cancer |
| Tissue | Disease Stage | Enriched GO biological Processes |
| Colorectum | AD |  |
| Colorectum | SER |  |
| Colorectum | MSS |  |
| Colorectum | MSI-H |  |
| Colorectum | FAP |  |
| ∗Top 15 enriched GO BP terms are showed in the bar plot of each disease state in each tissue. Each row represents a significant GO biological process which is colored according to the -log10(p.adjust). |
| Page: 1 2 3 4 5 6 7 8 9 |
| GO ID | Tissue | Disease Stage | Description | Gene Ratio | Bg Ratio | pvalue | p.adjust | Count |
| GO:0072659 | Colorectum | AD | protein localization to plasma membrane | 122/3918 | 284/18723 | 2.86e-17 | 1.49e-14 | 122 |
| GO:1990778 | Colorectum | AD | protein localization to cell periphery | 129/3918 | 333/18723 | 5.51e-14 | 1.15e-11 | 129 |
| GO:00726591 | Colorectum | SER | protein localization to plasma membrane | 92/2897 | 284/18723 | 6.36e-13 | 1.86e-10 | 92 |
| GO:19907781 | Colorectum | SER | protein localization to cell periphery | 98/2897 | 333/18723 | 6.09e-11 | 9.57e-09 | 98 |
| GO:00726592 | Colorectum | MSS | protein localization to plasma membrane | 113/3467 | 284/18723 | 3.23e-17 | 1.55e-14 | 113 |
| GO:19907782 | Colorectum | MSS | protein localization to cell periphery | 120/3467 | 333/18723 | 2.02e-14 | 5.47e-12 | 120 |
| GO:00726594 | Colorectum | FAP | protein localization to plasma membrane | 95/2622 | 284/18723 | 4.86e-17 | 9.93e-14 | 95 |
| GO:19907784 | Colorectum | FAP | protein localization to cell periphery | 100/2622 | 333/18723 | 2.19e-14 | 2.68e-11 | 100 |
| GO:0010959 | Colorectum | FAP | regulation of metal ion transport | 83/2622 | 406/18723 | 2.06e-04 | 2.96e-03 | 83 |
| GO:1904062 | Colorectum | FAP | regulation of cation transmembrane transport | 69/2622 | 357/18723 | 3.06e-03 | 2.30e-02 | 69 |
| GO:00726595 | Colorectum | CRC | protein localization to plasma membrane | 80/2078 | 284/18723 | 1.36e-15 | 4.07e-12 | 80 |
| GO:19907785 | Colorectum | CRC | protein localization to cell periphery | 85/2078 | 333/18723 | 8.75e-14 | 1.05e-10 | 85 |
| GO:00109591 | Colorectum | CRC | regulation of metal ion transport | 69/2078 | 406/18723 | 2.05e-04 | 3.48e-03 | 69 |
| GO:19040621 | Colorectum | CRC | regulation of cation transmembrane transport | 58/2078 | 357/18723 | 1.89e-03 | 1.93e-02 | 58 |
| GO:1901379 | Colorectum | CRC | regulation of potassium ion transmembrane transport | 20/2078 | 95/18723 | 3.46e-03 | 2.94e-02 | 20 |
| GO:0043266 | Colorectum | CRC | regulation of potassium ion transport | 22/2078 | 109/18723 | 3.87e-03 | 3.22e-02 | 22 |
| GO:007265914 | Endometrium | AEH | protein localization to plasma membrane | 63/2100 | 284/18723 | 7.58e-08 | 3.92e-06 | 63 |
| GO:19907789 | Endometrium | AEH | protein localization to cell periphery | 68/2100 | 333/18723 | 6.38e-07 | 2.38e-05 | 68 |
| GO:00109597 | Endometrium | AEH | regulation of metal ion transport | 66/2100 | 406/18723 | 1.24e-03 | 1.07e-02 | 66 |
| GO:19013793 | Endometrium | AEH | regulation of potassium ion transmembrane transport | 20/2100 | 95/18723 | 3.91e-03 | 2.64e-02 | 20 |
| Page: 1 2 |
| Pathway ID | Tissue | Disease Stage | Description | Gene Ratio | Bg Ratio | pvalue | p.adjust | qvalue | Count |
| Page: 1 |
Top |
Cell-cell communication analysis |
| Identification of potential cell-cell interactions between two cell types and their ligand-receptor pairs for different disease states |
| Ligand | Receptor | LRpair | Pathway | Tissue | Disease Stage |
| Page: 1 |
Top |
Single-cell gene regulatory network inference analysis |
| Find out the significant the regulons (TFs) and the target genes of each regulon across cell types for different disease states |
| TF | Cell Type | Tissue | Disease Stage | Target Gene | RSS | Regulon Activity |
| ∗The dot plots of a searched regulon are shown for all cell subpopulations in each disease state of each tissue based on the regulon specific score inferred using pySCENIC and by calculating the average expression. |
| Page: 1 |
Top |
Somatic mutation of malignant transformation related genes |
| Annotation of somatic variants for genes involved in malignant transformation |
| Hugo Symbol | Variant Class | Variant Classification | dbSNP RS | HGVSc | HGVSp | HGVSp Short | SWISSPROT | BIOTYPE | SIFT | PolyPhen | Tumor Sample Barcode | Tissue | Histology | Sex | Age | Stage | Therapy Types | Drugs | Outcome |
| DPP6 | SNV | Missense_Mutation | rs773332474 | c.2302G>A | p.Glu768Lys | p.E768K | P42658 | protein_coding | tolerated(0.09) | possibly_damaging(0.728) | TCGA-A2-A0EQ-01 | Breast | breast invasive carcinoma | Female | <65 | I/II | Chemotherapy | adriamycin | SD |
| DPP6 | SNV | Missense_Mutation | c.379N>G | p.Gln127Glu | p.Q127E | P42658 | protein_coding | tolerated(0.27) | benign(0.142) | TCGA-AC-A23H-01 | Breast | breast invasive carcinoma | Female | >=65 | I/II | Unknown | Unknown | PD | |
| DPP6 | SNV | Missense_Mutation | c.1723N>C | p.Asp575His | p.D575H | P42658 | protein_coding | tolerated(0.13) | possibly_damaging(0.571) | TCGA-AC-A23H-01 | Breast | breast invasive carcinoma | Female | >=65 | I/II | Unknown | Unknown | PD | |
| DPP6 | SNV | Missense_Mutation | novel | c.1798N>A | p.Glu600Lys | p.E600K | P42658 | protein_coding | tolerated(0.9) | benign(0) | TCGA-AC-A5XS-01 | Breast | breast invasive carcinoma | Female | >=65 | I/II | Hormone Therapy | femara | SD |
| DPP6 | SNV | Missense_Mutation | rs746793201 | c.2122G>A | p.Val708Met | p.V708M | P42658 | protein_coding | deleterious(0) | probably_damaging(0.993) | TCGA-AC-A5XU-01 | Breast | breast invasive carcinoma | Female | >=65 | I/II | Hormone Therapy | letrozole | SD |
| DPP6 | SNV | Missense_Mutation | c.468C>A | p.Phe156Leu | p.F156L | P42658 | protein_coding | tolerated(0.91) | benign(0.001) | TCGA-AN-A046-01 | Breast | breast invasive carcinoma | Female | >=65 | I/II | Unknown | Unknown | SD | |
| DPP6 | SNV | Missense_Mutation | c.418N>T | p.Asp140Tyr | p.D140Y | P42658 | protein_coding | deleterious(0) | probably_damaging(0.976) | TCGA-AN-A0FT-01 | Breast | breast invasive carcinoma | Female | <65 | I/II | Unknown | Unknown | SD | |
| DPP6 | SNV | Missense_Mutation | c.551N>A | p.Ile184Asn | p.I184N | P42658 | protein_coding | deleterious(0) | possibly_damaging(0.709) | TCGA-BH-A0DX-01 | Breast | breast invasive carcinoma | Female | <65 | I/II | Chemotherapy | taxotere | CR | |
| DPP6 | SNV | Missense_Mutation | c.1159A>G | p.Lys387Glu | p.K387E | P42658 | protein_coding | deleterious(0.01) | benign(0.017) | TCGA-D8-A1XK-01 | Breast | breast invasive carcinoma | Female | <65 | I/II | Chemotherapy | doxorubicine+cyclophosphamide | SD | |
| DPP6 | deletion | Frame_Shift_Del | novel | c.1130delN | p.Met378Ter | p.M378* | P42658 | protein_coding | TCGA-D8-A27V-01 | Breast | breast invasive carcinoma | Female | <65 | I/II | Hormone Therapy | tamoxiphen | SD |
| Page: 1 2 3 4 5 6 7 8 9 10 11 12 13 14 15 16 17 18 19 20 |
Top |
Related drugs of malignant transformation related genes |
| Identification of chemicals and drugs interact with genes involved in malignant transfromation |
| (DGIdb 4.0) |
| Entrez ID | Symbol | Category | Interaction Types | Drug Claim Name | Drug Name | PMIDs |
| 1804 | DPP6 | DRUGGABLE GENOME, ENZYME, TRANSPORTER, PROTEASE | ethanol | ALCOHOL | 32451486 | |
| 1804 | DPP6 | DRUGGABLE GENOME, ENZYME, TRANSPORTER, PROTEASE | haloperidol | HALOPERIDOL | 27023437 |
| Page: 1 |

Copyright 2023-Present -The University of Texas Health Science Center at Houston |